

![[2020학년도 고2 11월 모의고사 해설강의] 물리학Ⅰ- 이광조쌤: 해설강의 풀버전](https://i.ytimg.com/vi_webp/cyIPPt0vrvc/maxresdefault.webp)






![RENEWABLE ENERGY SURGE [NEWS ANALYSIS] #cds #nda #ssbinterview #newsupdate #currentaffairs](https://i.ytimg.com/vi/VCQHQjtpJto/maxresdefault.jpg)






![[반도체소자] 강의 5](https://i.ytimg.com/vi/t-YvA91lEq4/maxresdefault.jpg)

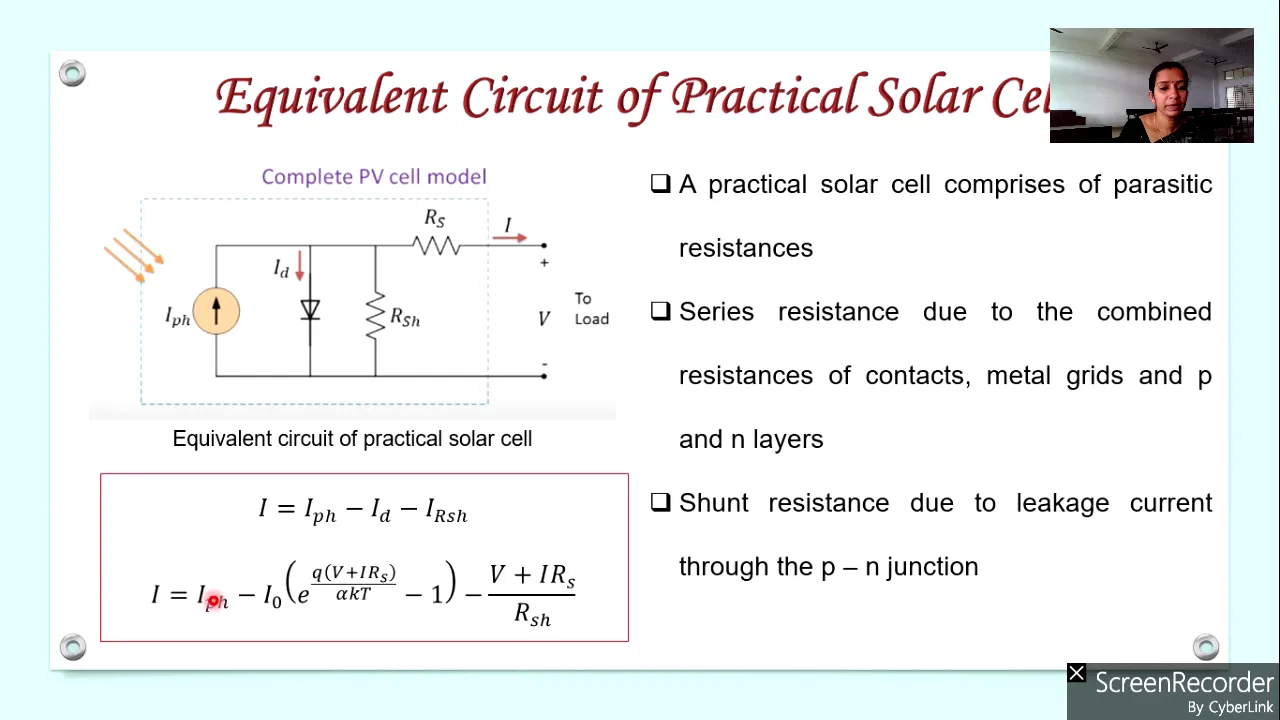


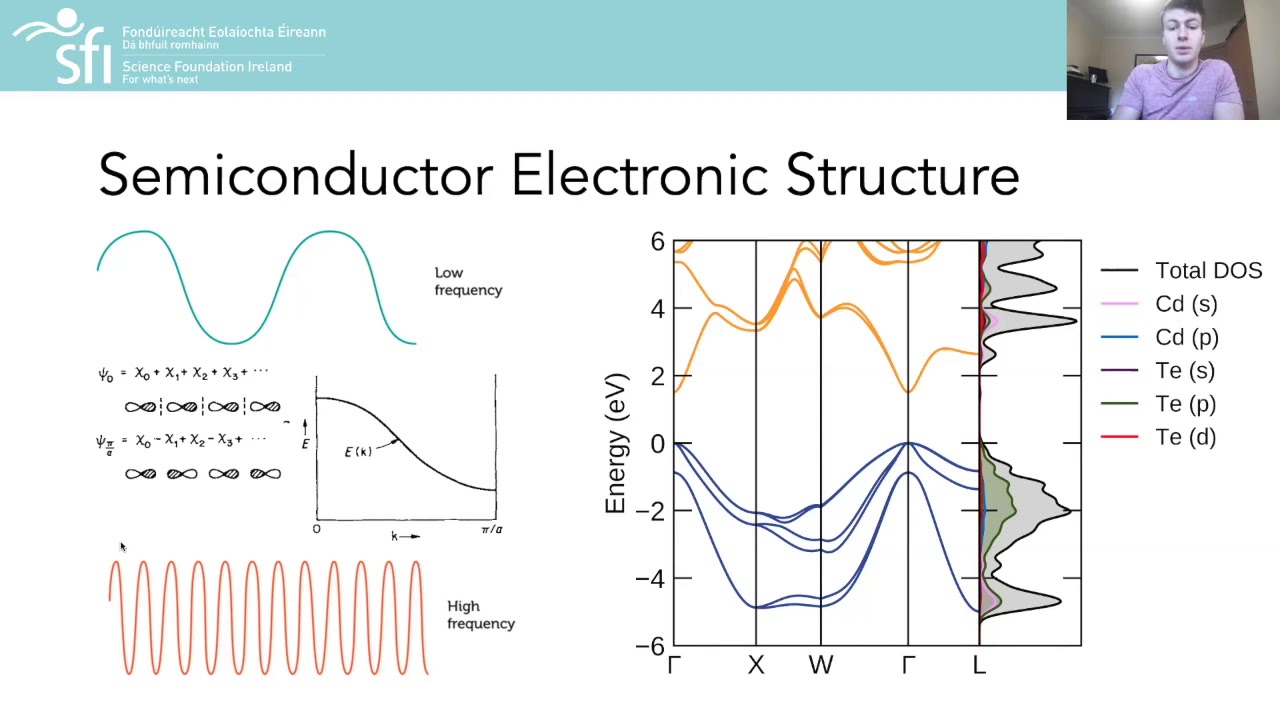


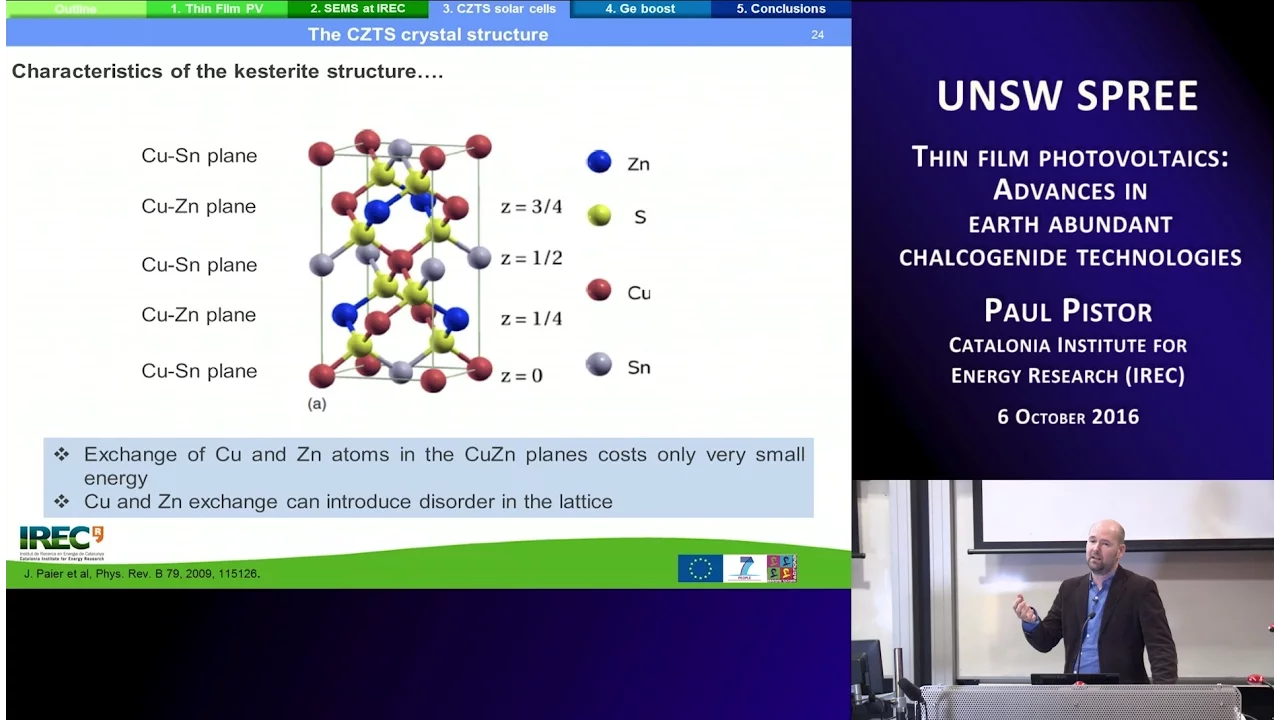

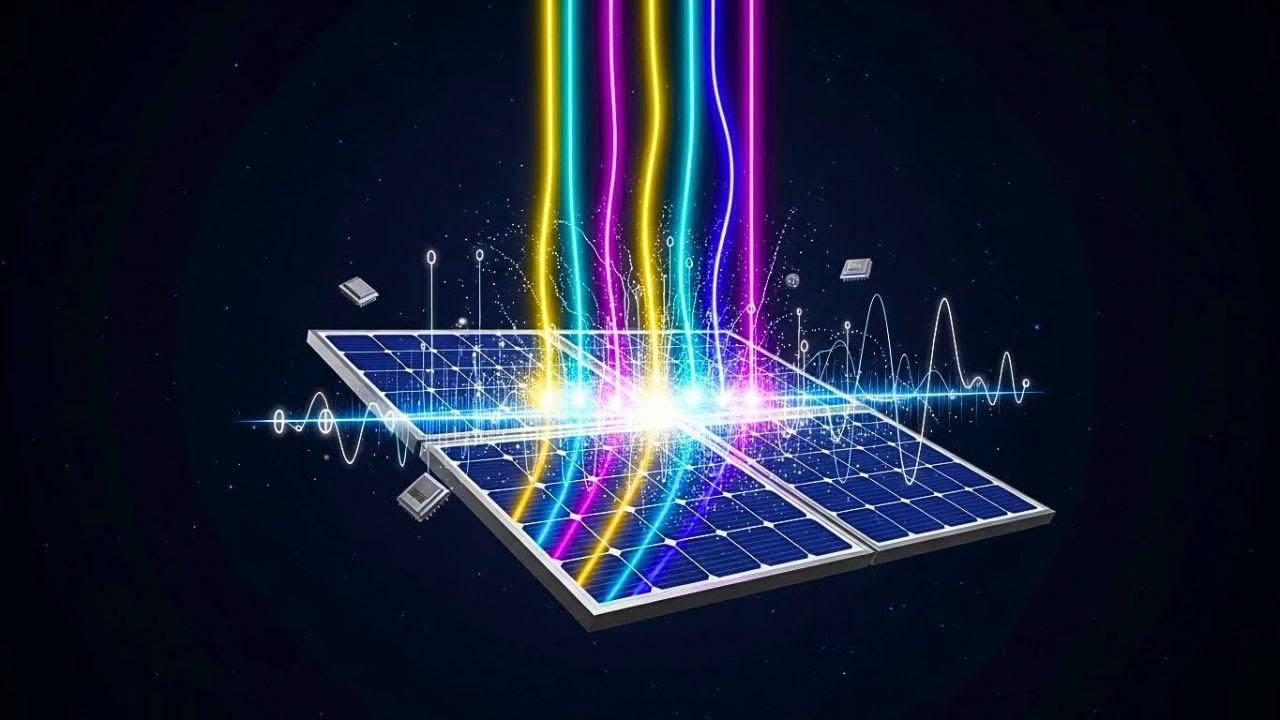
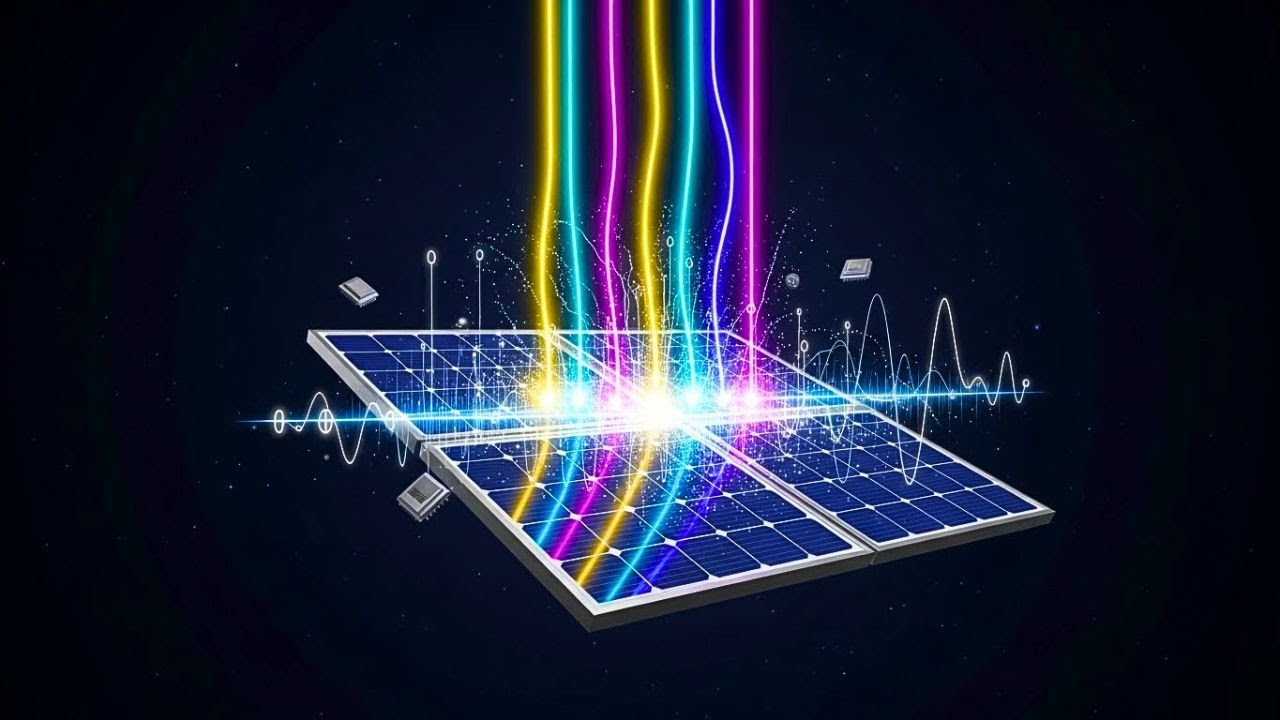



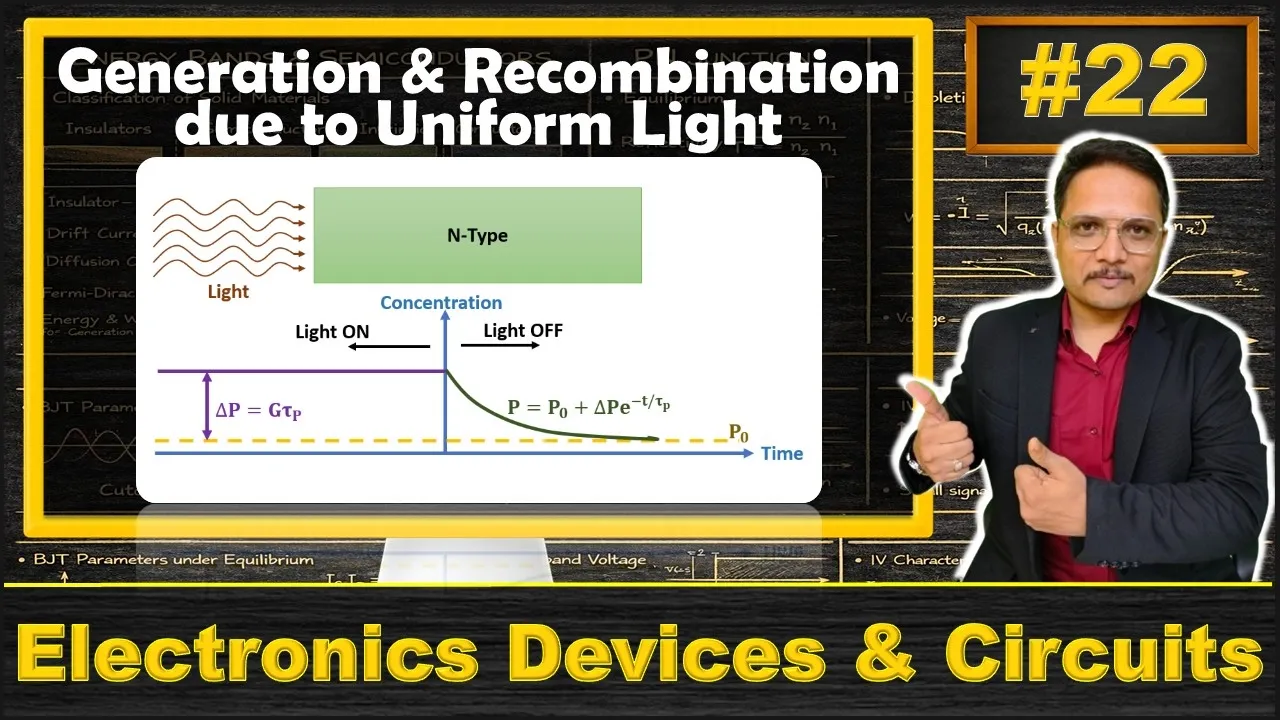
Photovoltaic (PV) technology converts sunlight into electricity through three fundamental processes: light absorption that excites bound charge carriers, charge separation via an internal electric field that creates voltage, and charge collection at device terminals. Despite initial perceptions of solar energy as impractical due to high historical costs ($10/watt in the 1970s), the technology has undergone dramatic cost reductions following a learning curve, with costs now approaching grid parity in many regions. The solar resource is abundant globally, with potential to supply far more energy than human needs, and PV technology has evolved from early electrochemical devices to modern silicon-based cells achieving 6% efficiency in 1954. Today, the industry is experiencing rapid growth driven by government subsidies and falling costs, with projections suggesting PV could supply 1-5% of global electricity by 2030.
Fundamentals of Photovoltaics: Course Intro & Solar Energy Overview
Added:the following content is provided under a Creative Commons license your support will help MIT open courseware continue to offer highquality educational resources for free to make a donation or view additional materials from hundreds of MIT courses visit MIT opencourseware at ocw.mit.edu ladies and gentlemen thanks for uh coming today I'd like to formally start the course the fundamentals of photo voltaics that's 2626 2627 why don't we dive quickly into the syllabus and then a few slides of motivation why we're here why we're studying phot Vol takes hopefully get you excited for the course um the syllabus that you have before you should uh outline the course objectives and the course learning objectives uh at the end during the background assessment survey we'll take the last 10 minutes of class for you to provide your feedback to us the teaching staff to make sure that uh we're addressing your needs and your interests uh so take a a quick moment to read over that while I I uh describe the overall flow of the course the course road map this little diagram right here is essentially a three-step uh component we first instill the fundamentals of how light is absorbed into a material how charge is excited how then charge is separated into voltage created and finally how charge is collected uh and that is the essence of a photovoltaic device in 30 years time photovoltaic devices probably will still be used using uh that combination of physical processes so understanding these fundamentals will uh arm you uh will give you the information needed to be able to assess any photov volte technology that might be presented to you then in the second component of the course uh we'll discuss the Technologies the specific technologies that are out there on the market today and those that are up and coming uh that have the potential to replace them and uh as the third part of the course we'll be discussing cross cutting themes these include the policy uh economics and social aspects of photovoltaics that of course are of general interest and are particularly interesting for scientists and Engineers who spend most of their time thinking about the fundamentals to take a step back and look at the broader picture um a note on the fundamentals I recognize that many of you come from uh diverse backgrounds some from non-technical backgrounds many from mechanical engineering who never really have looked into semiconductors uh or semiconductor devices not to worry um as you'll see on uh let's see page number ah page number two um meeting times class recitation and office hours we provide a number of opportunities for you to get more closely engaged with us the teaching staff and to work through some of the fundamentals as you uh might experience difficulties in the learning process let's take a quick look at the course schedule just to situate ourselves so the course schedule follows that three-step process very closely the first component of the course the first third roughly is focused on the fundamentals so we'll learn about light absorption charge exitation charge separation and charge collection and the uh recitation times will be used to discuss those fundamentals because uh for many of you this is the first time you're uh working with this material the second third of the course on PV Technologies when we discuss uh the the industry that's out there today how it's evolving how the different Technologies are evolving this is when we to experience some of the industry pain upfront up close and personal we'll be making solar cells and as part of your take-home quiz number two as you'll notice take home quiz number two is distributed uh right in the beginning of October uh middle of October and then it's due in the middle of November so it's almost a month and the reason it's a monthlong tape comb quiz is because during the recitation times we will be making solar cells with you and it'll be a little bit of a a challenge it's not only to make the most efficient solar cell but the most coste effective solar cell and so we'll be making technology choices as we go along processing our solar cells deciding uh whether we do process a or process B we'll be doing the calculations that we learned how to do during the fundamental section to predict what the efficiency gain should be and then we'll have costs associated with each of the different process steps as well so it be a little bit of A game A little competition within the group as well um to see who can make the most cost-effective solar cell in terms of uh dollars per unit power output and uh finally in the last third of the course um this is really when the projects uh uh kick off in Earnest uh we have several really interesting projects lined up uh as well as we're open to hearing your own project ideas this is when you form teams of three four perhaps five but uh hopefully three or four and you will be addressing some of the most uh important uh questions of the day uh obviously in a very bound uh uh well-defined way um and some of the projects that we have lined up include looking at ual uh photoal take installer data coming from houses uh with temporal resolution in the order of 5 minutes so you can obtain a huge database of maybe 10,000 15,000 homes distributed geographically and determine to what degree is The Ensemble of photov Volt take systems predictable obviously if a cloud goes over one home that power output drops pretty dramatically but if you begin averaging over several homes how predictable is the solar power output of that Ensemble and that's going to be very important as photov voltaic scales up and assumes a greater percentage of the total grid right another interesting project we have lined up is with the World Bank um this is with uh folks in Washington DC who are looking into a project called lighting Africa and they're installing PV on small little lights uh and distributing those to folks in subsaharan Africa and their big question to the MIT audience is with some of the newer upand cominging Technologies out there how will this impact their technology how will this impact their lighting uh and so the deliverable at the end will be a technology perspective uh one page a lot of thought has to go into it uh that will be delivered to uh companies that will be selling their products in Africa uh to guide them and to inform them about some of the up andc coming Technologies and how their markets will be impacted like those two projects we have several others um and we're open to your ideas as well so if you're really jazzed about one particular topic uh there'll be opportunities to let us know specifically on homework number two uh when there'll be a specific question there are you interested in a particular topic of your own we'll assemble begin creating teams early on so that there's some bonding going on especially during the cell fabrication part during the second third of the course when we make the actual solar cells um but then in the third part of the course will be really focusing on the class projects themselves so that's the lay of the land and I want to give you some motivation as to why we're here and why this is really a special time in the field of photovoltaics um this is not your parents solar energy anymore uh things have changed quite a bit and hopefully over the course of these slides I'll be able to convey that message loud and clear all right we'll go ahead and get started um so first question is why photov voltaics or why solar so photovoltaics is one particular embodiment of solar energy where we convert sunlight into electricity and in most photovoltic panels and I'll definitely let you guys come up and have a look at it afterwards in most photovoltic panels you have two leads coming out uh basically the equivalent of a positive and a negative um and you have a bunch of cells here that are converting the sunlight into into electricity um it's different than say solar thermal which is converting sunlight into heat or solar to Fuels which is converting sunlight into chemical energy um and the reason we're studying photo voltic as a starting point is because PV photo volx PV for short is uh the most uh widespread technology widespread solar conversion technology out there today so the big question is why solar in general why are we at all interested in this can anybody tell me what the is a picture of it's obviously not from the United States does anybody recognize the language here written on the side of the boat it's very small Portuguese it's Portuguese it's from Brazil it's from the northeast of Brazil it's a small island called M Pao it's located about an hour south of Salvador in Baya these are folks arriving at the island with uh gas cylinders there is no underwater cable linking the island with the mainland so they're arriving by boat with gas cylinders they're tossing them into the saltwater they're pushing them onto the beach put rolling them on the beach until they get to the the little uh Sandy roads of course getting uh grains of sand embedded inside of the the nozzle and so forth um this illustrates to me the great risks that we go through to supply our ourselves with energy uh it's just one what might be considered by our safety standards here extreme example of uh of of associate risk with supplying of energy and effort of course but uh if you look at our energy supply to the United States it's it's no less heroic um it just has different dimensions and so the energy that we use today is often produced in some far away land not always but often uh transported sometimes over thousands of miles and brought home at a significant risk in Peril and the question is why do we go to such extrems and second question is is there a better way so to answer the first question here why we go to such extremes if you look at the world at night and then look at our human development map which I use Facebook what what better indicator of human development is there than Facebook this this map right here shows you the number of linkages between people on Facebook and of course the density of the the bright lights there is representing the number of users and you can see that the two maps the electricity consumption and the uh the technology adoption uh map very closely one onto another um and it's almost down to the the the specific region in the specific count is especially noticeable in some of the developing world where you see these pockets of uh of high concentration of of people essentially Capital Cities uh you have lagus Nairobi and so forth Jakarta and you have this huge concentration of of people um that of course are using electricity and uh more and more people flock to those cities especially in developing countries because the standard of living tends to be higher there is uh a certain indicator called human development index that was put together by the World Bank uh which pulls together a number of factors including uh expectation of Life infant mortality uh and so forth education levels uh so in some hand wavy way comes up with a metric that indicates quality of life roughly and on the x-axis here we have annual per capita electricity use not energy but electricity specifically and we see some form of correlation between the two so one could naturally conclude from this that energy is fueling uh development and energy is also fueling uh per capita income as a result this uh little bubble chart here courtesy of of fucc Berkeley is showing you the uh the size of the bubble here indicating the size of the population and of course the position on this graph indicating the per per capita energy use and per capita income the reality is that many of the upand cominging energy consumers aren't quite there yet in terms of their energy use there will be a drastically increasing demand as several regions of the world turn on right as they begin plugging in and demanding more electricity so somehow we have to satisfy that growing demand so to put things in perspective as well uh here we have the world somewhat at night world population in uh Millions um and so we have somewhere around 10 billion approaching uh by 2050 and you can see that the majority of the growth what driving world population is Asia and Africa those are the two uh lines my apologies for the small text but that's the yellow line right here and the black line right here they're the two largest bars in that Paro chart and the projected human energy use is only going to go up as a result so again we look at the world at night uh indicating uh now instead of looking at the bright areas we're going to focus on the dark areas instead the regions of the world where we do have high population densities some of the regions not the deserts obviously but some of the regions we do have high population densities like subsaharan Africa but don't have a whole lot of electricity use right now then we'll take another map which is the solar resource again here the red is indicating a lot of solar resource and the blue is indicating not so much um but still it's pretty amazing that the entire world is falling within about a factor of two maybe a factor of three right so even if you compare Scandinavia against uh let's say um Scandinavia against Kenya you're still looking at about a variation of a factor of three right uh so the the solar resource is pretty well matched with the regions of the world that don't have electricity right now where the demand will be coming online and to put that into another nice chart I don't think this is very common yet uh you've seen the HDI versus per capita income um but this is HDI versus insulation showing that those regions of the world that are ranked lower on the HDI scale are precisely those regions that have higher insulation that have greater access to that solar resource now the big question is is that solar resource big enough to supply necessary energy needs and this is a a quick intro to next lecture where we discuss the solar resource in detail but the the short answer is absolutely yes by orders of magnitude uh the volumes of these cubes represent the volume of either energy uh resource or energy need energy need here on the far right uh that little blue cube represents the human energy use um some are uh very small compared to the solar resource on the Earth's surface this obviously is including the ocean as well if we're to be realistic instead of calling this planet Earth we should probably call it Ocean or water since oceans do comprise about 2/3 um but uh even if we discount this for uh usable land area we're still uh an order of magnitude greater than total human energy use so the resource base is there it's available it's up to us to figure out how to use it up to us scientists and Engineers so the potential for solar energy is represented on this chart I'm not a huge fan of this chart and I'll explain why in a minute but there is something very valuable to be taken away from here these black dots uh 1 2 3 4 56 uh represent around 18 terawatt equivalent which is total human energy use in a few years time and you can see the total land area there is not uh astronomical the reason I don't like this chart so much is because we're not going to going to cover up uh vast swaths of of Nevada for instance with solar panels for the benefit of the rest of the country uh we're going to distribute those solar panels over a larger areas right but this is just meant to prise the point that the land area uh usage does work out in our favor so the way we distribute solar panels typically is either on residential installations like this one or in large field installations this one the the Saria solar farm in Ontario is the largest currently the largest uh solar farm in the world um we call it a solar farm because it's just a massive land area comprised of solar panels This is the covering half of Nevada scenario right um this here on the left hand side on the other hand is a residential neighborhood in California indicating the more distributed uh variety and both have uh their distinct uh strengths and weaknesses so solar isn't about those small little rinky dinky 20 or 30 watt panels that are sitting on a remote thatched Hut solar is really growing up to be a grid tied grid integrated uh renewable energy source uh that is now probably skirting a hundred billion dollar industry worldwide so it's growing up and uh certainly professionalizing quite a bit historical perspective it's time to take a look back and um Trace through some of the technical history of how solar cells came into being uh and that really will inform why it is we're at where we are today why the industry has some of the biases it has today and what are some of the intangible barriers that could be uh needed to be overcome if we were to develop new technologies let's say so uh aside from just general knowledge and general edification this has an important technical aspect as well so historical perspective we credit the discovery of the photovoltaic to this gentleman here Edmund Beckel shown here in his more mature years when he wrote this this uh article right here uh I'll probably butcher it but it's um basically the effects the the electrical effects produced by the influence of solar rays uh on a contraption that looked very similar to this uh he noticed a current flowing essentially a photovoltaic a photon induced a light induced uh effect current and uh he was very smart to decouple the effect of heat from the light so his experiment involved selective filters uh that prevented uh massive amounts of heat from getting through and he essentially produced what is a spectral response varying the uh filter color he was able to trace out the response of this apparatus uh to the solar light uh as a function of wavelength as so as a clever experiment he wrote it up it's more of an electrochemical device rather than a solid state photovoltaic device like the one we know now but nevertheless um it earned him the credit of being the Discover of the photovoltic effect does anybody happen to know how old he was in 19 in 1839 when he discovered this or when he published this this work it's a rather nice article very eloquent very detailed he was 19 he was born in 1820 anyway small side um the field evolved from 1839 when that first article came out uh folks began refining and well first of all discovering new elements during that period in 1800s uh refining them and then testing their properties and this was before we really understood what semiconductors were they were a little bit of a black box a big mystery uh their their physical electrical properties were were all over the map uh we'll explain why over the course of the next uh 10 lectures and they began refining these materials and putting them in various uh Contraptions testing them with light and lo and behold they would get the photovoltaic effect again maybe uh photoelectric effect first and then the photov voltaic effect finally when they set up the experiment properly and selenium was a popular material at the beginning uh so was CIS oxide co2o that was a very uh common material and I I love pointing this out this is a little Contraption of Vice um to hold the contact onto the device and as Joe can tell you contacting a solar cell is not the easiest thing in the world uh so it's a pretty funny uh uh U picture especially in light of our current difficulties in 2011 on resolving some contact issues especially with new materials but uh that gives you a little bit of a historical perspective and the references are there in 1954 the embodiment or the first embodiment of what we consider the modern solar cell came into being uh this was driven by the purification crystallization and growth of silicon which is the second most abundant element on the Earth's crust it was noted to be superior to geranium for uh electronic devices uh because of its larger band Gap less leakage current we'll get to that in a few lectures it had super ior properties and it was engineered into uh the first uh I would say the first uh um what we call a home Junction PN Junction based solar cell device in Bell Labs uh by those three gentlemen there on the upper left and in 1954 the paper came out in journal applied physics and that really spurred a lot of interest in the field why because 6% efficiency was about a factor of 15 higher than anything that had come before it and now people could see the potential of this technology to drive things uh at the time within a few years within the decade or so folks were more interested in sending satellites into space and they were perhaps powering terrestrial objects but um get to that in a second but some of the first examples here in Bell labs and in uh in New Jersey they had a small little radio communicating with this little device over here uh and the solar cell was uh powering the uh the gadget and uh it's interesting to note here the New York Times article from that time with this modern version of Apollo's Chariot the Bell scientists have harnessed enough of the Suns raised to power the transmission voices over telephone wires and they speculate that at some point uh obviously this was written in the 1950s uh keep that context social context in mind but eventually leading to the realization of one of Mankind's most cherished dreams the harnessing of the almost Limitless energy of the Sun for the uses of civilization they saw the opportunity there it was not lost to them but of course a lot of development had to come under uh the bridge a lot of water had to go under the bridge before they were able to make uh solar really cost effective from 1954 uh to almost 60 years later the way that basic solar cell device worked I'm going to introduce you to the full picture now and we'll begin dissecting it piece by piece over the next lectures so that we really understand each component of how the solar cell works and we'll put it all back together again actually make it literally so the sunlight comes into this device this is a cross-section of a solar cell device and today's modern solar cells are about four times the thickness of your hair so if you can imagine 200 microns in thickness that's the thickness here the cross-section of the solar cell device light comes inside excites bound charge and makes it mobile so it can move around the material there's a builtin electric field which serves to separate that charge and create the voltage and so one of the charges goes here the other charge goes to the back right so you have a voltage or potential difference across these two terminals across the front terminal and across the back one and then if they're connected by an external circuit to an external load current will flow through that external load to complete the circuit and that's essentially how the solar cell device Works uh so three basic steps there's charge generation so light is exciting charge within the material the second important step up there in the upper right is charge separation somehow you have to induce a voltage inside of your material and the third very important step is somehow you have to collect the charge coming out of it that's why those folks in the earlier days had that big vice over here so they were trying to really make sure that the metal was in good contact with the material so they could extract the charge and uh so that's essentially it um the advantages of a solar cell device are that there are no moving parts and no pollution created at the site of use there is obviously uh the manufacturing of the module itself uh and we'll get into detail about that and begin quantifying the amount of energy the cost to manufacture it um bottom line is that the CO2 production per unit energy output from the solar panel is on the order of uh 10 times less than coal five times less than natural gas so significantly less than fossil fuel it is not a zero uh Energy System uh the reason why the majority uh or where the majority that CO2 comes from is actually the energy used to produce a solar panel so as we transition to uh solar panels made from other solar panels right as the solar industry ramps up obviously the carbon intensity of producing the solar panels will go down as well likewise it matters where you produce the panels and there's some active research going on at MIT to decide where in the world it's optimal to produce the solar panels and where it's optimal to uh uh to actually install them the disadvantages which are really really embody why we haven't seen a massive adoption of solar to date and why there are Technical and non-technical challenges for you for you here to resolve is because there's no power output at night in other words when the sun's not shining it's not producing electricity and uh there's lower output when weather is unfavorable and thirdly uh today there is a high cost we'll get to that in a few slides as well so it's not economically competitive in most markets and some there are in 1.5 out of the 50 states here in the US solar is cost competitive today but in those in the remainder uh it's not so this is the really fun part this is why when you pick up your phone and and and text your parents and say I'm in a PV course and they write back ah PV I've heard about that for decades that's an old hat that's not going anywhere you can write back and say actually it's it's very different today than it was then and here's the reason why um in the 1970s when PV really started to take off for civilian purposes obviously they put satellites up in the space they had uh proven that it it worked it was robust uh on some microwave relay stations up in in in remote locations that they didn't want to service they uh also uh would Place PV panels but in terms of of Civilian purposes on houses and so forth really late 1970s early 1980s were things were beginning to take off and driven by the oil crisis the opic uh oil crises of the 1970s um this is a New York Times article describing the state-of-the-art of solar this is taking a look some uh 20 years later at solar and saying how far have we come and one of the interesting uh things of note in this article right here is that it costs upward of $10 a watt for the solar panels in that day in 1979 meaning it would take roughly $112,000 to run an ordinary household toaster right so that was the impression that folks had of solar in the 1970s and for a good reason um this is the cost of electricity produced of solar versus time in reality the x-axis if you look closely it's cumulative PV electricity production that means uh for each new panel we make and for each new unit energy that that panel is producing the cost of the electricity is coming down that's because we learn how to make panels better we learn how to make cheaper panels uh faster uh with less cost so the cost of electricity produced over here is showing going down with time and this is a little bit of an apples to oranges comparison that's why they're two different colors for the two different dots the black dots represent the average retail electricity prices not costs but price this is going to be a repeating theme throughout the entire course I'm going to emphasize it now can somebody tell me what the difference between cost and prices prices going more than cost the company wants to make a profit on the product yeah so let's say I make a gizmo um this is a great example um I make a gizmo uh that costs a certain amount X let's say and now I sell it for 3x and I make 2x profit so the price would be X the cost would be X right and so the cost of solar is shown here in the in the white dots and the price of retail electricity prices in Black why is this comparison made right here why would somebody do that sort of apples and Origins comparison what point are they trying to make uh because we we need to bring down how much how much we need to put into puv to be able to compete with the price that the electricity is at as opposed to the cost exactly exactly this is a substitution play right you're looking at PV substituting what is in that case the base load and peaking uh price of electricity probably more driven by the peaking price of electricity and so what they're doing here is they're saying okay how much does it cost to manufacture this panel and how does that compare against the grid if I were to plug into the wall over there and extract electricity from the grid how much would uh that would that cost me so uh or how much would that uh would have to pay for that electricity and that's really the comparison that they're trying to drive right here is that foration uh yes so um the details are in this paper right here again uh you can access all this information online but uh it is adjusted these are I believe in 2002 prices I can't remember the exact uh yeah what are some of the assumptions us the thec uh great question um so uh the higher density of data points over here um is uh in in part well in part because the the they get closer together it becomes harder to drive the cost down and of course you're looking at it in a log scale um but uh also the quality of the data uh is much better in recent years because we had access to Greater number of companies were able to average uh values coming from multiple sources um some of the earlier data like especially 1957 um I mean that was those were some of the first solar cells produced uh if they had access to good primary material primary data uh those numbers would be highly accurate because it' be one company making it and that's it very little error bar but if they were making guesstimates based on uh material cost of the day uh then there would be some uh error bar associated with that data point uh these curves are very difficult to produce when you're in Academia but I can say that when we were in Industry um we did this for our company just just for Haas one day and it fell on a very similar slope with a similar slope and a similar value um so somehow they were getting the numbers right in terms of like I guess installation what numbers are us assume like like you said do you use values for Nevada or do you take an average of installation over the entire us using a US average for the retail electricity prices yeah and so the uh retail electricity prices in the United States vary quite a bit uh you have some coal Rich uh States uh like Wyoming that get 5 cents per kilowatt hour you have uh States like Massachusetts at the end of the energy pipeline if you look at the natural gas pipeline for example we're at the very end we get some of our natural gas even shipped in by boat uh 18 cents per kilowatt hour is residential prices um and in California which has a tiered structure if you're one of the highest consumers of electricity you're going to be paying uh somewhere around 30 cents per kilowatt hour um compared to some of the lower uh use folks down at around 12 and so it varies quite a bit um typically when you're looking at these sorts of charts uh if you if the chart is produced say by the US doe or some solar promoter let's say they will typically be choosing a Rosy scenario of the American southwest because that is well not only does do the numbers look better but more importantly that's where a lot of the solar is being installed today but not all of the solar um because it is a substitution economics uh situation two parameters are really of interest that drive the cost competitiveness of a solar installation one is the retail price of electricity how much are you paying uh out of the wall what are you substituting it with and the second is how much sunlight do you get locally so our break even point in the state of Massachusetts is not too far off from Arizona because they have a lot cheaper price of electricity even though we have a lot less Sun so um I wanted to emphasize a couple more points so when Gregory nemt put together this chart it was within the context of a really interesting um uh paper in which he attempted to decouple the effects of scale from Innovation let me emphasize that so if you are making a widget let's imagine a razor like Gillette does here in South Boston or if you're making uh some other high-tech product um razors by the way are very high-tech um how many times have you cut yourself by a defective razor I certainly haven't and I've probably used tens of thousands in my lifetime of individual blades and that's because they're examined using Laser Technology they're really manufactured in a high-tech way um and they get better and better every time they produce one razor blade and so they follow a learning curve just like Photo Vol does with cumulative production the cost of producing One widget goes down and likewise microwave ovens and and other high-tech products um and so the the the big question is how much of this learning curve uh uh cost redu uction is driven by Innovation and how much is driven by scaling just learning how to do incremental improvements that tweaking the manufacturing line to make it a little bit more efficient so Gregory nemit uh the author of this paper right here in which this figure appears looked into that question and uh and came up with some answers uh some of those uh learnings were Incorporated onto this beautiful chart here produced by 1366 a spin-off of MIT uh focused on commercializing a really cool uh nextg product um they uh took that learning curve from Gregory nt's paper plotted it on a slightly different scale and showed several of the technology innovations that drove down that learning curve for Crystal and silicon and so those uh in the fine text there represent specific Technologies and we'll be getting to know some of them over the course of uh o over the course of the um the PB course and so we're approaching this very interesting point if you haven't noticed from this chart right here this ended in 2003 and boy these two we getting very close to one another we're entering a very interesting point where the cost of producing PV electricity is rapidly intersecting with the US retail electricity prices and that is represented in a very broad brush Strokes by this doe chart that was produced in 200 approximately 2006 with the uh Solar America initiative where you have the system price range for Pb systems again broad range now instead of finite data points resid residential and commercial rates and utility gen generation and for those who have already dealt with uh electricity markets the residential commercial rates this is the price or the retail price and the utility generation this is more the uh wholesale uh price over here for utility scale so again just showing you the range of uh of of of of substitutions that could be going on and we're entering the regime now where finally solar is starting to be cost competitive and when you start having this sort of interaction you can imagine two gussian curves one curve representing the price of of solar and the other the price of electricity and as they begin overlapping as the price of our electricity goes up it went up 15% uh over the 2000s here in Massachusetts the retail price of electricity in residential and as the price of Solar comes down those two gussian curves begin moving against each other and at the edge of a gum you can model that using an exponential right so you have two exponential curves overlapping you have effective an exponentially growing Market penetration in other words the solar adoption on the grid is following a hockey stick curve and that's why you hear a lot of interest in solar these days um we had a solar system installed in our house in 2007 and now our neighbors put them up last year the folks across are putting them up actually just last week and there's another family down the road so our little neighborhood is representing this little hockey stick right here as is Cambridge as a whole and some of the places United States where it does make economic sense you're beginning to see that takeoff and that's why it's such an exciting time right now this is a much busier chart there there's a lot going on um but to sensitize you this is the PV residential in other words the uh it's either the cost of the price to install PV on a residential home in other words a smaller system so there's a larger overhead per system the architect needs to spend more time per unit energy produced right to design your system because it's smaller one um a lot of people go out there per panel to install it um whereas PV utility those large Fields filled with PV panels it's cheaper per unit panel right to install U one architect can sit down and design the whole thing um maybe a team of Architects but it's uh it's the overhead costs are lower and you can bargain with the module manufacturers to get a better rate on your modules right so B get price and as a result the PV utility uh uh costs and prices tend to be lower than PB residential um and the blue and uh and and the uh red here just represent the wholesale and Retail uh electricity costs what they're substituting here in the United States so a bit more detailed chart again showing the grid penetration down here at the bottom also in terms of percent so back here a few years ago 2% of total worldwide uh electricity was generated by photovoltaics and projections are that by 2020 we'll be at around 1% by 2030 around 5% using these just two overlapping uh gaussin curves and it's interesting to note that this is global on a local level Germany is already well surpassed 2% in Bavaria I think it might be up 3% or 4% now in photoex in the southeastern region of Germany um there's a small island in the Hawaiian chain that has I believe in peak days around 40% of its electricity produced from solar so there are regions that already you have a very large percentage of the total electricity being produced by solar because of that distribution of prices okay and lastly this is a really exciting chart this is the convergence between PV and conventional energy essentially what this chart over here was attempting to capture in its percentages this is explicitly laid out now and uh this I I I took data going back to the 1970s and and uh plotted the terawatts a average terawatts installed of new PV installations versus Total Primary Energy new primary energy installations so for those uh energy wonks here in the audience what is the uh primary energy burn rate in the world right now in terms of terawatts average around 15 right and so the average new energy installed each year is represented here it's somewhere between 100 gwatt and a terawatt typically and this is the new PV in installs right and you can see that we're within about two orders of magnitude now of total new uh energy installs this is primary energy um for electricity it looks even Rosier and so we're rapidly approaching the point where substitution will begin right we're going to start replacing uh not only uh we're going to take a larger share of total new installed energy but we may even start putting some existing power plants out of business and we'll get into that in the economic section in the third part of our course interesting to note these three distinct phases of growth of the industry over time phase one was right at the beginning when we had the OPEC oil crisis when people were really interested in solar but it was really a boutique thing um and you know solar cute uh great PR but not really impactful um in this regime right here where most of you were born um solar went kind of through a down cycle so while the uh price of oil was really high right back here it crashed in the early 1980s and symbolically Ronald Reagan uh ended up taking down the solar panels uh from the White House sometime in ' 86 887 um and big oil companies were the ones who kept the solar industry going interestingly enough it was mobile Tao it was BP Solar large the largest companies that were producing solar panels in the world were ones uh that were small divisions of larger oil companies which viewed themselves as energy companies and then finally this phase three this really rapid growth here again accumulative annual growth rate somewhere between 40 and 50% average that took off when generous government subsidies whether it be for the manufacturing or the installation in the case of the United States it's mostly been on the installation side in the case of china it's mostly been on the manufacturing side Japan and Germany had a bit of both um but but heavily more heavily toward the installation and we saw a massive growth of the PV industry because now the government's realized well wait the cost is coming down and we will need new electricity coming on board and our oil supply is a little unreliable so let's invest in this new technology and see where it takes us and uh I think the Germans now are paying somewhere on the order of a Euro maybe a little over a euro per month on their electricity bills uh as a result of having financed a lot of this growth right here at the PB industry which allowed uh the costs to come down for the entire world um so it was a a successful program and as a result uh many Pure Play companies saw the financial opportunities the case of Q cells which is highlighted down here is Not Unusual in those days in in the late 1990s a group of Executives at McKenzie got together and said wow the numbers look really promising in the Solar business why don't we form our own company and only do solar instead of being part of a much larger one where they have their interests dispersed among many different product lines and Technologies let's focus exclusively on solar burn our bridges behind us and just go for it and they went for it and for a while for a few months Q cells was the largest solar cell producer in the world um and uh it it was it's uh it's a a poster child of this new generation of PB companies coming in this third phase here um and as we'll learn over the course of today's uh or over the course of this semester's uh course many of the solar the leading solar producers today are now located in China so this is uh basically the history of PV development and the important thing to not is this closing Gap right here so when folks are saying solar you know it's the same old same old it's been gimmicky it's been around for a long time but it's not going anywhere you can point to some of the this data and say no actually it's on the cusp it really is beginning to take off and um these are some of the data you can point to if you if you care to do so let me spend a few minutes talking about um the broader picture Beyond just solar photovoltaics into some of the other Solar Technologies we won't be addressing too many of these over the course of the lecture because we have to focus and we have to become very good at something otherwise we spread ourselves too thin but I did want to give you a sense of what's out there so that you can situate solar photovoltaics within the broader context and so this is a solar energy technology framework that encompasses all conversion Technologies from sunlight into energy and so first off I start with the rationale for framework why why invest the time to come up with the framework I'll explain why um there are several hundreds of Technologies out there that can convert sunlight into energy and to make sense of the technology space and to provide some meaningful technology assessments there have to be some performanc driven technology neutral performance metrics that you can use to evaluate one technology against another and that's why coming up with some sort of framework is very helpful so the three criteria that I chose um together with Vladimir bovich when we put this together um to design a technology framework was an exhaustive categorization in other words our framework had to Encompass more than 90% of all Technologies out there the 30 years challenge again in 30 years the PV technology should be able to fit into this framework still and it should be a useful analysis tool it should be able to give insight into the complex space that's out there and allow folks like yourselves to make sense of it whether you're trying to develop cost models or if you're trying to develop technology perspectives this should allow you to gain a foothold in it so we have solar energy conversion technology and we chose an output oriented rational for dividing the solar energy conversion space uh so the output would be either electricity heat or heat which is then used to power say a turbine which generates electricity or fuels and those are the four primary outputs of solar energy today yes there are Technologies out there for example that convert sunlight in store in some way and convert light in the other end um uh but uh we're not including those in here because again the 90% rule we're uh focusing on the major ones and then we do a further subdivision between the non-tracking and tracking tracking means if the Sun is moving through the sky over the course of the day your apparatus is following the Sun so as to maximize the cross-section between the incoming rays and your device right um the reason we chose tracking non tracking is because tracking requires motors which will add cost and reliability questions to your system considerations and that's why we chose this further division right here so so onto the assessment let's look at the technologies that are out there and try to bend them um solar to electricity there are a few embodiments there's the photovoltaic device these ones there's a thermoelectric device as well um which converts solar energy into heat really and then heat into electricity so maybe it should have been in the other category but it's a it is a device that converts solar energy into electricity so we've seen a solar cell device we've learned the three steps charge generation charge separation charge collection and we look at the existing technologies that are out there today and say all right let's start to bend them we have non-tracking systems that can be non-concentrating like these panels right here ENT they are just flat panels that are uh receiving the sun's Rays or you can have cheap mirrorlike materials that bounce the sunlight off of them into the solar panels and concentrate sunlight so let's imagine we put a set of mirrors on either side of this panel right here and when the sunlight bounced into the mirror it reflect back into the panel that would be a concentrating but non-tracking system and these are uh common on barriers uh along the highway in Germany um they're sound barriers they're preventing the people who live on the other side of that barrier from hearing the noise of the cars going by in the autoban um they're not meant to be crash barriers those are separate closer to the actual Road um but these are examples of concentrating and non-tracking uh photovoltaics there are ground mounted and roof mounted systems so again another way to split the the the pie and um there are uh in the concentrating non-tracking system there aren't only these types there are a variety of other species of concentrating non tracking devices as well there are so-called uh sliver cells which the light comes in bounces around a little bit and then eventually gets absorbed by the device and that even happens to some degree in these modules too because the light comes in make sure I don't reflect this into your face there we go point it up the light can come in sometimes and reflect off of this white back skin and if the light is coming in at an oblique enough angle total internal reflection by the glass it'll get a second bounce and go into the device we'll talk about how that works in a couple of lectures so um internal Reflections and uh this is uh particularly um uh timely does anybody know does does the word cylindra ring a bell for anybody yeah what what what about cylindra it went bust it went bust so it's one of the three photable t companies startup companies in the United States that went bust over the past few months over this past summer and that's a really interesting Market Dynamic which we'll get to in the third part of this course and we'll discuss that head on because it's an interesting and very important uh dynamic in the evolution of the solar industry we have some technologies under development at MIT um Mark Baldo's lab and Vladimir bovich and others are working on devices that absorb sunlight re uh Reit the light at a different wavelength tra inside of uh some high index medium like glass and then ultimately concentrate it onto the cells that are on the corners right so you can imagine a window that absorbs some of the incoming light bounces the light off and eventually concentrates the light on in the corners where you have your solar shell devices the advantage or the potential Advantage here is that you can have a very high uh efficiency expensive device but a very small area of it instead of covering this entire area right here you've now reduced the total area and then if this is a very small percentage of the total system cost you can just switch it right out when a new and better technology comes along almost like you switch out your computer right so if a better solar cell device comes along you can take this one out and put the next one in uh it's almost like an upgradeable uh system because the majority of the embedded cost is in the concentrator and not the solar cell device itself again just really drinking out of the fire hose this morning we're we're drilling you with data but it's it's meant to begin to sensitize you to some of the terms and some of the ways of thinking here in the field tracking okay so when we're talking about tracking there's a rise in the number of tracking systems in the United States um it is shown with high efficiency modules that it can be more cost competitive if you have a large field installation to do one AIS tracking one AIS tracking and two AIS tracking why would you want one or two AIS track what are you tracking one AIS tracking what what what what would make sense to track with a one AIS if you had one AIS to choose would you rotate East West would you rotate north south would you rotate Northwest to Southeast where would you go east to west why is that because you're tracking the sun over the course of the day and you're tracking pretty much every day of the year so 365 tracks per per per year the two AIS tracking what is this other axis presumably it's orthogonal to the east west in other words north south why would you want to track north south Seasons right yeah so from fall from Winter to uh to Summer um you're tracking um so um you would always want your solar panels facing south I guess right in theere in the northern hemisphere exactly so if you're in Australia or in Brazil your solar panels are facing north so let's uh ACC customize ourselves with that um and the two AIS tracking of course would allow for that adjustment the reason one AIS tracking is taking off as say the the most common uh field installation uh uh uh uh tracking system is because the seasonal adjustment if it really needs to be done it's not a huge energy benefit but if it really needs to be done you can probably just crank it by hand instead of using a a machine or a motor that can uh can break down and the adjustments don't need to be made very often um non-concentrating and concentrating uh uh PV uh tracking so these are one AIS trackers right here uh tracking over the course of a day but not concentrating in other words they're flat panels like this but just mounted on a one axis tracker that follows the sun over the course of the day the system over here is a two axis tracker uh that includes little lenses that are focusing the sunlight on tiny little cells and again very similar idea that the solar cell itself is high efficiency but it's low it is a low percentage of the total system cost uh non-concentrating and tracking um again several examples of that uh you have fancy systems two AIS trackers again most common um can anybody guess what this little Gizmo is right here we're going to get to that next lecture but solar of the exactly somehow you have to have a measuring device if you have a Tracker it has to tell you where the sun is and so this little Gizmo right here is making sure that the panels are facing the right way awesome all right so concentrating and tracking here's a closer look at some of the frel lenses that are used to concentrate the light down on some cheap uh um microscope uh or sorry the cheap magnifying glasses to also use for n lenses um and so this is an example of uh a lowcost uh apparatus here to concentrate the sunlight onto your high efficiency cell solar to heat electricity we're not going to talk too much about this during the course but just to uh sensitize you that there are Technologies out there some pretty exciting ones there are heat engines in other words sunlight Heats a fluid which moves a turbine or a piston either directly or VI heat exchanger uh heat exchangers thermoelectrics long wavelength photo voltaics the these are devices that convert the heat portion of the solar Spectrum into usable energy and there are hybrids that are possible with these so if you heat up a fluid say a salt or a glycol solution then you can store the energy in terms of heat right and if the the energy uh the stored energy begins to Decay with time because of poor insulation you can augment that heat with natural gas or with some other fossil fuel and so you get these hybrid uh renewable solar and natural gas power plants that are possible with uh the solar to heat electricity and there are some really fancy designs out there um I I'm happy to dive into these in more detail uh the most common one are um uh sunlight coming into some sort of reflector and in concentrating the sunlight into a thin tube that contains your uh your your high heat capacity material liquid usually uh so a glycol based liquid or or even a salt sometimes um it has to have a high heat capacity in other words it has to be able to absorb a lot of heat and retain it um but it also uh has to have ideally a minimum amount of corrosion uh so that the longevity of the parts uh is is is sustained and you can see here these tubes that are running along here and going down these fields of collectors all the way to the other side and somewhere off in the distance is the heat exchanger so that's solar thermal for you um we have parabolic dishes uh concentrating light into Sterling engines that's kind of neat and so your your th high is basically that of generated by the Sun and your TLO is the ambient so typical mechanical engineering there and uh you also have solar power Towers there's some work going on at MIT and this as well with Alex slokum and others uh that are using fields of mirrors to concentrate the sunlight into a tiny little spot right here in a big tower uh say for example that spot right there it's it's dark it's not an operation but if it were the sun would be concentrated on that little spot it be really really bright uh indicative of its very high temperature on the order of a couple thousand uh Calin and then uh the sunlight would either be absorbed up here with some molten salt or reflected down underground into a heat Reservoir and that would be your T High running your engine right so your Caro engine um and then the t low would be the ambient temperature solar to heat uh this is really important in developing countries not to be overlooked the very simple lowtech conversion of sunlight into heat um you can heat water this is very very common on rooftops all throughout the Sun Belt of the planet you'll see these on the roof painted in Black they contain uh portable water uh typically used for either uh uh say for example showers or or kitchen use and um the fancier versions um that are really marvels of engineering these materials all have to the coefficient of thermal expansion matched right as it heats up the glass tubing has to match the expansion of the metal around it so it is quite a feet of engineering that they make these uh so well and there are a few companies in Germany that really pioneered this effort right here um of course you have uh tracking versions like solar ovens um not too common uh you typically find more still in developing country unfortunately you find a lot of wood burning uh which isn't good for uh the the cook which uh unfortunately most often is is uh female and so this illustrates some of the societal questions that solar involves right it's not just a technology this involves gender equality this involves societal development this is a a much broader topic than just the fundamentals of the physics of how the solar cell device works or how sunlight is converted into energy and that's why we have the three segments of the course lastly solar diff fuels um the way I've traditionally broken it down it's a little bit wishy-washy uh is into enthalpy and entropy in the sense that in enthalpy you're storing the sunlight in Bonds in chemical bonds right the bonds are forming or or uh more complex uh higher energy molecules are being created so you're taking water and uh splitting into the gases or you're taking CO2 and water and converting it into hydrocarbons um and those can be used to uh uh to to to store the fuel and ultimately release it in the form of of burning the fuel so it's a closed loop cycle and what I refer to as entropy which uh I I get some some flak from the folks in chemistry for um is the separation of phases in other words desalination if you separate your salts from your water um then you're you're you're increasing the energy of your system you're doing a physical separation and it is a form of energy storage so uh this right here is the example of the Renewable Fuel cycle where you have sunlight coming in to your in compounds using some Catalyst typically you're creating the intermediate compound which is a solar fuel then you burn your solar Fuel and you have your final compounds in the ideal World 5 equals 1 the final compounds are identical to the beginning compounds and you have a closed loop cycle a renewable cycle and so a lot of work is going on here at MIT this is a recent paper we published together with Dan noera uh his group is looking into special types of catalysts our group makes solar cells so we work together to make these Nifty little devices that convert sunlight into to storable Fuels what you see here are little bubbles coming up from the water uh in which the solar cell device is embedded uh the water is in your pH neutral and it's converting that sunlight into gas into hydrogen and oxygen which can then be stored on one side of the device you could be creating oxygen on the other side hydrogen for instance if you have a physical separator You' be able to store that electricity uh this is an example very simple example of desalination driven by solar there are much fancier examples as well um but that gives you an idea you have contaminated or salty water bless you and you're evaporating the water it dribbles down into this little collector over here and finally out into your collecting pot leaving the salty uh brine behind um and then in the broader perspective um we have many other issues beside just the conversion technology itself we have uh how do we use the electricity and how do we store it right is the solar power generation centralized and all the users distributed similar to how we produce power today do we have one big solar field that's producing electricity for all of Cambridge or do we have the individual solar panels in each of our houses right that are producing the power locally and they're all interconnected in case the cloud goes over one region of Cambridge there's still coverage that's a really big question and the economics are what's driving this right now these large field installations give you a sense this is a road right here these little green specs are trees these are huge field installations of solar right the economics are driving it right now but there are opportunities as well in commercial buildings this is the muscone center in downtown San Francisco it's like the hind Convention Center equivalent there this is an example of a house in Rochester New York that housing uh development in in Rancho Cordova in California so you have examples of residential installations as well are we just going to let economics drive this is there going to be some policy involved is there a smarter way to do it um not only from a cost perspective but from a societal perspective or an energy uh grid robustness point of view what are the right choices here it's a lot of open questions right now in the field and what about energy storage um are we going to store it in terms of batteries and fuel uh centralized storage are we just going to dump it into the grid and Be Free Riders let the grid handle it somehow hope that the grid is stable enough that when a lot of solar is being produced and when no solar is being produced it'll just be able to accommodate um I guess the resistance in in the turbin of the fuel plants will either increase or decrease depending on how much energy we're pumping into the grid and so at the end of the day we have this very complex space of conversion Technologies the solar to electricity solar to heat and so forth and the system itself whether we have centralized generation of electricity distributed generation and whether the storage is centralized or distributed whether we have storage inside of our house on the inverter let's say or in the basement or whether the storage is some centralized storage facility in the center of Cambridge that uh serves as a buffer and we have all of this space to play in we're going to be focusing on solar to electricity so we'll be focusing on these two columns right here and specifically the Technologies during the first two-thirds and then the broader uh system level impacts in the last third of the course so that puts it all in perspective I'm not going to get too much into this I'm just going to say one quick word about CO2 energy and climate change you hear a lot of talk about at least from the political sector that uh scientists are shall we say uh in a lot of debate whether climate change exists or not uh that is patently false uh the majority of scientists upward of 96% uh have uh believe that there is strong evidence to support uh the fact that human energy consumption especially the high CO2 intensity of energy consumption is driving some form of climate change what the magnitude is and what the impact is obviously that is is still under discussion but the reality that our emission of energy our emission of CO2 as a result of energy use our fossil fuel energy use is driving some form of climate change that there is widespread consensus among the established scientists in the field now if you want to do some back ofth envelope calculations just to convince yourself that we tiny puny little human beings are having an impact on our world do this for me take the total energy consumption rate this is the energy burn rate so it's the power average power uh average rate of electricity use um look at just the uh the the the fossil fuel-based uh uh energy sources or if you prefer take the average CO2 intensity of our Energy Mix which somewhere uh somewhere around 600 or maybe 800 gram of CO2 per kilowatt hour and then uh look at that amount of CO2 emitted you can calculate how much CO2 is emitted per unit time from our Energy Mix knowing the carbon intensity of our Energy Mix then do a quick back of the envelope calculation assume that our atmosphere is 30 km thick it's a generous assumption it it it the density of the atmosphere dwindles pretty quickly above 10 kilm but assume it's 30 kilom thick and then dissolve all of that carbon that we're creating from this energy mix into that thin shell surrounding our Earth our Earth is in the order of 6,370 kilm in radius and it's only 30 kilm thick the atmosphere that's why those beautiful photos from the space missions when you see the that thin blue shell on the planet right that's the atmosphere it's really really thin just do a quick density carbon density analysis and you'll see that we're adding uh High tens of parts per million of CO2 to the atmosphere right and then you look at the total CO2 in the atmosphere which is in the order of 400 parts per million and you'll see that we're adding an appreciable amount just given the carbon intensity of our Energy Mix and the total toal volume of atmosphere into which we're dumping that carbon and so the question of whether or not we are adding carbon to the atmosphere I think is indisputable based on some quick back of the envelope calculations and of course the more in-depth models the only place where you can have some wiggle room to argue is whether or not CO2 actually influences the climate and for that uh there are a number of studies discussing that point I would pre I would refer you specifically to uh these here um in published in science in 2005 that discuss historical correlations over the last 600,000 years correlating CO2 and mean global temperatures uh based on um oxygen isotope ratios uh containing gas bubbles for example in ice course so I would say if you're if you're arguing whether or not we're having an influence on our atmosphere I would say that is a difficult position to take the only room that I would give you some room to maneuver would be if you said well you know CO2 really isn't that bad in the atmosphere despite what our infrared absorption data seems to indicate that it really does absorb infrared light and Reit it um so that's uh what I have to say about the uh climate which is a huge motivator for a lot of people taking the course uh and you're welcome to talk about that in more detail but I'd really love to keep this focus on the technology by and large and uh for that I'd like to hand out these background assessment quizzes for each of you uh please take a few moments to fill these out uh just pass them back so we can learn more about your interests and uh what I'll also do is pass around this little solar module right here so you can get a sense of uh what a small little solar cell looks like up close and personal once you're done feel free to come up and take a look at the solar module right here as well and thanks
Up Next
What is a Diffraction Grating? Physics Tutorial
@khanacademymedicine
993.8K views•2014-07-07

21cm Hyperfine Transition in Neutral Hydrogen: Radio Astronomy Basics
@AaronRobertParsons
12.4K views•2011-10-13
Lagrange's Method with Examples | MIT 2.003 Engineering Dynamics
@mitocw
747.1K views•2013-09-03

Entropy and the Second Law of Thermodynamics Explained
@veritasium
27.5M views•2023-07-01
Related Study Plans & Knowledge Roadmaps
Structured learning paths in Physics