















![SACANI RESPONDE [TERREMOTOS] Ciência Sem Fim #262](https://i.ytimg.com/vi/_4N0tUtWmhs/maxresdefault.jpg)








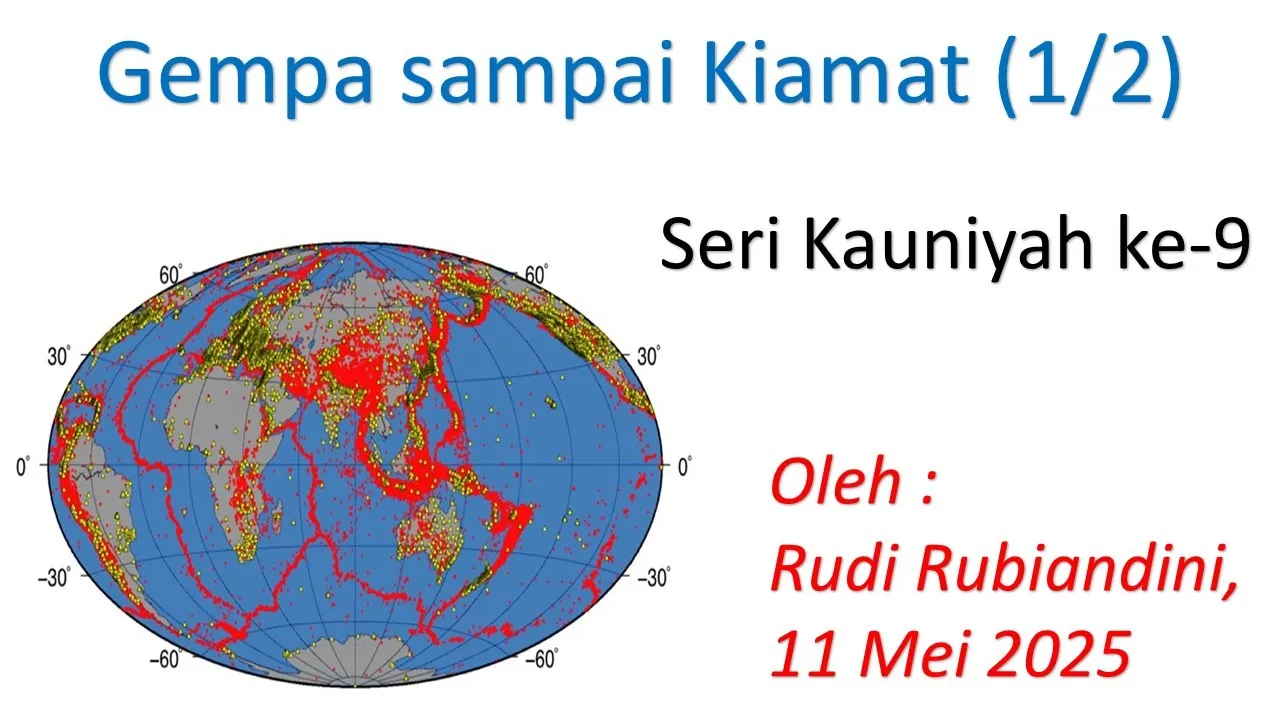
Earthquake waves are classified into body waves (P-waves and S-waves) and surface waves (Rayleigh and Love waves); P-waves are compressional waves traveling at approximately 6 km/s through all media and arrive first on seismograms, while S-waves are shear waves traveling at approximately 3 km/s only through solid media and arrive second; Rayleigh waves cause rolling vertical and horizontal motion with velocity about 0.9 times shear wave velocity and arrive last, carrying about two-thirds of earthquake energy; Love waves cause horizontal shearing motion and arrive after S-waves; the three circle method locates earthquake epicenters by measuring the time difference between P-wave and S-wave arrivals at three different seismic stations, calculating the distance from each station to the epicenter using the S-P time formula D = (v_p × v_s) / (v_p - v_s) × (T_s - T_p), and finding the intersection point of three circles drawn with each station as the center and calculated distance as the radius.
Earthquake Waves: P-waves, S-waves & Earthquake Location
Added:Let us start our lecture today on soil dynamics. We are continuing with our module three on wave propagation. So, a quick recap, what we have studied in the previous lecture. We have seen how to formulate the equation of motion for three-dimensional wave propagation.
And these are the basic three-dimensional equation of motion for a 3 D elastic solid in x direction, y direction and z direction.
Then, we have just brush up our memories on common expressions for various modulus in terms of two Lame’s constant that is lambda and mu. So, how young’s modulus, bulk modulus, shear modulus and Poisson’s ratio, these are expressed in terms of these two Lame’s constant, we have seen that.
Then to obtain the solution for the 3D equation of motion, what we had obtained in the first slide today I have shown. So, the same thing for the first type of wave, we have obtained what is the wave equation and in that we have expressed the primary wave velocity v p in terms of two Lame’s constant and density of the media like this; and in terms of shear modulus and Poisson’s ratio and density of the material, the v p is expressed by this expression.
Then for the second type of wave equation, we have seen this is the form of the equation, and the secondary wave ors wave is expressed in terms of Lame’s constant like this, which if we express in terms of shear modulus, it comes out to be root over g by rho; and comparing the expression for velocities of primary and secondary wave, we obtain the ratio of primary velocity to secondary wave velocity is just a function of Poisson’s ratio of the material and expressed by this expression.
Then, we have seen waves in semi-infinite body that is very close to the ground surface and with depth, it is decreasing drastically, we call that as Rayleigh wave; it moves in x direction and with increase in depth z, it decreases drastically as I said, but there is no variation in the other direction of y.
And the relationship of that Rayleigh wave, how to compute the Rayleigh wave with respect to the shear wave, we have seen, this is the equation we have to solve; and the relationship between the P wave, S wave and Rayleigh wave with respect to S wave for different values of Poisson’s ratio, how it varies, it was shown.
Then, another type of surface wave, we have considered the love wave; the condition to generate the love wave was the surficial layer must be very much softer than the layer below it. So, that is why G 1 by rho 1 should be much lower than G 2 by rho 2, that is the condition to generate love wave.
And the love wave also, we have also expressed in terms of shear wave velocity; and this is the expression by solving which we can obtain the expression for love wave velocity from the shear wave velocity of the two corresponding medium, and how it varies with respect to frequency, that also we have seen.
After that, we had studied waves travelling in layered media that is when waves are moving from one media to the another media at the interface, when it is hitting the incident wave, component of it is getting transmitted in the next media that we called transmitted wave, and another portion is getting reflected back to the same media, we called it as reflected wave.
And to maintain the compatibility, we have seen that displacement compatibility as well as stress compatibility has to be maintained at the boundary. Boundary means at this junction between the two media where we considered a x as 0 as per our chosen coordinate system. So, that is why x 0 u incident wave and reflected wave summation of that should be equal to the transmitted wave. And similarly for the stress amplitude, we have seen that incident wave stress wave stress amplitude plus reflected wave stress amplitude must be equal to the transmitted wave stress amplitude; then we have defined one parameter known as impedance ratio, which is nothing but the ratio of the multiplication of density and shear wave velocity of one media to other media. One media means when waves are travelling from medium one to medium two then impedance ratio is expressed in this way.
Then effect of impedance ratio on various displacement and stress amplitude, we have seen how the displacement amplitude is getting amplified when impedance ratio is less than one, and which is of our concern, because in soil generally, waves when it is traveling from very lower strata which is typically very hard in nature to a softer media on the top surface, then there is a chance of getting the incidence displacement amplitude magnified by several times,when it is coming to the higher media or top media in form of transmitted wave displacement amplitude. So, that we had seen and it is of our concern as a designer.
Now, coming to the nature of the waves we considered in our geotechnical engineering problems or soil dynamics problems.
Suppose we have an elastic half space. So, semi infinite body, we are considering, ground surface, this is the ground surface, we are taking it and say, we have several layers below it which is quite typical and quit obvious, and the shear wave velocity say, in this layer v s 1, in this layer v s 2, in this layer v s 3, in this layer v s 4, in this layer v s 5 and so on. In such a way, the typically v s 1 is much less than v s 2 is much less than v s 3, then this is much less than v s 4, this is less than v s 5. What does it mean? This is stiffer layer compared to this one, then this stiffer layer compared to this one, this is stiffer layer compared to this one and this is stiffer layer compared to this one. So, as we are approaching towards the ground surface, the soil condition is becoming softer and softer. So, typically we considering like this.
Now, what we have seen in the previous lecture that in case of 3 D inclined wave, when waves are travelling they must follow the conventional snell’s law, that is sin i, i is the angle of incidence with respect to the vertical, v is the velocity of the wave in that particular media that has to be maintain constant.
And when there is an inclined wave is hitting any interface between two material, material one and two like this, incident P wave can generate reflected P and reflected SV wave, and transmitted SV and transmitted P wave in the another material. When incident wave is SV type, then some portion get reflected as P wave and SV wave in the same material, and some gets refracted or transmitted in the other material as SV or P wave, and when it is incident SH wave, in that case we have seen that the reflected wave in the same material as SH wave, and the refracted or transmitted wave as SH wave in the other media. If you look at it, this is our angle of incidence, this angle with respect to vertical with which the incident wave is hitting the junction. So, this is our angle of incidence, and this is the velocity, when it is getting transmitted or refracted in the next media, if this is a softer media, this is our angle of i to maintain that ratio constant sin i by v remains constant as per the snell’s law. So, what happens? Let us look at here suppose any wave travelling here, weather it is SV or S wave, we are considering any V S wave, it is hitting from this layer in this direction some inclined wave. So, when it travels to the next media that is when some of it is getting transmitted, being this layer as the softer layer than this fifth layer, what will happen? It will slightly come like this. So, the angle of inclination with respect to vertical will decrease. Further when it hits the next media, as the layer three is softer than layer four, further it will come like this. Again when it hits the boundary of layer two and three, as the layer two is softer than layer three, again it will come like this, and when it hits the last boundary that is layer one to layer two, as layer one we have considered as softer than layer two. So, when actually, we are getting in the range of our geotechnical investigations or the geotechnical design aspects, what you can see? The V S wave which we should consider in our design is basically almost vertical.
So, that is why in many of our design problem, we hardly take any inclined nature of the waves, we generally take weather it is shear wave or primary wave, when we are considering near ground problems, in that case, we mostly consider it is as vertical.
So, vertically propagating wave V S or V P, when we consider the design, is this clear, why in our design there is hardly we consider any inclination of the waves? This is the basic reason because it has to travel several layers, and typically it has to travel for a, from a harder layer to a softer layer.
So, in the previous lecture, what else we have seen, we have seen what are the earthquake waves? And how it gets generated release of energy.
And how they got recorded through seismograph and seismogram is the graph, and how we have classify the earthquake or seismic waves, basically in two categories, body wave and surface wave, again sub classification of body wave is in P wave and S wave; and surface wave sub classified in to Rayleigh wave and love wave.
So, this is the wave, the measurement of the earthquake waves is done, and different depths of earthquake, we have studied.
Shallow depth earthquake, intermediate depth earthquake and deep earthquake; and we have seen that most of our earthquake in history is recorded as shallow depth earthquake.
Then we talked about different layers of the earth, which we have learnt in our earlier geologic course, in under graduate, it composed of crust, then mantle and then core. So, crust is also can be continental crust and oceanic crust, mantle can be a upper mantle and lower mantle, and core can be outer core and then inner core.
Then two types of seismic wave, what we have mentioned just now, body waves transmitted transmit energy through the earth interior, that is primary wave and secondary wave gets generated, and surface wave that transmit energy along the earth surface.
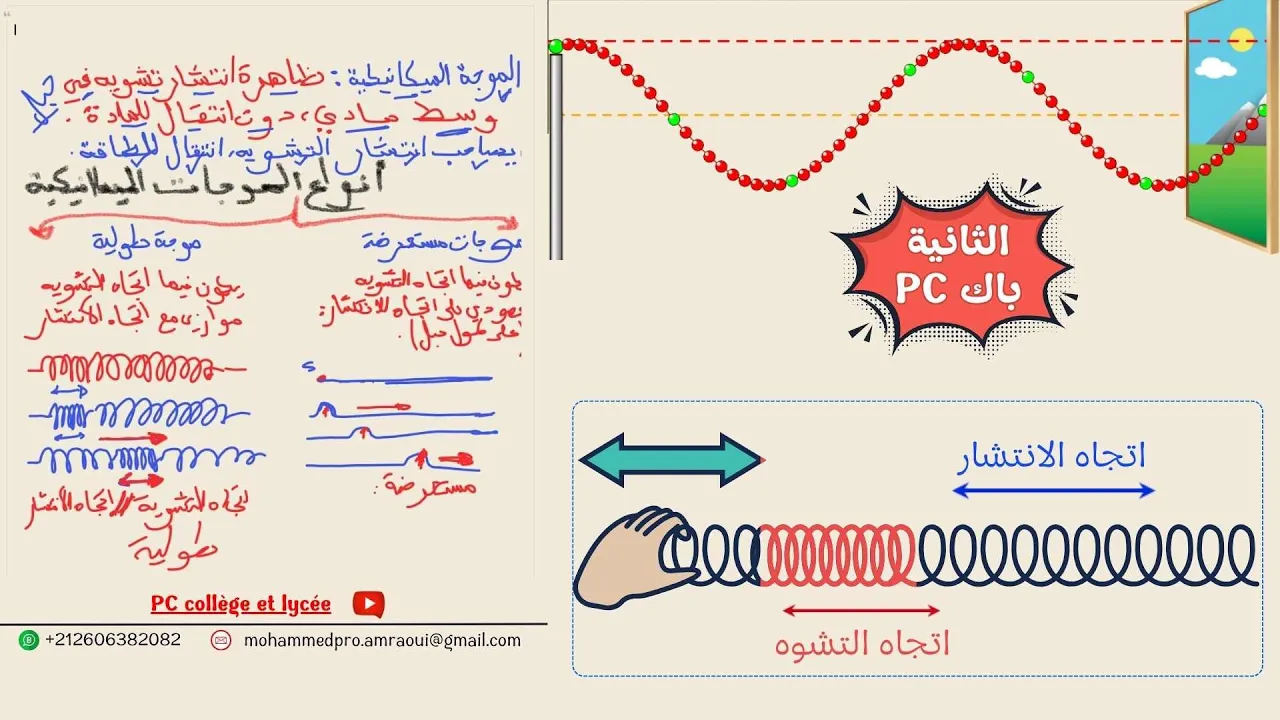
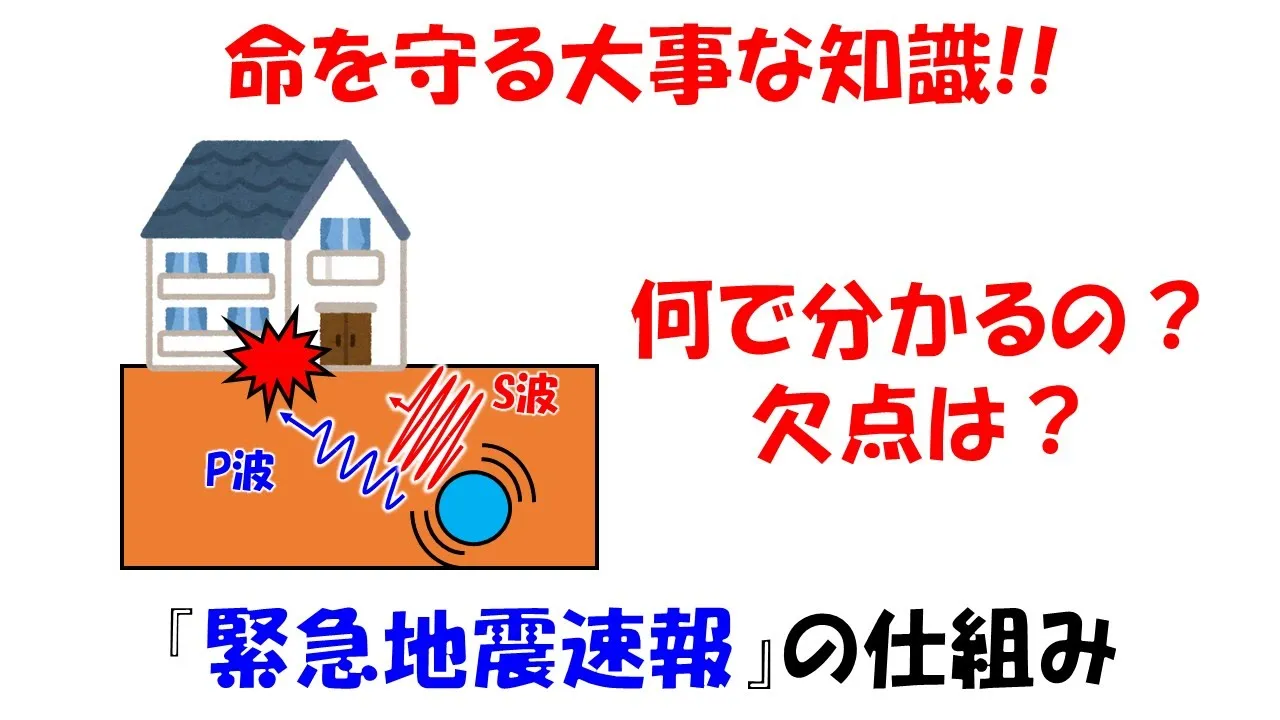
So, this is the basic nature of the primary wave. When it travels through a media, we have seen how, when earthquake focus is there, waves is traveling in these direction, this is the direction of P wave propagation; the sequential contraction and expansion of the media is going to take place.
So, that is why it is called compressional wave also, primary wave or P wave. What are the other characteristics we have seen for p wave in the previous lecture? That their typical crustal velocity is about six kilo-meter per second, and it travels through all the media, that is solid, liquid or gases, and material movement in the same direction as of the wave movement; and it behavior is, it causes dilation and contraction of the earth material through which it travels; and about their arrival, they arrive first on the seismogram because of their very high crustal velocity, that is the maximum crustal velocity among all the waves. So, P wave is having maximum crustal velocity among the four types of waves.
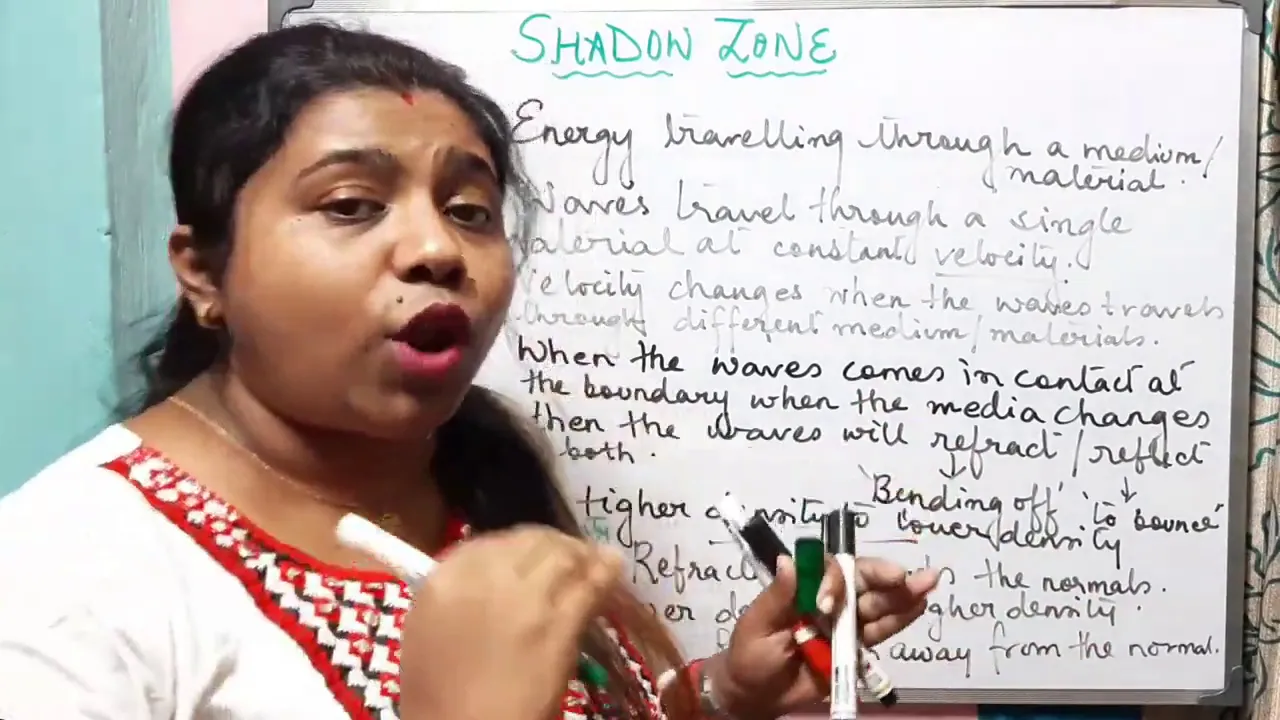
And we have seen from this picture, in the previous lecture that though, suppose the focus of earthquake or epicenter of earthquake, it somewhere here, then waves keeps on travelling to everywhere and that is why when any earthquake happens, we say that gets recorded in all over the world where ever the seismograms are located and it can record, but saying that, we have seen that waves are travelling here. So, all the stations with seismogram at this places can record this earthquake also this places, but we have seen there is a particular zone and that zone dimension is 103 degree to 143 degree approximately, that is called P wave shadow zone, what is the meaning? We have seen that because of the boundary reflection and refraction of this P wave from this mantle to core, outer core some portion of P wave cannot arrive in a particular region and that region is within this angle that is called P wave shadow zone. What does it mean? If there is any seismogram located at these stations at this locations, in that case this seismogram cannot record any earthquake wave getting generated because of earthquake at this place, fine. So, these are all about P waves or primary wave. Now, let us start continuous with our same thing for our today’s lecture with next type of wave, that is secondary wave.
So, what is the basic behavior of secondary wave? Suppose, earthquake focus is here, and direction of S wave propagation or secondary wave propagation in these direction, then it is behavior is something like if you means use a rope and then it continues vibrating like this. So, it is vibrating in this direction, and this direction, this direction and this direction. So, this is the direction of motion of the particles. So, that is why we said whenever S wave travels through a media, if the direction of wave propagation is in this direction, the particle movement is almost orthogonal to the direction of wave propagation. So, that is why the movement of the particle are like this. So, this wave we can explain how the propagation of S wave continuous in a particular media.
Now, coming to the typical characteristics of secondary wave, S wave or secondary wave is having typical crustal velocity of about 3 kilo-meter per second which is just half of the primary wave velocity. So, primary wave velocity having crustal velocity of about 6 kilo-meter per second, it is having 3 kilo-meter per second. What is the behavior of S wave when it travels through a media? It causes shearing and stretching of the earth material through which they pass; generally cause the most severe shaking and very damaging to structures. And another important characteristics of secondary or shear wave or S wave is that, it can travel through only solid media. So, it is very important to note down, because we know water or air, they cannot take shear. So, that is why there is no question of arising that shear wave can travel through liquid or gaseous media, it can travel only through the solid media. Now, shear waves move material perpendicular to the wave movement, just now I have mention that, and what is the arrival time of the secondary wave in a seismogram? It is the second wave which arrives to the seismogram.
So, when an earthquake occurs seismograms are recording different waves; first arrival is for p wave, because of its very high crustal velocity; next higher velocity is for the S wave. So, second arrival is the S wave in the seismogram.
Now, let us look at this picture. Again we are considering, say this is the location on the earth, where the earthquake is getting generated. So, this is a kind of epicenter or focus of earthquake, and from there energy gets released. So, different waves are getting generated and traveling through this media. So, we are now talking about only the say S wave. So, these are the S waves travelling; what happens? When the other parts of the earth that is at this places, if we have this seismograms are located station, they can record this S wave right, but look at this zone that is from that 103 degree from one side to the another side 103 degree; this zone, no shear wave comes because of the earthquake getting generated at this point.
So, it is called S wave shadow zone, shadow zone means no waves reaches at those places.
So, if we have some seismograms located at this part of earth, they cannot record any S wave getting generated due to the earthquake at this location, why it is so? Because see, S wave traveling through this mantel is fine, because mantle is mostly the solid material of the earth; when it travels in this direction, and hits the boundary of mantle and the outer core, what is the outer core? I have explained, it is basically a liquid molten liquid right, it is a fluid state; so obviously, the shear wave cannot travel through the liquid media, it travel only through solid media that is the reason why it is just dead stop at this boundary; nothing will get transmitted in the next layer; that is the reason why on this side, we do not have any S wave coming out because of the earthquake energy getting releasing here. So, hence this is our S wave shadow zone, it is called and it is mentioned S wave velocity drops to zero at core mantle boundary. So, this is the core mantle boundary which is known as Gutenberg discontinuity.
This boundary of mantle to outer core is called Gutenberg discontinuity.
So, what I have explained just now? The combination of P wave and S wave, now I am showing through this slide. P wave is shown in black color arrows and S waves shown in red color arrows. Suppose earthquake is epicenter is somewhere here, earthquake energy gets released here and then waves are travelling throughout the earth interior, and other parts of the earth are also getting recorded these values. So, P waves, you can notice at this boundary of mantle to outer core. So, P waves can get transmitted to the liquid media; whereas, shear waves cannot get transmitted in the liquid media. So, they stop here itself; whereas, P waves gets transmitted that is refracted, then again it from this boundary it gets refracted and comes here. So, this is the zone about 103 or 105 degree to 143 or 140 degree is shadow zone for P wave, and this entire zone is shadow zone for S wave. What does it mean? If we have any seismograms located at these places of the earth, at these locations of the earth, they can record in their seismic station, they will record both P wave as well as S wave, because both the waves are coming to those locations right. And in the seismograph, what they are getting finally, it will look like this with respect to time, because as I have mentioned, P wave is having very higher crustal velocity. So, they will arrive first in the seismogram.
There will be a time laps in between the arrival of P wave and S wave, then second one will come the S wave, because it takes time, because of its velocity, crustal velocity is half of the P wave velocity. So, it takes time and then S wave comes to your seismogram, and then the record of seismograph will look like something like this; whereas, if some seismic recording stations are located at this zone, that is between about 105 to 140 degree, this region, their seismogram will record nothing; because neither P wave nor S wave are reaching within these zone, because it is a shadow zone for both P wave as well as S wave. So, that is why though the seismic station is there recording station is there, but they cannot record anything, they will not feel anything as if any earthquake happens to the other part of the world; whereas, if some seismic stations recording stations are located at this zone these zone, it will record only the P wave, also it is a shadow zone for S wave, so no S wave will be getting recorded, they will record only the P wave in their seismogram. So, this clearly shows how worldwide, the record of P wave and S wave can take place for an earthquake occurring at a particular place.
So, once again, this is inner core, outer core, this outer core is liquid state, this is mantle and this is very shallow crustal depth.
This boundary is called mohorovicic discontinuity, that is the boundary between crust and mantle is known as mohorovicic or m discontinuity, and the boundary between mantle and outer core, this boundary is called Gutenberg discontinuity or g discontinuity. So, how the P wave and S wave, they vary, the velocity they vary as we go from crust to the inner core? In terms of distance. So, this x axis shows as distance in kilo-meter, this first graph shows velocity about kilo-meter per second, if you look at here, the P wave is about as I said crustal velocity is 6 kilo-meter per second. So, as it goes deeper, the media is stiffer or heavier.
So, it is velocity gets increased here; when it comes to this boundary, that is Gutenberg discontinuity, there it drops and now it is a liquid or molten fluid state. So, velocity will obviously be much lesser than what it in the solid state. So, it drastically comes down, then also with increase in the depth towards the earth center, it keeps on increasing; again at this boundary or interface, there is a jump and then it continues in the inner core, that is the distribution of P wave velocity across the earth’s interior, and what about S wave? It is velocity crustal velocity is about 3 kilo-meter per second, when it goes deeper in the mantel it increases, but when it comes to the boundary of mantle to outer core, it to drops down to absolute 0, because this outer core is liquid state. And how the earth’s interior density varies? So, as I was saying that from crust to mantle, the density keep on increasing. So, this is the typical values of density in gram per centimeter cube, from the earth’s crust to mantle and then outer core and inner core.
Coming to the surface waves. So, they travel obviously, within the crust, and not only within crust very close to the ground surface. So, that is why the name, surface wave; if you look at this is the earthquake focus, S wave, P wave, they are travelling inside also and getting recorded in the other side; whereas, surface wave, they travel surfacially as the name suggests, only in this direction to a particular certain distance. So, they travel just below or along the surface, that is the condition for surface wave; and the wave velocity, they are much slower than the body waves. So, velocity of this surface waves are much lower than P wave and S wave; and what are the effects of them, they cause rolling and side-to-side movement of the particle, that is when this surface wave travels, the particle either they roll or side-to-side movements occurs; and these are specially damaging to the buildings constructed on the ground surface.
So, this is the two types of surface wave, you can look here. Here side-to-side motion occurs when the direction of surface wave propagation is in this way, the particle moves in this direction as well as this side-to-side movement occur. So side-to-side swaying of objects on earth surface is opposite to the wave motion. So, these are supposed some buildings or some structures, constructs on the ground surface, they can have side-to-side motion because of wave propagation like this, and another type of earthquake wave, they can cause up and down rolling type of motion like this. So, the direction of surface wave propagation in in this direction; however, the nature is creating on the ground surface something like rolling type, up and down motion, what does it mean? It is will give you a feeling as if you are travelling in a sea, in a boat. So, as the waves comes that kind of rolling motion is getting experienced, and any structure constructed on the ground surface, they can roll and also upside down things can occur.
So, this is the nature of destruction caused by the two types of surface waves.
So, coming to the sub classification of surface wave, what we have seen? Rayleigh wave, their typical velocity is about 0.9 times of shear wave, that we have seen through the expressions of relation between Rayleigh wave and shear wave, that is the function of only Possion’s ratio right; in the previous days lecture, I have mention that and today also in recap I have mentioned. So, we have seen Rayleigh wave velocity is about 90 percent of the shear wave velocity. It is behavior is they cause vertical together with back-and-forth horizontal motion. So, motion is similar to that of being in a boat in the ocean, when a swell moves past; and the arrival of Rayleigh wave in a seismogram, they usually arrive last on the seismogram, what does it mean? The Rayleigh wave velocity is having least velocity among the four categories of the waves what we are studying.
So, that is why, they arrive last on the seismogram; and the nature, just now we have seen, this kind of rolling upside down movement can occur, when the wave propagates in this direction and structure can destroying in this way. So, that is why it is said Rayleigh wave is the most damaging one for the structures constructed on the ground, not only because of it is behavior of motion of the particle due to the wave propagation, but also as I have mentioned, it takes about two third of the energy getting generated in the earthquake, getting released in the form of Rayleigh wave finally.
And about love wave, it is typical velocity depends on the earth structure, but obviously, it is less than the velocity of S wave. So, the relationship between love wave and S wave also we have seen in the previous lecture, the equation how to obtain the love wave velocity. And it is behavior, it causes shearing motion horizontal, similar to the S wave that is when wave propagates in this direction, it moves in this direction similar to the S wave; and their arrival is usually arrive after S wave, because it is velocity is less than shear wave; so obviously, it arrives in the seismogram as the third one. So, first one in the seismogram is P wave; second one is S wave; third one is love wave; and last one is Rayleigh wave in the order they appear in the seismogram; but obviously, they appear before the Rayleigh wave. So, you can see, depending on the velocity of shear wave, love wave and Rayleigh wave velocity their recording time and the time difference between recording of shear, love and Rayleigh wave in seismogram is hardly any difference is there, they almost come one after another.
So, S wave soon after that love wave soon after that Rayleigh wave, that way it getting recorded in the seismogram; whereas, there is a substantial amount of difference between the P wave and S wave arriving at the seismogram. So, how to make use of that to locate an epicenter of an earthquake, because when an earthquake occurs, suppose in that place we do not have any seismo-graphical recording station, does that mean that we cannot read the intensity of the earthquake or epicenter of that place?
No, then what is use of having so many seismological stations around the world? From their recordings, it is possible to identify the exact location of the earthquake epicenter, how? Let us see.
So, this is once again, what we have talked about just various earthquake waves, you can see fault rupture at that point focus point, this is the earthquake focus, and if you take a vertically upward line which is hitting on the ground surface, that on the ground surface that point is called epicenter. So, focus is where actually it is getting generated, earthquake focus, and earthquake epicenter is on the earth surface, vertical projection of that point to the ground surface.
And then body waves travels through the media; whereas, on the surface only, the surface wave travels and this is the typical behavior.
And nature of different waves, we have seen. Nature of P wave is continuous, extension and compression that is push and pull kind of nature in the media, when the direction of energy transmitted in this direction; and nature of S wave is side to side movement up and down.
Nature of Rayleigh waves is sideways in horizontal plane; and whereas, nature of nature of love wave is sideways in the horizontal plane; and nature of Rayleigh wave is elliptic vertical plane. So, in this way, rotating or rolling ups and down can occur.
Now, locating an earthquake’s epicenter using the seismological recording stations data, that is our seismograph data, how to locate an earthquake’s epicenter? Seismic wave behavior is we have studied just now, P wave arrives first, next is S wave, next l and r wave, love wave and Rayleigh wave. So, after an earthquake, the difference in arrival times at seismograph station can be used to calculate the distance from the seismograph to the epicenter. So, with respect to time on the plot, that is when seismogram are recording on the dram and that graph sheet, how they will record? The typical record of the seismograph will look like this; initially, when there is no earthquake, initially it will keep on vibrating like this, it is actually a background noise. So, you can neglect those things; when actual earthquake occurs at any point around the world, if it is not within a shadow zone of that particular wave, then obviously, some undulation and wave will arrive, and that is the arrival time of P wave, then it will slowly die down, and after sometime, you will notice then another large magnitude wave is getting recorded in your seismogram, that is nothing but arrival of S wave, arrival time of S wave, this is the arrival time of P wave. So, as I was mentioning, there is substantial difference between the time of P wave arrival and S wave arrival in a seismogram, provided there is one condition, remember the station should not be located at a shadow zone of any of these two waves; otherwise, if it is located in shadow zone of S wave only; obviously, these waves will not come; only we will record this P wave; and if it is located in the shadow zone of P and S wave both, nothing will appear. So, we will not feel even that some earthquake has occurred in some part of the world; but obviously, we are getting several areas of the earth which are not in the shadow zone of any of the P wave or S wave, that is between from that zero degree, if we consider at the top point, where earthquake is occurring on both the sides about 103 or 105 degree. So, within those region, whatever seismological stations are located, they can record both P wave and S wave. So, their arrival time, we can get from the stations at this seismograph; and then of course, the love wave and Rayleigh wave, they keep on continuing coming and getting recorded.
So, we are concentrating on this aspect that is the time difference between P wave and S wave.
So, how we can make use of this? It is called by using S minus P time formula, we can locate the distance of an epicenter, how?
Because we know time is nothing but distance by velocity. So, the time for shear wave or S wave recorded is nothing but the distance it has travelled from the earthquake epicenter to the recording station; D is the distance between the epicenter to earthquake recording station by v s, and the time for p wave or primary wave is, it has also travel the same distance, but for v p.
So, T s minus T p, because in our recording station, the value of T s will be larger, right? Because it is on later time, T p will be lower than T s. So, T s minus T p is nothing but D by v s minus D by v p, which is nothing but D times v p minus v s by v p v s.
Therefore, D is given as v p minus v s by… Therefore, D distance can be computed as v p v s by v p minus v s times T s minus T p.
So, this is the simple expression, we can find out the distance of an epicenter from a seismological recording station. So, any station which is recording both P wave and S wave, knowing the crustal P wave velocity and shear wave velocity, which already have mentioned, their typical values, and the recording time of S wave and P wave, very easily we can compute the distance between the epicenter of earthquake and the seismological recording station. Now, how we can make use of these to locate the epicenter? Because at one station on the earth surface, it has recorded the waves traveled because of earthquake to that station, suppose this is our seismological recording station at this point, T s T p we have recorded, v SV p typical, we know we obtain the value of D. Now where is that earthquake epicenter? D from this direction D, or in this direction D, or in this direction D, where? We do not know. So, it can be at any distance D with the, if we draw circle making that seismological recording station as the center on a graph paper with a radius D, if we draw circle within that periphery, any point can be the possible location of an epicenter. Now, how to locate an exact location? Let us see.
So, let us look at here, what I have mention just now, the same thing is written, if average speed for all these waves are known, then S minus P time formula is used to compute the distance between a recording station and an event, means were the earthquake occurs. And this is the expression, very simple way we can obtain this expression.
Now, before coming to this, let me mention this method, it is called three circle method.
What is three circle method? Read S minus P times from minimum three seismograms that is from three seismic stations, wherever you have recorded both P wave and S wave, you get the value of this S minus P time. Then compute the distance of each of the event from that recording station using that S minus P formula, which we have studied just now. So, for example, suppose this is our station one, recording station one. So, from this point at a distance of D 1, suppose we got the distance where then earthquake has occurred. So, event has occurred at a distance of D 1. So, let us draw circle taking that point as a center, recording point as a center with radius as D 1, let us draw circle. Similarly for another recording station, which also have recorded the same earthquake with both P wave and S wave arrived to their seismograph. So, the seismogram record will give us the S minus P formula from which we can calculate the distance from that recording station to where the earthquake has occurred; in a similar way, another circle with a radius D 2, fine; similarly suppose, another station, another recording station, this one has also recorded both P wave and S wave and using the same S minus P travel formula, travel time formula, we can obtain another distance say D 3, where the earthquake has occurred. So, let us draw another circle, taking this as center and D 3 as radius. So, where actually the earthquake has occurred?
Where these three circles will meet, this is the point; look at here, I am pointing here with this pointer. So, this is the point where these three circles meet that is the actual location where an earthquake has occurred. So, this is the location of earthquake epicenter clear. So, in using this three circle method to obtain the earthquake epicenter, one basic assumption is the earthquake is relatively shallow earthquake. So, epicenter is relatively close to the hypocenter, and overlapping of the point, gives us the event location, and many a times it will happen, you may see that we may not get an exact overlap at a particular point, but we will fairly get a good idea, the common zone, interface zone of these three circles, very small common zone, if it boils down to a point, then obviously, we got the exact location; if not, at least we get some idea of where the earthquake has occurred. So, this is the way, how worldwide seismic recording stations are used to obtain or to locate the epicenter of an earthquake, this is the way we use. So, this three circle method is mentioned here, you can imagine, if we use more number of circles here, obviously, we will get much more precise result, because suppose some recording station is having some difficulty during the recording process or some manual error or some damage to the instruments or something else has happened. So, instead of relying on only those three, you can use 6, 7 8, any number of recording stations and plot that in a graph sheet or paper like this, draw circle like this. So, most of them where they will converge to a single point or at least to a single shadow zone, common zone that will give us the location of earthquake epicenter. This is how worldwide till dead the earthquake epicenter is obtained. Because many a times, what happens? Earthquake can occur at any place within a seabed. So, there is no recording station, within a desert, there may not be any recording station. So, how we locate the earthquake epicenter? This is the way, because the waves travels and P wave and S wave, they have substantial amount of difference in their velocity, and that is why, they in their arrival time. So, that is how we can compute their location of earthquake epicenter in this way Now, coming to another method, this is seismic travel time curve, this method is called seismic travel time curve. Concept is almost similar, what it does, measure the time between P wave and S wave reaching on the seismogram, what we have done just now. Use the travel time graph to obtain the epicenter in this manner. So, if the speeds of the seismic waves are not known, then this travel time curve for that region to get the distance is very useful; the three circle method and the distance what I have explained and wrote the formula, that we can use, provided we know the typical crustal velocity of P wave and S wave very accurately; if it is not exact, then we may get the erroneous data. So, that is why I said, instead of relying three circle, let us use as many number of circles as possible based on available recording stations. But suppose, if we want to get rid of that error, where we do not know the exact values of v p and v s, the crustal velocities, this travel time curve method can be used. So, let us look at here, how it is done. Suppose one seismogram a, another seismogram b, another seismogram c at three different locations, all of them are recording both P wave and S wave; and for seismogram a, the recording. So, this is our time axis you must have understood, and this is the arrival time of P wave, then after some time S wave start arriving in seismogram a. So, this is the time interval, for example, it is given, let us say 3 minute interval between the arrival time of P wave and S wave for seismogram a located at one point. In another station seismogram b, the arrival time of P wave is somewhere here, and arrival time of S wave is somewhere here, and there is a time difference of about 8 minute say and another point of seismogram recording station, let us say it is c, where P waves arrives here and S waves arrives here, and there is a time difference between their arrival time is say about 11 minutes. Now knowing these three time difference of three locations, and what you know? This is known, distance from seismogram location a to b, b to c, the recording station distance is obviously is known to us. What we can do? We can take a graph paper. Now distance travelled from the epicenter in the x axis and this y axis shows time elapsed after the start of earthquake. Now, we try to match these three locations, in such a way in the graph sheet that their distance as well as individual distances between the stations and the time intervals, they follow a continuous pattern; that can be easily done by changing the locations of the positions of the seismogram and their distances, if you slide them over the paper, what we will get? At which location, they follow a continuous pattern of movement of this from time elapsed after starting of earthquake to distance of earthquake epicenter; and obviously, the smaller time will be very close to the epicenter, smaller time interval between P and S wave; then the intermediate one and then the higher will be obviously, farthest from the epicenter.
So, that way, you can get a fair estimate of the distance of earthquake epicenter from those stations in this manner. So, this is called seismic travel time curve method. So, with this, we have come to end of our module three that is on wave propagation. We will stop here today.
Up Next
Earth's Geodynamo: Probing the Deep Interior
@CarnegiePlanets
12.2K views•2018-11-09

21cm Hyperfine Transition in Neutral Hydrogen: Radio Astronomy Basics
@AaronRobertParsons
12.4K views•2011-10-13

Lagrangian Equation for 2D Systems & Electrical Circuits | NPTEL
@iit
23.2K views•2010-01-15

Entropy and the Second Law of Thermodynamics Explained
@veritasium
27.5M views•2023-07-01
Related Study Plans & Knowledge Roadmaps
Structured learning paths in Physics