















This tutorial demonstrates how to plot real-time serial data from Arduino using Python's Matplotlib library. The process involves two main steps: first, reading serial data from the Arduino using the pyserial module by creating a serial object with the correct COM port and baud rate, then decoding the ASCII characters to floating-point numbers; second, plotting the data in real-time using Matplotlib's interactive mode (plt.ion()), where data is continuously appended to an array and the plot is cleared and redrawn in a loop with plt.pause() to allow rendering. The example shows plotting voltage values from a potentiometer and LDR sensor, demonstrating how to visualize sensor data as it changes in real-time.
Real-Time Arduino Serial Data Plotting with Python Matplotlib
Added:Basic Python programming, including installing third-party libraries (pip) and managing standard data types.
Fundamental Arduino programming, specifically reading analog/digital sensor pins and writing data to the Serial Monitor using `Serial.print()`.
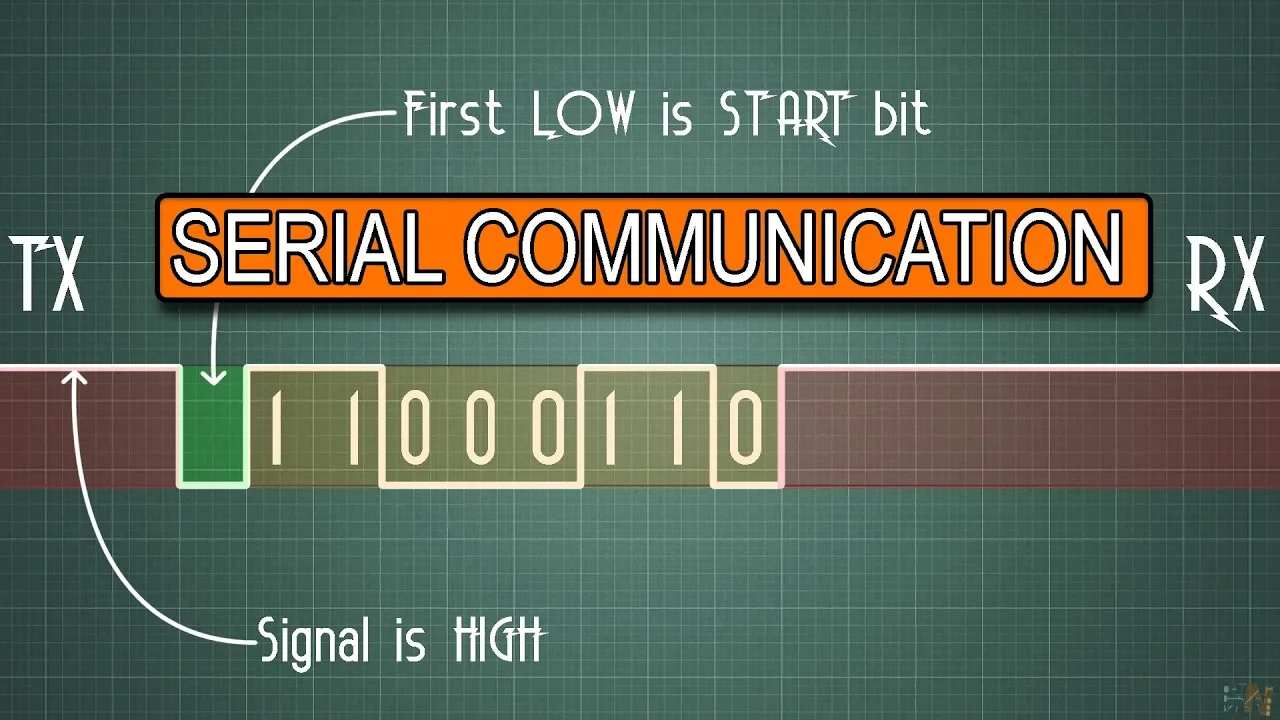
Core concepts of serial communication, such as baud rate, COM ports, data packets, and the transmit/receive (TX/RX) process.
Introductory data visualization in Python, specifically plotting static 2D graphs using the Matplotlib library.
Advanced plotting optimization using Matplotlib's `FuncAnimation` API or high-performance libraries like PyQtGraph for faster refresh rates.
Implementing multithreading in Python to separate serial data ingestion from the GUI visualization thread, preventing interface lag.
Building interactive Graphical User Interfaces (GUIs) using Tkinter or PyQt to add control buttons, sliders, and multiple real-time graphs.
Establishing bidirectional communication to send control signals from the Python application back to the Arduino to actuate hardware.
Data logging and storage, integrating the real-time stream with databases (like SQLite or InfluxDB) or local file systems (CSV) for historical analysis.
23.9K views281likes14:42Original Release: 2019-10-13
hi welcome to online to your videos from JCB olives for more information and to download the source code of this video you can visit us at www.visaplace.com we also provide online training help in technical assignments we also do freelance projects based on machine learning data science Python are do you know or as Wi-Fi etc so if you have any such requirement then you can let us know by contacting us through our website which is www.hyken.com l dot bomb okay so let's start with it let's first give you a little about our hardware so what is happening here here we have this Arduino hardware and right now it is connected to this potentiometer and we also have this LDR connected in series with this resistance so right now we have already have programmed this hard you know to send data serially at an interval of 100 millisecond to computer at a board rate of 9600 so let's look at the output of this Arduino hardware which we are getting ok so you can see directly on Arduino ID go to tools and go to serial plotter so here you can visualize the output of this Arduino so right now it is sending data so let's try to change let us try to change the output so let's try to change the output by varying the potentiometer ok so we are increasing the resistance its value is increased we are reducing it okay so here this is just to show like we this our Dino is sending some serum data continuously so what we are going to do in this video we are doing we are trying to plot exactly the same plot right now which we are seeing using Python so it when we try to do the same thing using Python so there are two basically two different tasks right two different - means like first we need to read the serial data which is coming at the serial port and then to plot it okay so first of all we will learn how to read the serial data which is coming at any specific moderate so in order to do the same in Python we need a module which is known as the PI serial okay so you need to install this PI serial prior okay using this particular command so we already have installed and this is spider so in order to do the programming we are using this spider ID okay we already have installed this pi serial into it so let's try to read one byte of data okay and then we'll move forward with the reading multiple bytes okay so first of all let's import serial as Assad okay now let's first save this file okay now let us say this file to serial plot okay and then save it now in order to read the serial first of all we need to create a serial object that can be created by s equals to Assad dot serial in this V need to provide the pump o to which this ID know is connected so right now in Windows we are using this comb it but if you are using next distribution or some other so you can use the corresponding comport in here and then we need to specify the baud rate at which this Arduino is sending data to the computer right and then because we want to read only one single data all right so reading a single line is simple as door create line because what actually this serial port the pudding is like it keeps on sending a new line of data okay so that is why we are using this as torch red line let's say if we you are get in your application you are getting our data continuously then you can get there are several other functions as well like to read by it or read a specific number of bytes then you've been used that particular function right so right now this Arduino is sending one number and the new line then another number and then dual and so on so that's why we are using this red language so after executing this code we will get a variable variable here and we will get a value in a so if we type a so it is yeah so if we type a it is B for binary and it is directly the encoded in utf-8 to convert it into that into some decimal number so we need to type another one like a dot decode okay so it automatically coats the number now it converts this a into string so if I type a right so right now it's in bytes there's a kind of string and then we can write like because to float we can convert into float a of 0 to 4 index so this is how we get our B data exactly the value which and the voltage value which our Dino is sending okay so these are the similar commands which we'll be needing to get the voltage value from this Arduino code actually but ever we receive on serial code that is in the form of ASCII characters right so we need to convert those ASCII characters into a floating point number in order to plot it so that's what we are doing here will be used to float a okay so now let's this was the simple like how to read a single byte now let's create a complete program I would like to plot it okay so for that we need to plot matplotlib mad Lord left dot five Lord King and we may also need the numpy okay so first of all we will make PLT dot close so if there is any figure is there that will be close to it and then there is a come on we will open the figure here T dot figure and we will make this command PLT dot I am I own so otherwise what happens if we make PLU door shows so our control struck there so by using this iron command control doesn't hold to the plot come on only and all the instructions which are then afterwards this PLD door show those will be executed and then PLT dot show okay now we need to create obviously a serial object so we'll create at first and then yeah because we want to plot data so we need to a pan into an eye so we'll create an empty array of data so that the next data can be appended into it so let's get some lines now we will keep on doing let's say vial true or we can say four thousand number of times let's say make it look to the hundred only so let's say and I equals to zero till while I is less than hundred only till then it should work okay so we'll write or you will read our data and we will decode the data and then we will make a float converting it to float okay let's make it super you have defined some variable I and then we will a pan into data so data equals two and P dot append and it should be appended into data only datacom be okay so whatever data we have got we have received from the C report that will be appended included array and then we will first will clear all whatever is plotted earlier and then we plot it again PLT dot plot of data and then we will make PLT dot post so we need to provide some false otherwise it will not display anything so we need to give some time to matplotlib in order to plot the data on the screen and yeah okay and then we need to increment I so otherwise it will not stop okay so let's see how it works okay so I will turn on the webcam as well all right so you know I hope the screen is visible to you okay let's run it a could not open come for permission access is denied let's run it again yeah now it's working ok so I will you husband so it is plotting the data so I think some random noise is generated because this is 3.65 okay so let's run it again ok we need to sometimes we need to put come on like as dot close okay so that it close automatically so we can also write like here okay so let's run it I hope you are visualizing it okay so lets them it oh they are then it has not closed properly okay so like a score close yeah so now let's run it and we will try to change the potentiometer so that we can get a variation on it so let us run it okay you are getting data value is increasing decreasing and so so you are varying this voltage and real time and also plotting the data in real time so we run this come and this port 400 I hundred iterations found it so it took hundreds ampuls and then stopped okay so this is the very basic one how to load a data now let's try to get this LDR data from it we can get the same one so what we are now doing we are connecting the CC and ground and we are taking the Aldea data from it from here okay so we know when light falls upon it it's Western score decreases if I am right and the vs. resistance victory is the voltage across it because voltage across this resistance will increase so let's run it okay so we are getting that's yeah so we have when we are putting dart we are the resistance of this LDR is increasing and the voltage across this resistance will get the trace so that's what we are getting here so we can put it entirely down okay let's run it again because the voltage variation is it is incomplete life so try to put more light on it there's a variation into it so so I hope you learned like how to display this data in real time on Python so it's really cool and I hope you understand a lot so if you have any doubt or any comment and suggestion then you can let us know by commenting below this video okay further we also provide online training helping technical assignment we also do freelance projects based on machine learning data science - etc so if you have any such requirement then you can let us know by commenting below this video okay and we will try to help you out okay so that's it for this video thank you [Music] you
Up Next
25:36
Real-Time Serial Data Plotting in Python GUI Tutorial
@buildwithembeddedgarage
49.9K views•2019-11-17

26:22
Walking in the City: Urban Rituals and the Flâneur in Contemporary India
@PSBTIndia
1.9K views•2016-08-02

9:49
FastAPI vs Flask vs Django: Choosing the Right Python Web Framework
@TechWithTim
302.5K views•2024-05-26

1:42
Game of Thrones Opening Credits: A Cinematic Analysis
@gameofthrones
46.3M views•2011-04-18
Related Study Plans & Knowledge Roadmaps
Structured learning paths in General & Interdisciplinary Studies
general-studies
Artificial Light: History, Tech & Human Impact
01The Pre-Electric Era: Fire, Oil, and Gas Lighting
02The Incandescent Revolution and Grid Electrification
03Gas Discharge and Fluorescent Illumination
+ 3 more learning modules
14h6 modules
Explore Roadmap
general-studies
Elevator Engineering: History, Physics & Cities
01From Hoists to Safety Brakes: The Dawn of Vertical Lift
02Hydraulic vs. Traction: The Engineering Physics of Elevators
03Modern Speed, Safety, and Algorithms
+ 2 more learning modules
12h5 modules
Explore Roadmap
general-studies
Rubber: Material Science, History & Geopolitics
01Origins of Natural Rubber & Mesoamerican History
02The Chemistry of Natural Rubber & Vulcanization
03The Geopolitics of the Rubber Boom & Colonization
+ 2 more learning modules
12h5 modules
Explore Roadmap
general-studies
Containerization: Evolution, Logistics & Trade
01Ancient Trade & Bulk Cargo: Amphorae to Barrels
02The Industrial Revolution & Cardboard Packaging
03The Containerization Revolution: Malcom McLean
+ 2 more learning modules
12h5 modules
Explore Roadmap