![(3시간) 이 영상 하나로 우주 지식 완전정복! 천문학부터 물리학까지 ✨우주✨ 명강의 모음.zip [어쩌다어른D]](https://i.ytimg.com/vi/JU9vb2mbY20/maxresdefault.jpg)


















The Lightkurve Web Interface is a user-friendly web application that provides access to the Lightkurve Python package's capabilities for analyzing astronomical flux time series data from NASA's Kepler, K2, and TESS missions; it enables users to perform key astronomical analyses including searching for target pixel files, generating light curves through aperture photometry, normalizing flux data, detecting transit timing variations (TTVs) using river plots, and visualizing results—all without requiring Python programming expertise.
How to Use the Lightkurve Web Interface for Exoplanet Data Analysis
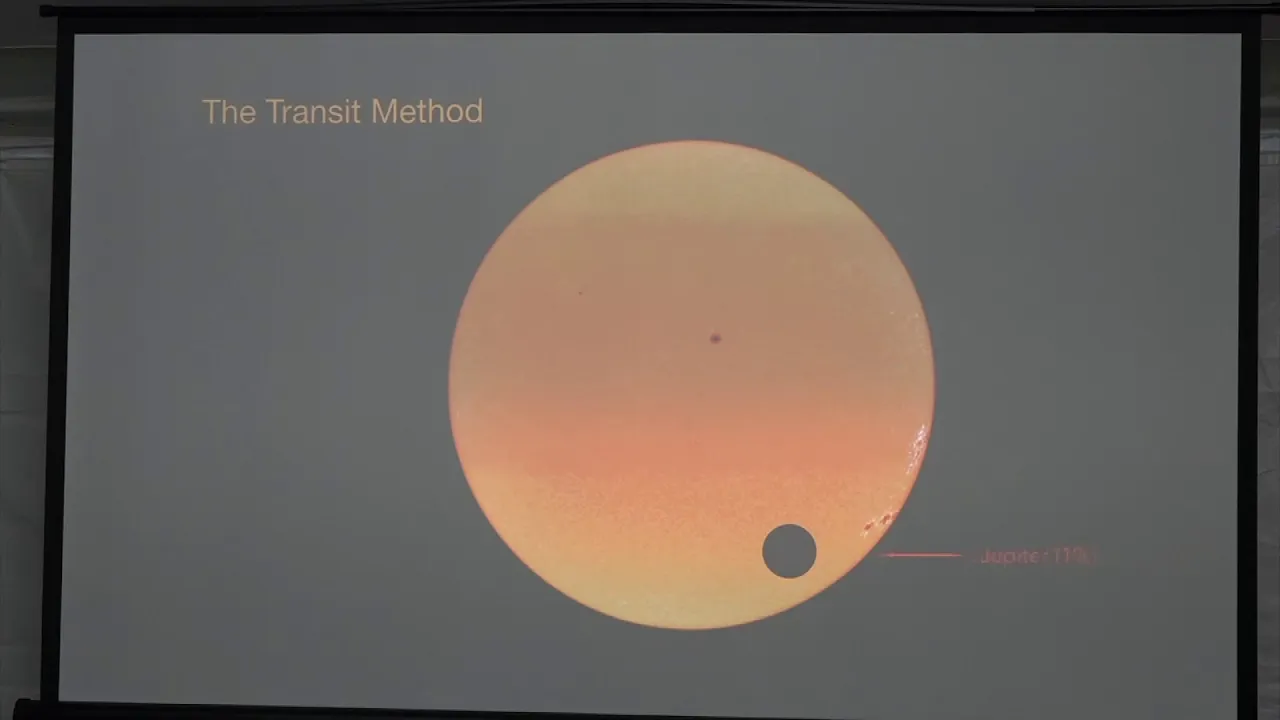
Added:The transit method of exoplanet detection, including how a planet's passage in front of a host star produces a periodic dip in observed brightness.
Basic concepts of astronomical photometry, specifically what a light curve represents (flux or magnitude over time) and sources of stellar variability.
The primary mission designs and data collection differences of the Kepler, K2, and TESS space telescopes.
Fundamental principles of digital astronomical imaging, such as pixels, background noise, and the concept of an aperture mask.
Transitioning from the web interface to programmatic data analysis using the Python Lightkurve library for automation and scale.
Advanced detrending and systematic noise-removal techniques, such as using Cotrending Basis Vectors (CBVs) or Pixel Level Decorrelation (PLD).
Transit modeling and physical parameter estimation (e.g., calculating planet radius, orbital period, and inclination) using tools like batman or exoplanet.
Conducting multi-wavelength analysis and combining transit photometry with radial velocity data to determine the bulk composition and density of exoplanets.
1.1K views26likes10:13Original Release: 2021-01-13
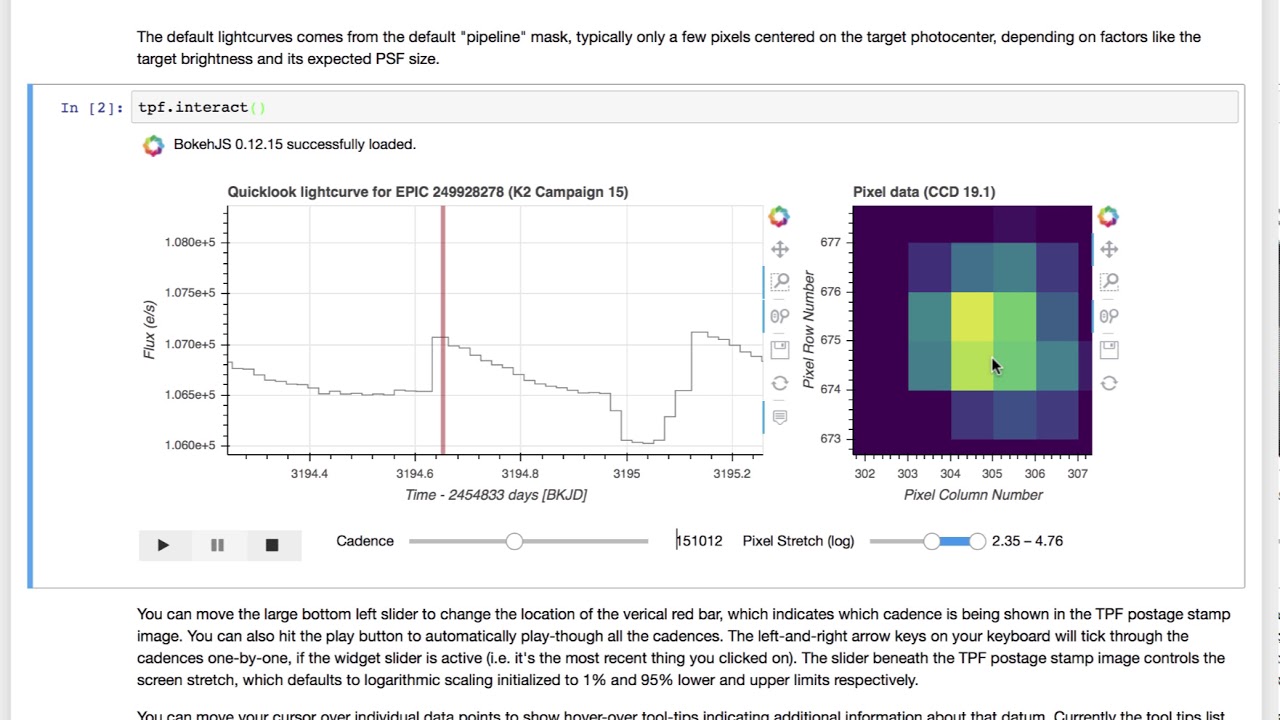
Carlo with the EMAC Science Support Team and we're here to show you another great demo. Today we're going to be looking at Lightkurve. Some of y'all may be familiar with Lightkurve. Lightkurve is a Python package that analyzes astronomical flux time series data and that's a fancy word for "it makes lightcurves". Really easily too. So as you can see we have two separate entries for Lightkurve, one is the actual Python package, the other is a web interface created by Yosef Miller.
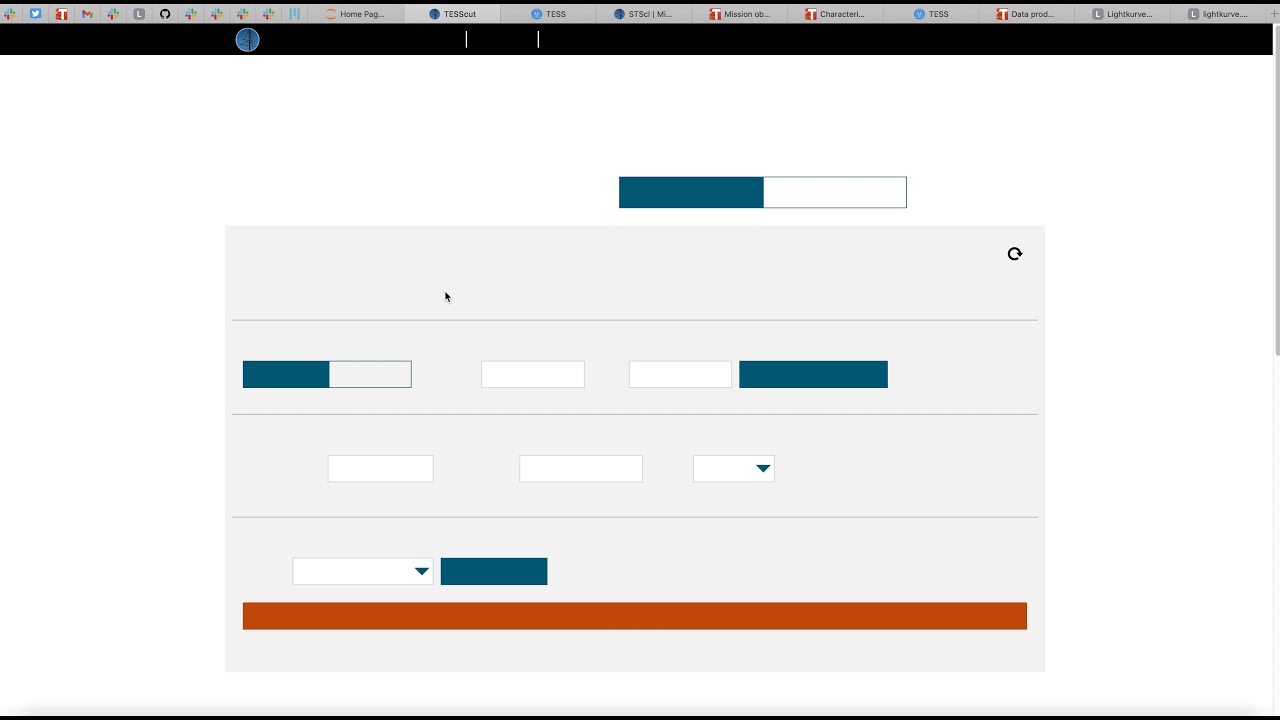
So we're gonna go ahead and click on "about" and that will take you to this Lightkurve page and we're gonna hit "quick start" and we're just gonna kind of follow along with this tutorial that I already have over here. Oops, I had over here and now I have over here. Okay, so second thing we're gonna do is we're gonna go down here, we're gonna hit "launch", this will take you to the Lightkurve web interface and it's pretty simple. It's literally the python package in a web interface and I know that sounds redundant but you'll see what I'm talking about here in a sec.
So very first line that we're going to look at, "so search target pixel file". What we're going to do is we're going to hit "target pixel file" and before that we'll give this a name say, "demo1", okay so we're going to hit "target pixel file" and then we are going to enter in our search parameters. So we're going to enter this star. This is actually a KIC ID but you can also just put in the number. Let me go ahead and copy and paste that in. For those of y'all that might be familiar this is Tabby's Star and this one, it's a pretty interesting star because a while ago the media took it and claimed it was aliens producing what you're about to see and for those of you that are just getting into the Exoplanet Game I'm not even going to tell you what it is because it's more fun to figure out for yourself. Okay, so quarter is "16", so we'll go ahead and put it in "quarter 16" and we're gonna search for our target. So all you're gonna do is hit "search". As you can see this little thing was spinning that means it was working, you can hit on this "comment" and it'll tell you exactly what's going on and then you can hit on the "eyeball" to see what you got. Okay so one target, perfect. That'll make things easy for us and you expect to see one target. Now we're going to keep scrolling down and we are going to try to produce a lightcurve so all we're going to do is again follow the tutorial. Now we have "pixelfile.to_lightcurve(aperture_mask='all')".
So we're going to go ahead and use the aperture photometry, geez I mispronounce that whole word, that's okay though. We're going to click on "aperture photometry" to basically, essentially write this code into our web interface and then we are just going to go ahead and hit "calculate". The Kepler data is actually really clean so we don't have to go through any of this data reduction. Thank you to the Kepler team for that. So as you can see it's working.
We can hit this "comment" to see everything that's going on. Oop "finished execution", let's go ahead and have a look. Yeah so this is in kelvin. I don't like that, I always like to use percent and as you can see you have a bunch of different options so let's go ahead and normalize it and while it's running we're gonna check it out see if it's doing what it's supposed to do. Cool, as you can see you can also empty out a bunch of these which I should have done before I started but yeah. So really really cool stuff here. Look at that! This thing has a dip of 20% which is crazy in the exoplanet world and that'll be your homework. You can you can figure out why what's causing this giant dip. It's not aliens, sorry to disappoint.
So, on a brighter note let's go ahead and check out another thing that this web interface can do and also this python package can do. So Python or Python Lightkurve can also create river plots.
So river plot is something that you want to use when you think some target, some planet, some thing might have some TTVs and TTVs, you know, transit timing variations, it's when your planet isn't showing up when it's supposed to there's some variation in its timing if you will. So going right down the tutorial as you can see here we have "search_lightcurvefile" so we're going to hit "Light Curve File" and this is the KIC ID so we're just going to copy that copy and paste and we're gonna hit, now it wants us to "download_all().PDCSAP_FLUX.stitch()" so that means we'll get rid of this. We will go down here to where it says...Okay, so this might happen once in a while where it either won't let you search or want you calculate that's not a big deal. Sometimes you keep going with what you're doing and it fixes itself.
Other times you have to refresh it but like I said, not a big deal. So anyway, so we're gonna go ahead and hit this "pre-search data conditioning SAP" as we were told and then we're going to go ahead and stitch everything together hit "stitch" and let's, okay we'll change the name, let's go ahead and run that. So it's working "initialized" cool shouldn't take too long but just in case it does I already have this preloaded in. Oh all done! Okay yeah cool, so our flux and our time. So something weird is going on here right? Maybe a TTV. Let's find out, let's prove that mathematically, with a plot, that's easy to understand.
So first we're going to reduce some of this data because it's really messy. So we'll just go ahead and again follow the tutorial. So we're going to go to this flatten option, "flatten" and in the actual Python package the first argument of "flatten" is "window length" so that "21" corresponds to this "window length". Now we're going to keep going down and it gives us a period and a t0 so let's go ahead and include those. So it's telling us to fold see "clc.fold" "clc=clc.flatten(21)". Okay perfect. Following along just great and we'll go ahead and copy this we'll put that into our period. We're gonna go ahead copy that.
Cool now next thing we're gonna do. So now we've reduced a bunch of data right. The next thing to do is honestly see how it has this, ".plot_river()" it's a function already built in. So we're just going to hit display "river plot" and this is what I was warning us about this "run calculation" is not letting us run our calculation, no big deal. We'll just reload it, give it a new name. We'll call it TTVVVV. No specific reason for that that's just what I put in. So we're just going to go ahead and run this back. Go ahead and copy this again boom and then we're going to go ahead and memorize everything we did so we have this "pre-research data conditioning SAP" we're going to flatten our data, that's the wrong button that's the that's what we want, "21" we're gonna go ahead and stitch our results together we're going to fold the lightcurve okay all right whoops and then we're gonna keep scrolling down and we're gonna hit display "river plot" so let's see what our river plot looks like. So what we did was we followed the tutorial we loaded in our data. We looked at our data and if you guys want to see what those look like... they're not here anymore and now you should get something that looks like this and we do perfect. So river plot, cycle versus phase and then you have your normalized flux off to the side as you can see here you can literally see the variation in the transit timing of this this target which is; it's a planet candidate. So yeah it has really really strong TTVs. Super easy to see with this Lightkurve web interface. Super easy to see with the Lightkurve Python package. Yeah really really cool tool, super useful, really good for undergrads starting up on exoplanets. This is how I started, so yeah guys I hope you guys enjoyed that and if you guys have any questions make sure you follow us on twitter @ExoplanetModels and subscribe to our YouTube, bye!
Up Next
70:46
Python Variable Star Frequency Analysis with Pyriod
@AAVSOHQ
2.7K views•2022-10-12
61:17
First Billion Years of the Universe with the Square Kilometre Array
@iaaudc
121 views•2022-05-26

6:25
Kepler's Laws of Planetary Motion Explained (Educational Astronomy Video)
@Peekaboo_Kidz
404.9K views•2023-02-17
6:10
Gamma-Ray Bursts: Cosmic Snipers Explained | Astronomy
@kurzgesagt
15M views•2016-07-31
Related Study Plans & Knowledge Roadmaps
Structured learning paths in Astronomy
astronomy
Reionization: Pop III Stars, IGM & 21cm Line
01Foundations of Cosmology & the Early Universe
02Population III Stars & Cosmic Dawn
03Physical Mechanisms of Reionization
+ 2 more learning modules
17h5 modules
Explore Roadmap
astronomy
Planetary Rings: Dynamics, Roche & Resonances
01Foundations of Gravity and Orbital Mechanics
02Tidal Forces and the Roche Limit
03Structure, Composition, and Collisions
+ 2 more learning modules
10h5 modules
Explore Roadmap
astronomy
Asteroseismology: Stellar Waves, Ages & Cores
01Foundations of Stellar Astrophysics & Wave Mechanics
02Stellar Oscillation Modes: P-modes and G-modes
03Mathematical Framework of Asteroseismology
+ 2 more learning modules
35h5 modules
Explore Roadmap
astronomy
Adaptive Optics: Physics, Engineering & Control
01Foundations of Wave Optics and Wavefronts
02Atmospheric Turbulence & Optical Distortion
03Wavefront Sensing Technologies
+ 3 more learning modules
35h6 modules
Explore Roadmap