







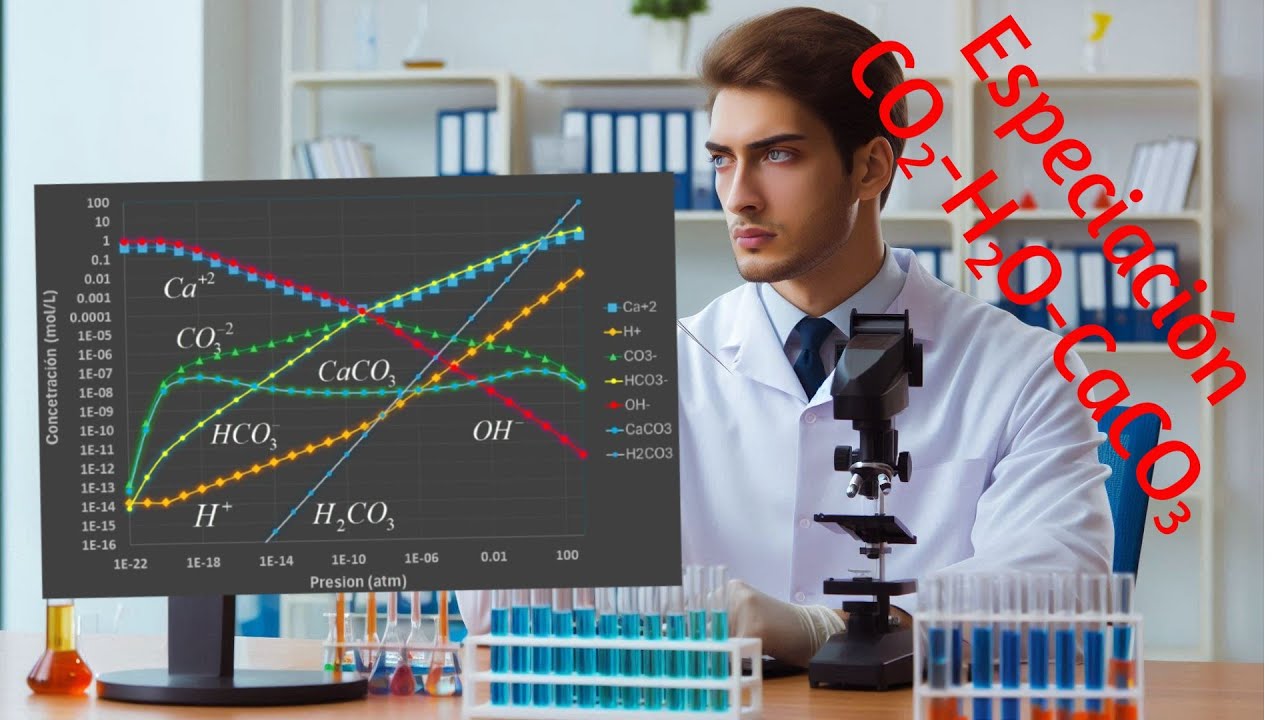









Ocean acidification occurs when atmospheric CO2 dissolves in seawater, forming carbonic acid that reduces carbonate ion availability, threatening shell-forming organisms like oysters; coastal acidification compounds this effect through regional processes such as nutrient-driven eutrophication and upwelling, with aragonite saturation state below 2 causing larval oyster mortality; NOAA provides educational resources including the Data in the Classroom module enabling students to analyze real-time ocean pH and CO2 data to understand these interconnected environmental challenges.
Ocean & Coastal Acidification: Data in the Classroom Webinar
Added:Basic chemical concepts including the pH scale, the difference between acids and bases, and chemical equilibrium.
The fundamental processes of the global carbon cycle, particularly the absorption of atmospheric carbon dioxide by ocean waters.
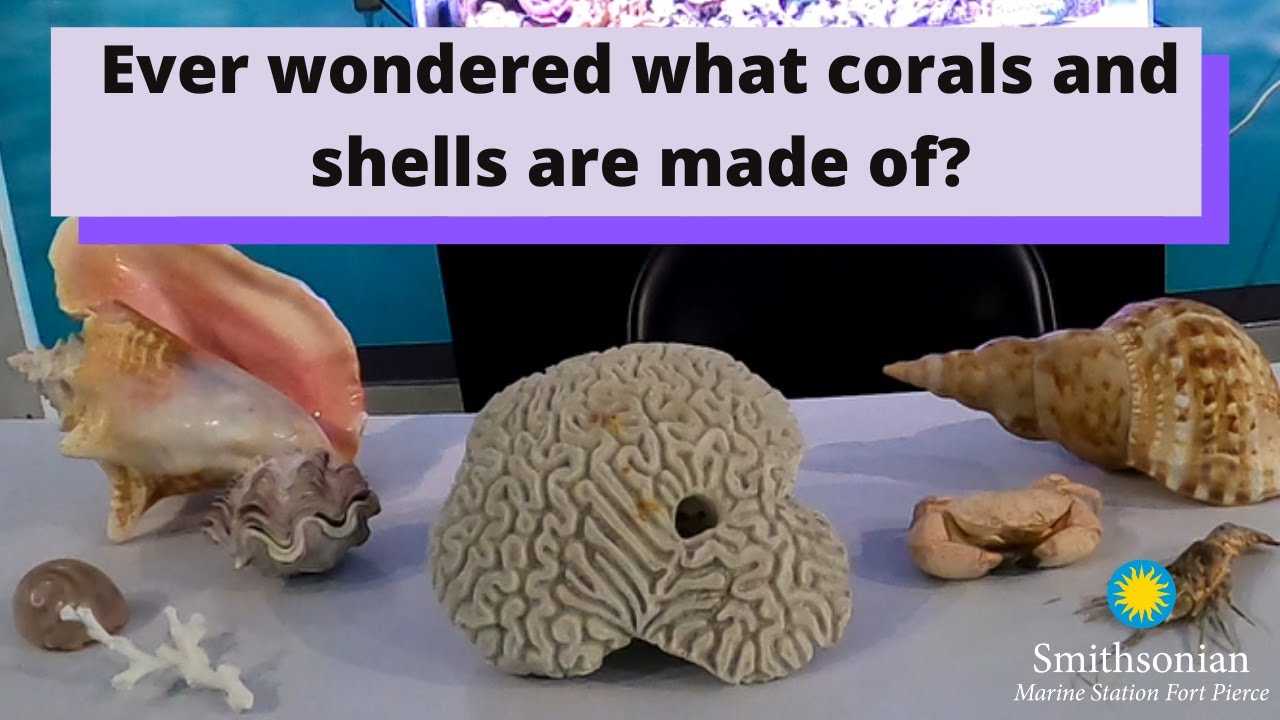
An introductory understanding of marine ecosystems and how calcifying organisms, such as corals and shellfish, construct their shells using calcium carbonate.
Fundamental data literacy, including how to interpret graphs, read legends, and identify trends in scientific datasets.
Advanced marine biogeochemistry, focusing on the specific mathematical equations governing the carbonate system in seawater.
Analysis of the socio-economic impacts of ocean acidification on global fisheries, aquaculture industries, and coastal communities.
Integration of real-world NOAA datasets into curriculum design, lesson planning, and inquiry-based classroom activities.
Investigation of localized coastal acidification drivers, such as nutrient runoff and upwelling, and the mitigation strategies used to combat them.
251 views2likes1:02:12Original Release: 2020-09-21
good afternoon welcome everyone we are so pleased to have you join us for the sharing ocean acidification resources for communicators and educators webinar series today's source webinar is presented by the noaa national marine sanctuaries and ocean acidification program really on behalf of the many offices in noaa the national environmental satellite data and information service office of education and national ocean services our goal is to provide ocean acidification communication tools to formal and informal educators and stakeholders across the country to promote a more integrated and effective ocean acidification community i'm jen bennett mintz education and outreach coordinator with noaa's ocean acidification program and i'll be moderating today's session with laura francis the education coordinator at the channel islands national marine sanctuary thanks again for being here today we've had over 275 folks register from all around the globe and we are very excited that you've taken the time to join us we would love to know a bit about how you spend your days so you will see our first poll pop up that asks um how you spend your work days so please answer by clicking on your choice you can select more than one and you can also choose other and tell us what audiences you tend to interact with or if you don't fit into one of those categories you can share that by typing into the questions box the responses are coming in we'll leave it open for just a few more moments looks like we have a great variety of folks on the line doing different things in their days okay we'll go ahead and close this poll it looks like we have as i mentioned a really good variety of people on the line there are about a quarter of you who do conduct scientific research 19 teach in a classroom 40 percent teach in an informal setting nearly 40 percent are communicating science in some way and as we see um some of the other options we've got teachers on the line some college programs and folks that work in professional development as well so thank you for letting us know that um polls are one way we will interact during the webinar during the presentation all participants will be in listen only mode and you are welcome to type just as you offered your current roles you're welcome to type any questions you may have for our speakers into the questions box shown here that's on the control panel on the right hand side of your screen we'll be monitoring those questions and we'll respond to them and post them to our speakers at the end of the presentation also we always welcome your input on who or what you would like to see as a future source webinar um speaker or topic um or any resources that you would like us to cover in upcoming webinars if you have any ideas for them for that you're welcome to type that into the questions box as well and we'll take those into consideration as we plan for the future we are recording this webinar and this session um will be shared via google drive for with all of those who registered um and we will also be eventually posting this on the noaa ocean acidifications program youtube channel so the title of today's presentation is on a scale of 0 to 14 how familiar are you with the ocean acidification facts and we are very pleased to have two presenters to discuss this with us today we have um dr kerry st laurent who's a research coordinator at the delaware national estuarine research reserve and amy dean who teaches biology and environmental sciences in the classroom and was an education lead in developing the noaa data in the classroom module a little bit more about carrie carrie is an environmental scientist with the state of delaware and research coordinator for the delaware national estuarine research reserve she holds a phd in oceanography from the graduate school of oceanography at the university of rhode island and is perfectly okay being a total science nerd she is currently the state representative on the mid-atlantic coastal acidification network steering committee and the co-lead for the national estuarine research reserve's coastal and ocean acidification work group amy has worked in science education for 20 years she holds a master's degree in marine biology and is fascinated by the wonderful and bizarre world of marine invertebrates she has been working with noaa for 15 years managing education programs designing curriculum and providing teacher training services in all of that spare time she is a full-time teacher of biology and environmental science for high school students in the san francisco bay area as a team they will be presenting both the science behind ocean and coastal acidification and walking us through a brand new module of data in the classroom that is focused on ocean and coastal acidification so without further ado carrie i am going to hand it over to you to introduce us to the science perfect and thank you very much for that introduction hopefully everybody can hear me okay and see my screen um and so i'm just gonna go on and get started um so hopefully after this short presentation everyone will come out having an idea of how climate change is connected to ocean acidification uh the chemistry behind what happens when atmospheric carbon dioxide enters into seawater some of the drivers of coastal acidification a few impacts of coastal and ocean acidification and a few glimpses into the potential future and i'll have some uh studies sprinkled throughout terry before we should we find out how familiar folks are with coastal and ocean vacation that is a perfect prompt go for it so we have another poll how familiar are you with ocean and coastal acidification science extremely familiar very familiar somewhat familiar not sure i haven't heard about it okay we'll just let the responses come in for another moment or two all right it looks like almost everyone has cast their vote but we can go ahead and close the poll so carry one percent are not sure if they haven't heard of it 50 are somewhat familiar 35 very familiar and 16 are extremely familiar i'll leave it back to you fantastic oh that's a really good spread so this is a pretty informed audience and as you can see i'm i really am playing the nerd card because i just love talking about this topic so much i almost skipped the question um so good this slide won't be controversial at all when i say that climate is changing um can't begin to talk about ocean acidification without talking about the increase in atmospheric carbon dioxide so to many of you this should be familiar this is the killing curve a scientific hero of mine is charles david keeling who uh was a scripps researcher he began measuring carbon dioxide in the atmosphere in 1956 on top of mono loa in hawaii and to this day this data set is still being collected and is the longest time series of atmospheric carbon dioxide of its kind and it has definitively shown that the carbon dioxide atmospheric concentrations are increasing at our present day they're increasing at a rate a little over two parts per million per year and that rate has increased there we go um so in red on this slide here is that killing curd of the atmospheric co2 so one thing to take note is approximately 25 to 30 percent of the carbon dioxide in the atmosphere gets absorbed into the ocean so knowing this it makes perfect sense that if you increase the atmospheric concentration of co2 you're then subsequently increasing the amount of carbon dioxide absorbing into seawater so that green line is a time series from the hawaii ocean time series program measuring the partial pressure of co2 so how much co2 is in water over time which has also increased with that atmospheric concentration and it's mirrored again by a decrease or sorry an increase i'm going to get this mixed up the whole time but it's a decrease in the ph which means an increase in acidity so this um time series has shown that the ocean is a sink for atmospheric co2 and that it's statistically significantly decreasing in surface seawater ph and i also want to note that ph is on a logarithmic scale so what this means is very tiny changes actually are really big changes and so a 0.1 ph change is what we have historically observed as a change since the start of the industrial revolution that's reflective and about a 30 percent uh increase in ocean acidity so ph i always like to remind people what ph actually is and how it's calculated it's the negative log of base 10 of the concentration of the hydrogen ion and so these are essentially protons um and on a ph scale we call neutral something with a ph of one as you decrease that number your ph becomes lower and you become an increase in acidity and just as reference ocean water mean ocean ph is around 8.1 and again that has decreased since the industrial revolution um and to further hammer this home and so while we've already observed approximately a 30 uh change in acidity many models have predicted that we are likely to see an additional ph change by 0.4 ph units by the year 2100 and this is reflective of 151 percent change and so there's a lot of very potentially detrimental uh impacts to this so let's talk a little bit about what happens when you dissolve carbon dioxide into water this is known as the carbonate system um so when you add carbon dioxide to water it combines with water to form carbonic acid carbonic acid tends to dissociate in seawater so it's going to break down into different ionic forms and so this is essentially a massive equilibrium equation so we have carbonic acid existing um also as bicarbonates i don't know if you can see my cursor but that's the hco3 negative um which also frees up a hydrogen ion and also further dissociates to carbonic acid which also frees up a hydrogen ion and so as i mentioned this is a big massive equilibrium equation when you add something like an increase in carbon dioxide you're going to get a shift so i like looking at this graph this is how my brain likes to work is as you add carbon dioxide and as you're shifting that ph to be a lower number you're changing the amount of carbonate that is present and shifting it towards having a little less of that carbonate and more of the bicarbonate and this can become particularly important for things that create shells shells are made of calcium carbonate um and this can be make them particularly sensitive as you're getting rid of some of that ion in the form of carbonate that they very much need and so what this means is more co2 and seawater is making less of that carbonate available and as you have less that carbonate available you are impeding that rate of calcification and this calcification could mean um that organisms are having a harder time building their shells it can also mean in some extreme incidences you might have a loss of shell so the last big term um that i will introduce because this is the the big one that's talked about a lot and i thought the data in the classroom module that amy will premiere uh displays it wonderfully is the saturation state so aragonite is one of the mineral forms of calcium carbonate that shell building organisms like oysters use it's often expressed as an omega and it's essentially a ratio of the amount of ions of calcium and carbonate divided by the apparent solubility product so essentially what you need to know is when this ratio is much much greater than one there is an abundance of calcium carbonate that organisms can use to build their shells it is under saturated when it is less than one which implies there's not enough of that calcium carbonate for the minerals to grow or maintain their shells and very importantly is it doesn't have to be less than one for calcifiers to experience problems so this is taken straight from the data in the classroom exercise is this is the monthly aragonite at la push which is a uh buoy that measures ph and the partial pressure of co2 off the washington coast at a threshold of the aragonite saturation state of 2 or lower you start to see oysters having trouble growing at a threshold of 1.5 you can start to absorb a larval death of those oysters sorry that is my phone ringing this is a work in progress as everyone knows we're all working for different offices um and so um as you uh decrease that saturation state you have fundamental impacts to organisms such as oysters and you can see in the present day there's already periods throughout the year where that saturation state are at these critical threshold levels and unfortunately it's projected that by the year 2100 many coastal waters off the united states such as the pacific northwest and also new england are projected to have saturation states in the surface waters below two in the pacific northwest even lower um and i just want to throw this out there as i transition to the coastal environment coastal environments are dynamic and they have changed throughout the day this is data from my site here in delaware looking at ph in a tidal creek and you can see over the course of a month and then snapshot into a single day you can get a ph swing of practically one whole ph unit um this is the day my daughter was born so that's why i picked it but it's a good example to show that organisms and coastal systems are already experiencing lots of change but where the concern is is that the lows could become lower and the amount of time in these lower ph waters could also increase so i'm going to transition to ocean coastal acidification and how it's different than ocean acidification is the coastal acidification takes all those processes that i just mentioned so that increase in atmospheric carbon dioxide increasing in the ocean and thus lowering the ph in addition to regional pressures which are affecting the local water chemistry i'm going to talk about two of the most prevalent ones there are others but the two most prevalent um are eutrophication so that's driven by nutrients as well as coastal upwelling and so the first one i want to talk about is that eutrophication so the nutrient cause crystal acidification additional pressures uh nutrients are fundamental for all life it's how we're able to exist we all depend on nutrients like nitrogen and phosphorus for our own well-being and existence so nitrogen is found in amino acids which are the building blocks of blocks of proteins phosphorus is pivotal to dna and rna so without these two nutrients nobody would be able to exist as we know it however there is unfortunately too much of a good thing when we add too many nutrients like nitrogen and phosphorus into our coastal water systems we get massive blooms of algae so these are the photosynthetic plants of the ocean they will form blooms which are just massive almost gardens of these tiny microscopic organisms unfortunately those organisms die and sink and are consumed by organisms like marine bacteria which respire so things that respire like you and i we produce carbon dioxide as we metabolize and so you end up getting this huge injection of carbon dioxide and you decrease also the amount of oxygen in that process now as we just mentioned as you increase carbon dioxide and water you are shifting that balance of the carbonate system you're taking out more of those carbonate ions you're making the saturation state become potentially lower you are ultimately lowering the ph and all of these combined effects can result in crystal acidification and of course this is amplified because eutrophication if you look it up um just for fun on your own it's most often associated with low oxygen and so eutrophication this massive nutrient pulse is associated with nuisance algal blooms because the waters can be stripped of oxygen during all that respiration you can get fish kills and again i'll stress is ocean acidification is another conversation starter for this when i was back in college we didn't talk about coastal acidification we just talked about that hypoxia that lodio but uh this has really become prevalent so the nutrient problem um comes well mostly from us there's lots of different sources of nutrients that can enter our waterways one point source way is through wastewater we also have inputs from agriculture from fertilizers and livestock fertilizing lawns nitrogen deposition from burning of fossil fuels is all sources as well as the many detergents contain phosphorus and so i like to put this slide up because it's note that human activities have caused a lot of this nutrient injection but individual actions or societal actions like not fertilizing your lawn before a big rain storm or trying to avoid phosphorus-based detergents can make a big impact and another way we can increase the amount of nutrients has been through storm water runoff um we're increasing the amount of impervious surface we have on our landscape so these are things like asphalt where water cannot permeate through it so it doesn't get a chance for the plants to use it as well i'm sure everyone on the line has experienced at one point driving down the road during a big storm and seeing these little mini rivers that form this is all water that's running down our trains going into our waterways that's been aggregating a lot of nutrients that can pulse into the system and so one non-fun fact is that we live in a very stressful world that have a lot of different things going on so we don't just have ocean and coastal acidification happening we don't just have changing dissolved oxygen during these events we have all these pressures happening simultaneously so this is kind of a neat study that showed the juvenile quahog or hardclam for non-new englanders that when you exposed it to just low dissolved oxygen waters or just low ph waters you didn't see any significant change in its growth compared to normal conditions but when you exposed it to both low ph and low dissolved oxygen waters that's when you got the significant decrease in the growth and so all these organisms are experiencing all these changes all at once and sometimes the compounding effects of these make a difference rather than just one individual thing this is very hard to measure so the second coastal acidification process that happens is by coastal upwelling and so um one this is almost a forensic case study that is a lot of fun to dig and read into starting in the mid 2000s a lot of oyster hatcheries along the pacific northwest started to observe uh larval oyster failures so oyster larvae were dying the most smallest oyster larvae were dying and it was obviously causing a lot of problems both um for the oysters but also fiscally is these industries make a lot of money for the pacific northwest and it was a big problem we now know um using our wonderful scientific expertise that the cause of these oyster deaths were from low ph water so this is where we get to talk a little bit about physics is coastal upwelling along some coasts such as the pacific northwest is a seasonal process that is experienced each year so northerly winds so these are winds that come from the north they can result in a net movement of the surface water to be away from the coast in the northern hemisphere so i'm going to show you a little bit of physics because i do have an oceanographic background and i never get to talk about the coriolis effect in delaware so the rotation of the earth applies what we call the coriolis effect so large-scale movements like winds get rotated to the right in the northern hemisphere um and so it's obviously as you um not obviously it's maybe not obvious to everyone but if you were to throw something a really far distance the rotation of the earth would move it so what its trajectory would actually land at would be not a straight line so this coriolis of force also takes effect into our surface waters and it does something called the akron ekman spiral but it ultimately produces a 90 degree net movement of the surface water to whatever direction the wind is moving so that's 90 degrees to the right in the northern hemisphere and so because the water is moving away from the coast it has to be replaced by something and it's replaced by deep coastal waters um sorry deep waters so deep waters are in general higher in dissolved inorganic carbon so this is carbon dioxide they also can be more nutrient-rich they're colder and they're going to have a lower ph uh in the pacific northwest the waters that are upwelled can be between 30 to 50 years old i read one fact somewhere that said these waters saw the fall of the berlin wall that gives any reference and so you have these waters that have been aggregating carbon dioxide they have a lower ph and because climate change is into effect that change in ph uh that change in acidity has been um amplifying as we progress into the future so the waters here were already pretty low in ph so now we have this added effect of climate change making them even lower and so this was sort of a watershed moment when um shellfish hatchery started observing these deaths related to the ph but the little glimmer of hope is it offered the chance for science and industry to become um well partnered together and the pacific northwest has wonderful partnerships working together to better understand and help even prevent some of these processes so a lot of the shellfish hatcheries right now in the pacific northwest will routinely monitor for ph there's a few buoys that are set up that they can tune into and so if they know that low ph water is present you can shut your hatchery off so that corrosive water will not enter there's also been ways to add buffers to the water to make it a little less corrosive so adding things like sodium bicarbonate or sodium carbonate i'm really intrigued with this current thought process of bioremediation and so this is in some systems planting or i guess planting seaweeds are using other submerged aquatic vegetations so these are organisms that are photosynthesizing which means they're uptaking co2 which could help locally buffer some of these effects and there is also efforts underway to develop oysters that could be more resistant to ocean acidification effects so what are some of the potential effects why do we care hopefully by now i've made it abundantly clear that calcifiers so things that make shells are particularly vulnerable and sensitive to changes in acidity so things like shellfish hatcheries which are very important industries um will care very much but there's also commercial fisheries such as sea scallops for example um in the the north east region and for anyone here who enjoys eating shellfish or who enjoys going to the beach um these are all reasons we obviously care and for mollusks such as oyster oysters these are larval oysters i think laurel oysters are adorable um it can mean that low ph water might result in a higher mortality for adults it might not necessarily mean mortality it has been shown that they grow slower but if you are spending your energy and time devoted to maintaining or building your shell you are spending less time on other key activities such as eating and reproducing so it will have other ramifications down the line and so here are just a handful of other studies that i've come across that i've found really fascinating that again show it's not just about mortality that will have effects um in the ecosystems and so uh muscles have been shown that they're bissell threads so these are those little kind of threads that allow muscles to stick to rocks under high co2 conditions those threads become weaker so one thing that is been established in the literature is for sharks and fish the olfactory systems can be impacted and so for example clownfish might have a more difficult time finding their way back to the anemone that's their home they have a more difficult time being able to follow the chemical cues off of these different um you know ecosystem types and i thought this one was very interesting as muscles lose their color under high co2 treatments there are a bunch of other really fascinating studies i didn't talk at all about corals but corals also have been shown to have a potential decrease in calcification and also be more susceptible to things like coral bleaching because we're also having warming take place so this is where i empower everyone because there is a lot of things that are not understood yet um we understand the water chemistry that's not debatable we know that when co2 enters water it does um the carbonate system breakdown but there are a bucket list of things we need to know uh the two papers that i have featured there are two papers the mid-atlantic crystal acidification network put out last year that was just establishing hey this is what we need to understand these are places we need to monitor if we need more information so all of the future scientists or current scientists um on the line here we need to know what the future impacts will be we need to know current day local and episodic acidification events and where they're occurring we've talked a lot about single organism impacts but how will that impact the whole ecosystem how are multiple stressors like changing salinities also affecting it are there some organisms that might be able to have a better adaptation there's many more things we don't know so with that um that is the end of my section um i put my email out there if anyone wants to go more into more detail about anything i showed or have any additional questions that don't get addressed here you can feel free to email me and i'd be happy to talk to you so i will send it back over to jen to transition yeah if you don't mind as we're moving on to amy and this new data in the classroom module there were a few questions that might be good to just clarify before we dive into this educational tool um so one was concentration of carbon dioxide in the ocean have a limit or is the ocean an infinite sink that is a wonderfully fantastic question that um i don't know the definitive answer to but i think that there well i that is a wonderful question but i i can say this is under our current modeled trajections to 2100 the ocean can absolutely handle the amount of co2 not for the better um so in the immediate future the answer is no but i don't know if there is a threshold i would think we might have bigger concerns if we ever hit that threshold if it exists but i'd have to follow up with that great we can do that um and one other question sort of touching back on the eutrophication piece um doesn't the formation of an algae bloom consume carbon dioxide from the water and when the organisms eventually die the respiration bacteria feeding on the dead algae just replace the carbon dioxide consumed by the algae so that there's no net change what am i overlooking gotcha that's a fantastic question of something that i didn't really go into so um thank you to whoever asked that so one of the the big processes that happens is that that algae yes they're taking up co2 but when they die they're sinking and so a lot of the respiration that happens is in the deeper waters that might not have the ability to reach that atmosphere um so we have stratification that that happens um and so it's typically in the more bottom waters of the coastal system where things like clams and shellfish often are but that's the the primary difference is it's happening kind of on the deep end of the swimming pool whereas the photosynthesis is happening at the top where it can readily exchange with the environment so it almost gets trapped um in in the water great thank you for verifying that yeah i feel like um hopefully that answered some of those science questions related to coastal and ocean acidification and we can now move on to amy's presentation where she'll be sharing about this new data in the classroom module so amy take it away okay thank you jen well i thought we would just kick off the second part of the presentation with an audience poll so actually jen i'm gonna kick it back to you so we can take the poll so amy it looks like um there has been a technical difficulty so i don't think that poll now exists that's okay we'll just move on no no big deal you all right actually my screen is not advancing um so or my presentation is not advancing for some reason here we go okay um so i wanted to start off just giving a quick background on data in the classroom i know that at least half of you guys are both formal and informal educators and uh data in the classroom was developed to help teachers bring real-time data from noaa into their classrooms so currently there are five modules on topics like el nino and coral bleaching most of these are aimed at middle school level with the exception of the ocean acidification module which was developed for high school students and all of these modules offer the same resources so that includes a teacher's guide with lesson plans the web-based student activities and access to interactive data tools the modules all have the same pedagogical approach as well so there are five scaled levels of interaction in every module beginning with relatively basic teacher-led discussions and lessons on how to read and interpret graphs that would be level one and building towards lessons that challenge students to access data themselves and investigate a question and that would be levels four and five so what i wanted to do with you for the bulk of this presentation was to explore the website and the online platform for students and complete just a few sample activities together so here we are at the data in the classroom website and first i'm going to show you some of the teacher resources these contain a teacher guide containing the lesson plans for each level that's on your left some optional paper and pencil worksheets that go with the online activities that's in the middle and alignments to high school and gss performance expectations and that's on your right so now we're going to go back and i'm going to launch the student activities and when you launch you find the guiding questions on the introductory page so in this case the guiding question is carbon dioxide in the atmosphere is rising but what does this mean for the world's oceans levels one through five contain the student activities as well as a get data tab where you can find a one-stop shop for accessing all of the data tools in the module and a page for you to download the lesson plans and the student worksheets so we're going to start with a sample activity from level one you'll recognize this graph from cary's talk showing changes in atmospheric co2 in red and ocean co2 in blue and here the goal is for the students to make a prediction about how rising co2 impacts ocean ph and depending on your class and your students they may not know much about this yet so they'll have to draw on whatever prior knowledge they have but they can also explore the information and the illustration that's accessible on this page so i'm going now to the live web website so bear with me for a moment here and so now we're on the live website and i just want to demonstrate some of the features so in the window here your students can interact with the graphs you can scroll their mouse over the data points click in the legend to turn data layers on and off and they can use the features below or above the graph to zoom in to specific time periods like this okay and i just mentioned the additional information that students can access in order to make their predictions i'm going to show you that here again you saw this in cary's talk so if they're unfamiliar or need to remind themselves about the basics of the chemistry they can check this out all right so i'm going to take us back to the presentation all right so if you are a teacher i want to point out that there are optional paper and pencil worksheets for each level so in level one the worksheets have students make written predictions using sentence starters they're sentence starting starters to help them explain their predictions as well and they also have to illustrate predictions on a graph so this is just an example of some student work here when students move to level two they'll compare predictions they've just made to real ph measurements that's shown in green and then there are questions in each level that help students identify key information and concepts from the data activities so here they are go ahead see if you can quickly answer one or both of the questions on your own and then you can see how you did okay and i'm gonna move us on into level three here students explore additional processes that can impact ocean chemistry closer to shore and they do this to begin with by running and interacting with an animation i'm not going to run the animation with you here but it does cover the two key processes that kerry talked about in her presentation both eutrophication and upwelling i'm going to take you to the data activity in this level which transports students to the coast of washington where they will get gather data from a mooring and this is one warning that noaa's pacific marine environmental lab has established in collaboration with others and there are many other moorings around the country that have similar data sets that you and your students can access that might be closer to home and you can find a link to these in the get data tab the coastal ocean ph graphs from these moorings can be a little tricky to interpret so your students are going to access them here they can open up the graph i'm going to show this to you now and one thing that you'll probably notice right away is the data has gaps um there are occasional sensor failures and the equipment is removed for maintenance during the winter months so that's one key feature just to potentially have a discussion with your students about one thing i want to draw your attention to on these graphs is that they're two annotated data points so students can scroll over these points to help them interpret the large seasonal changes in ph and what students are asked to do in this activity is to focus on the range of values over the time series and then they're asked to compare this to the range of values in hawaii over the same time period so let's go ahead and do it you're looking at open ocean ph off the coast of hawaii on the left compared to coastal ocean ph off the coast of washington on your right from 2010 to 2017.
so what's the difference in the range of values over the seven year time period i'm going to highlight the range for you with these orange dotted lines and i'm going to pause so you can take a moment to quantify the range on your own so you might have noticed that there's a range of about 0.05 ph units in hawaii from about 8.05 to 8.1 compared to about a range of 0.5 ph units in washington so from about 7.9 to 8.4 a huge difference and students should be able to conclude that the ocean ph near the coast of washington shows more variability and more extreme highs and lows and the goal is for them to identify the possible causes for these differences one thing that your students may wonder about is what's the long-term trend in ph at this site is it declining in the same way that it is in hawaii and because of the relatively short time period of this data set and the high variability it's just not possible to determine this yet as carrie said in her talk there's just a lot we don't understand yet however scientific models do show that during certain times of the year coastal ocean ph does fall outside of what's quote unquote normal so in other words seawater is at times becoming more acidic than what marine life are used to and this leads us to level four where students will investigate data associated with impacts to marine life so here we're going to pause and take our last audience poll so take a good look at the image and i'll hand you off to jen how about we um adapt a little bit and folks can take this moment to just type into the questions box what do they think these are images of we'll give you a few minutes all right got oh yes a variety of answers coming in we went from a multiple choice to many options amy some of the answers include oyster larvae plankton bivalves clams rotifers diatoms to be more specific in the plankton category and i think um oh dinoflagellates we've got some very specific plankton and potato chips i think referring and i think that covers most of what came in thank you all for for great timing well those are actually really good guesses um and the folks that were um we're guessing larval oysters you got it that's right let's see okay so this takes us into level four and what students will be doing in this um in this level is trying to figure out how acidification is impacting oysters particularly larval oysters off the coast of washington so first your students can learn or they can be reminded about how to read and interpret box plots here um and so you can see they can click on that one spot on the left hand side that says what is a box plot and they'll get a nice description of how to interpret those box plots and then they're likely need a little bit of help getting oriented to the data in these plots so aragonite saturation state is on the y-axis on the x-axis are all the observations that are binned for each month and the boxes and the whiskers show how spread out the observations are for each month so the question for you guys and for your students is do the current conditions in washington support the growth and the survival of pacific oysters and to find out we're going to go um we're going to click on the blue adjustable line and let's see hold on i'm going to take us over to the live website to do this okay so you can see that this blue line is adjustable and i'm going to take this blue line down to the 2 okay two represents the threshold that carrie mentioned and that is when aragonite saturation states are less than two larval oysters have trouble growing and building their shells so if you look at the pie charts above each month you can see when larval oysters may not have enough aragonite to grow and build their shells so for example you can see that in january 100 of the observations fall below the threshold and in november 80 of the observations fall below the threshold so seasonally especially in the winter months larval oysters are exposed to conditions that are not optimal for their growth and since i'm on the live website now i think i'm just going to quickly show you level five without doing too much more than just giving you a bit of a tour here this gives up students opportunities to design their own investigation related to soft shell clams in the gulf of maine and you'll see a map pop up here where students can access the data from hawaii washington and now the new location in the gulf of maine and then i'm going to take us over to the get data tab which has all of the data and the data tools including some mod some models that i didn't have time to show you and this is here for you if you want to develop your own activities for students and provide them with access to the data so with that i am going to wrap up and if you're interested i'll encourage you to join the data in the classroom online community by signing up for the newsletter that's on the website and then if you're looking for something shorter a short mini lesson for your students i'll really encourage you to check out this animation i just mentioned it briefly it was at the beginning of level three it can serve as a stand-alone resource for you in your classrooms it's totally interactive and you can find the whole the whole animation on noaa's ocean acidification program website and i'll end there um and happy to answer any questions from the audience thank you so much amy um i know there have been questions before we move into questions from the audience for both amy and kerry um this is being recorded um and the video and along with the pdf of both amy and kerry's presentation will be made available so you will have those as resources additionally we will be sending these urls that were shared for data in the classroom this coastal acidification animation as well when we follow up likely early next week so just to put those questions to rest so we can now dive into questions about this data in the classroom module or about some of the science that carrie presented so we know we have questions that have come in if you haven't had a chance to type your questions in you can do so now in the questions box at the right hand um side of the screen and um [Music] so this is we'll open with one that um we'll go back to uh a question about the science um just to start um that is um with more carbon dioxide going in the ocean is it more likely that more will also be mixed at the boundary layer back into the atmosphere and carry that you know that likely be a question for you sure um so i think i took myself off me so as more co2 going to the ocean so is that suggesting that some of the co2 then comes back off the ocean into the the atmosphere i think from interpreting that question that's my interpretation and if i'm wrong you can correct me whoever asked that um so there's um i think of course the ocean's variable so anything that me as a scientist likes to say is always like yes but depends so on that value of about 30 percent that is the ocean's net sink of taking in the carbon dioxide so of course the ocean can also give off carbon dioxide um in certain situations in certain places but overall the net um is that about 30 of that co2 will continuously be absorbed so um that kind of is like dodging the answer it but so there are spots where you could have biological processes that might produce carbon dioxide that might be able to come off but in in general that one-third um in terms of the crystal upwelling so as water is circulating throughout the ocean the concentration of carbon dioxide in the atmosphere is then getting pulled to those deep waters that are removed from the atmosphere they continue to aggregate carbon dioxide as things in the deeper waters are getting respired and so that's where you get a lot of that carbon dioxide accumulation and where you have that upwelling process become really detrimental because now you have waters that are very high in co2 and um are yeah okay can be additionally detrimental so i'm dodging that if you want to ask for clarification or email me um i might be able to provide more insight thank you carrie um amy i believe this is a question um that's focused on the data in the classroom module um one was is there any um i know you pulled out some of the buoys that were working are any of them in the alaska region or arctic i would have to check to be sure but um i from from what i remember um i believe that there are yeah great okay thank you so um and i know a few more questions are coming in um we will provide the information about getting on to the noaa data in the classroom listserv and all of that afterwards also other folks are sharing some resources that they found helpful in teaching about ocean and coastal certification which we welcome please go ahead and email those to the email noaa.oceanacidification noaa.gov and we will add those so that all the participants that joined us here today can have access to those um and yes this will be posted on the no ocean acidifications program youtube channel as well so you can tell carrie and amy that people are hungry for this information because and will use it because they are wanting to know that they can refer back to it and look into it as they incorporate it hopefully um in their classrooms or in educational settings so um getting back to some of those content questions um another one um uh we'll go back to the science so are there estimates of the impact of submarine groundwater discharge on ocean acidification how much can blue carbon sing such as seagrass meadows handle um great so i'll take that as as two questions so i i don't know the answer to the submarine groundwater question but i know that there are papers that are looking to address and or model that question um so if there's digging to be done there is somebody who is also asked that question and is actively trying to to find some of the answers for that um so for blue carbon so for anyone who's not familiar blue carbon is the term used for the amount of carbon that can be sequestered and stored by coastal ecosystems so these are tidal wetlands mangroves and submerged aquatic vegetation um and are a great potential opportunity to be able to um preserve our wonderful natural coastal environments while being able to sequester carbon dioxide um and so those are by nature coastal systems um they can already right now sequester and store a lot of carbon there are ways to increase the potential for them to store carbon where i often like to look at the picture is losing wetlands losing mangrove forests which i know depending on where you are they're increasing on tidal wetlands but the loss of these blue carbon habitats to me is what's detrimental because that's a loss of a sink for these carbon dioxide um processes and a potential re-release of some of the already stored carbon and so that's my first thing is it's more of making sure we're not losing that benefit and then looking at opportunities to increase the amount of carbon so the the last tiny thing i'll put in for a lot of these systems it's more looking at taking out the atmospheric co2 um or minimizing the amount of you know nutrients also that can be injected into the environment um one of the ways to do that is looking at changes of salinity and different methane so going into a whole another gas and optimizing or decreasing methane outputs from tidal wetlands by increasing salinities for certain managed pawns um so the answer is blue carbon is a great tool but where i personally become more concerned about is losing that tool rather than necessarily having it be what can solve all the problems thank you carrie um amy going back to data in the classroom um somebody would love to know what background do high school students need to handle the data in that module chemistry math biology great question so i teach environmental science and biology i would use i would feel comfortable introducing this with my students and of course they'll need a little bit of of help with the chemistry if they haven't taken chemistry yet but they certainly are able to handle it just by using some of the resources and the schematics in the module i think students are perfectly able to to get the basics behind the chemistry um so i would say any level in high school would be appropriate great thank you amy um one other question uh related to probably not just this module but um in large amy do you know of any other topics planned for this module or others in data in that classroom that's a great question i can't answer that at this time there's uh there certainly are ideas out there and if you have specific ideas the folks in the audience send them our way and we'd love to hear from you yeah great thank you and i think this is a great one um just being mindful of time we'll wrap up on and i think you possibly can both speak to it um mention you mentioned in some ways um people impact postal acidification such as fertilizers burning of fossil fuels do you have meaningful specific stories or examples of ways students can mitigate coastal or ocean acidification i can speak to that in regards to the noaa's ocean acidification programs animation that i referenced in my presentation so the animation spends the first part of the animation spends time connecting students with the science of coastal acidification and then the last piece is very interactive and it helps with exactly that talking about how students can mitigate what they can do specifically great and so oh sorry i'll also echo what amy said is i think that module um did a really good job at showing some of the individual changes that we all could make to reduce the nutrients of concentrations i know from for me is i try my best to use detergents and things that don't contain high amounts of phosphorus i know that there are a lot of um products that used to contain a lot of phosphorus that aren't available anymore because of these environmental concerns so this is my small story that i'll tell is about somewhat of a geologist we use um products to disaggregate clays in some of our sediments when i was a grad or an undergraduate student we used calgon the powdered bubble bath to be able to disaggregate clays to make it easier to sieve them this last summer i had an intern and i told her go get calgon it would be great and apparently that product is no longer available because it was detrimental to the environment and so that was a watershed moment for me being like oh this is great that this product's no longer available but also now i have to buy it through fisher scientific um and have it be much more costly which is fine but that that was something that caused me to realize that i was doing things that were potentially adding uh pollutants through nutrients into the environment um but there's also to make the biggest thing for our buck it's looking at things that we can all do societally um and so um looking at upgrading wastewater treatment plants to have tertiary treatment opportunities or not to have combined seward overflows happen as often and so those are things that are maybe beyond our individual control but societally potentially on the table great thank you so much amy and carrie thank you for the excellent presentations i know it has sparked a lot we've gotten some great thank yous and ideas sparked and great conversation in the in the chat box so um thank you so much for for that thank you to all of you who joined us um we really appreciate it and yes the thanks are just hollering out um so as i mentioned um this the pdfs um along of the presentations of kerry and amy's presentations along with the video of it will be shared early next week so you all will get access to that we will also in our follow-up email that you will receive tomorrow we'll get all of the links for the noaa data in the classroom how do i join the listserv where was that coastal certification animation all of those links that were mentioned will show up arrive in your inbox tomorrow and um and i encourage you all we've had some great you know this is this is what this webinar series is intended to do is build the ocean acidification education community and i know a lot of you have great resources you use so please email those to either myself or laura or the email that you got this registration link from so that we can add those we have a whole list of resources that we make accessible to folks who participate in this webinar and also add them to the no ocean acidification program website so please share those um yeah and thanks again carrie and amy for excellent presentations um we will uh potentially have our next webinar in late spring and you can um check out the source website for those and uh here is the data in the classroom link if you want to dive in if you're excited you can do that now and i think with that one more thanks carrie and amy for sharing your time your expertise your energy to all of you who joined us and the great questions and ideas that were shared and with that we will wrap up and hope you each have a great day
Up Next
12:55
Dungeness Crab Economics: Oregon Fishery and Climate Change
@OPB
357.8K views•2023-01-20

12:54
Triumph of Orthodoxy Icon: Byzantine Art & History Explained
@BenCallan
2.1K views•2024-08-06

9:49
FastAPI vs Flask vs Django: Choosing the Right Python Web Framework
@TechWithTim
302.5K views•2024-05-26

1:42
Game of Thrones Opening Credits: A Cinematic Analysis
@gameofthrones
46.3M views•2011-04-18
Related Study Plans & Knowledge Roadmaps
Structured learning paths in General & Interdisciplinary Studies
general-studies
Elevator Engineering: History, Physics & Cities
01From Hoists to Safety Brakes: The Dawn of Vertical Lift
02Hydraulic vs. Traction: The Engineering Physics of Elevators
03Modern Speed, Safety, and Algorithms
+ 2 more learning modules
12h5 modules
Explore Roadmap
general-studies
Rubber: Material Science, History & Geopolitics
01Origins of Natural Rubber & Mesoamerican History
02The Chemistry of Natural Rubber & Vulcanization
03The Geopolitics of the Rubber Boom & Colonization
+ 2 more learning modules
12h5 modules
Explore Roadmap
general-studies
Containerization: Evolution, Logistics & Trade
01Ancient Trade & Bulk Cargo: Amphorae to Barrels
02The Industrial Revolution & Cardboard Packaging
03The Containerization Revolution: Malcom McLean
+ 2 more learning modules
12h5 modules
Explore Roadmap
general-studies
Textile Tech: Evolution, Labor & Global Impact
01Pre-Industrial Textiles: Handloom & Cottage Industry
02Mechanization: The Spinning Jenny to the Power Loom
03The Factory System & Global Labor Transformation
+ 2 more learning modules
10h5 modules
Explore Roadmap