




























The cosmic redshift is a key evidence for the expanding universe, discovered by Edwin Hubble in 1929, which shows that galaxies recede from us at speeds proportional to their distance (Hubble's Law: v = H₀ × d), demonstrating that space itself is expanding rather than galaxies moving through space, and this expansion implies the universe began approximately 13.7 billion years ago in a hot, dense state.
Cosmic Redshift: Hubble's Expansion Evidence Explained
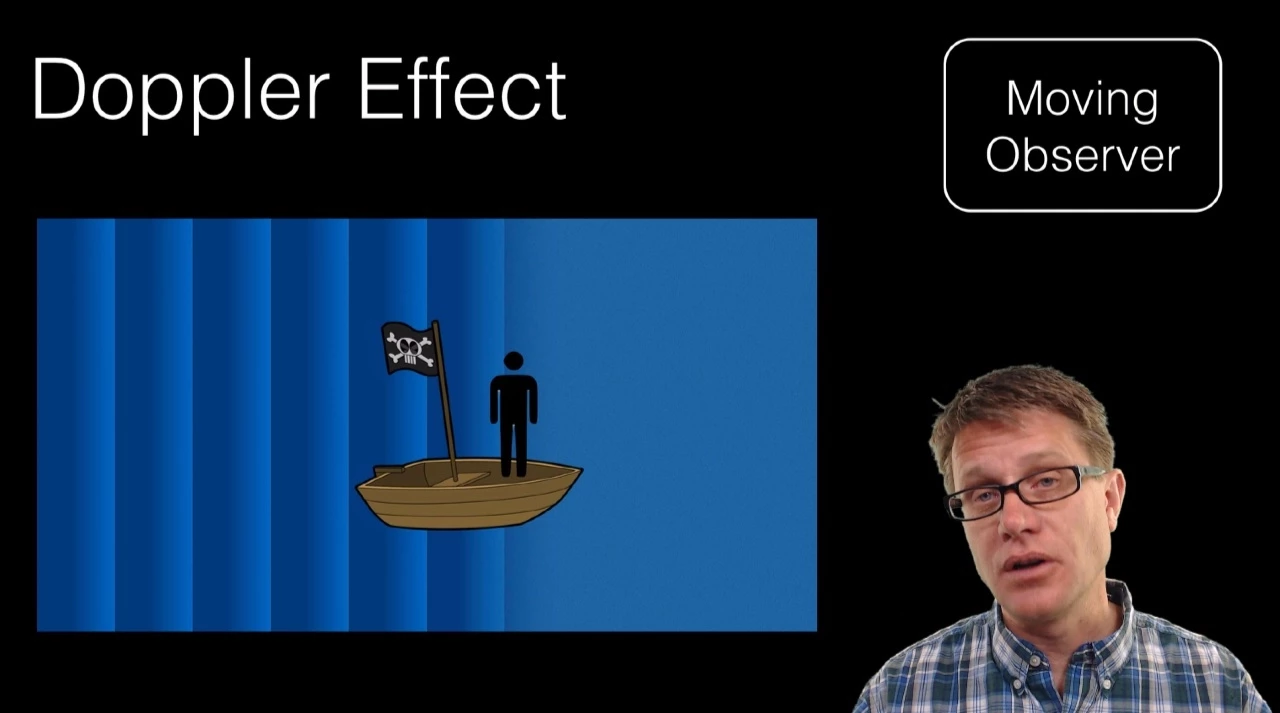
Added:The Doppler Effect: Understanding how relative motion affects the observed frequency and wavelength of waves (such as sound and light).
The Electromagnetic Spectrum: Familiarity with the properties of light, specifically how wavelength correlates with color, where red represents longer wavelengths and blue represents shorter wavelengths.
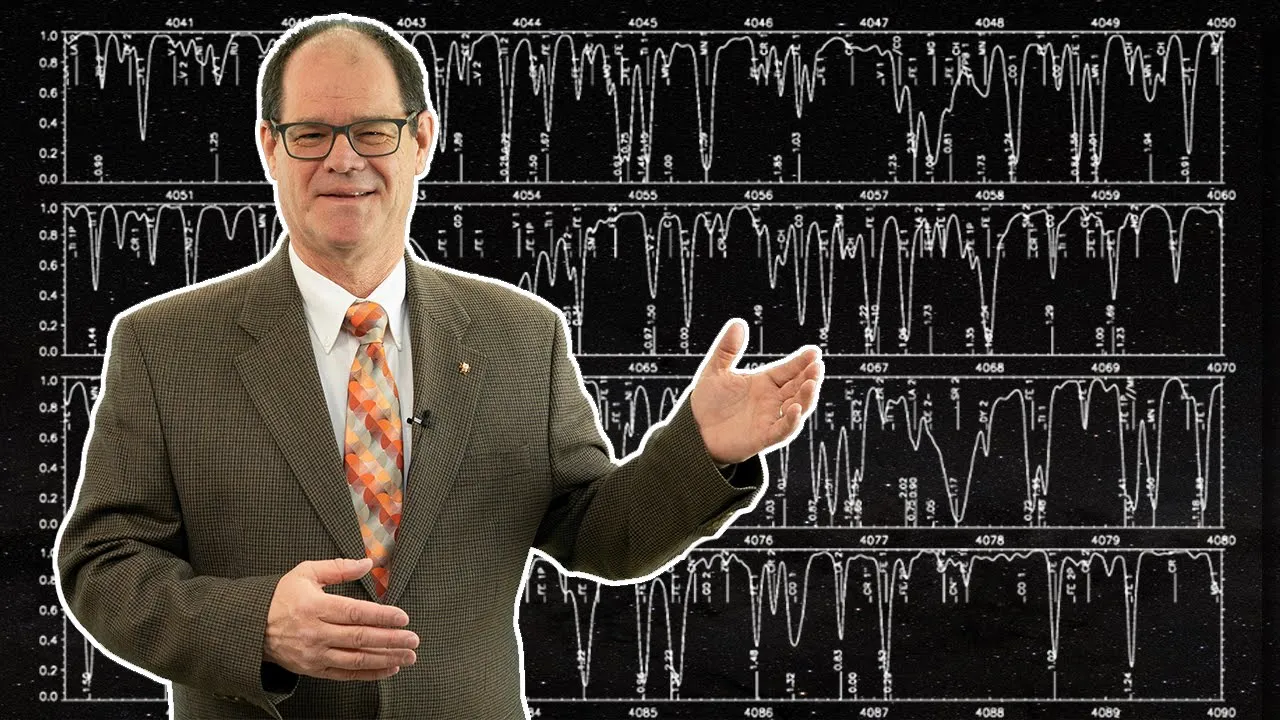
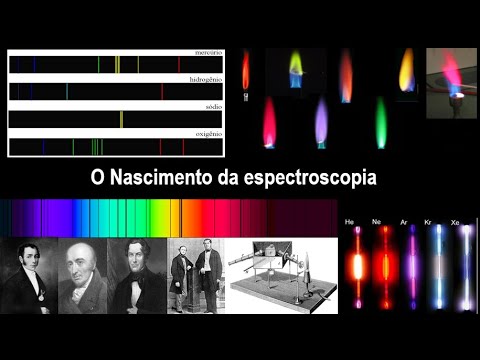
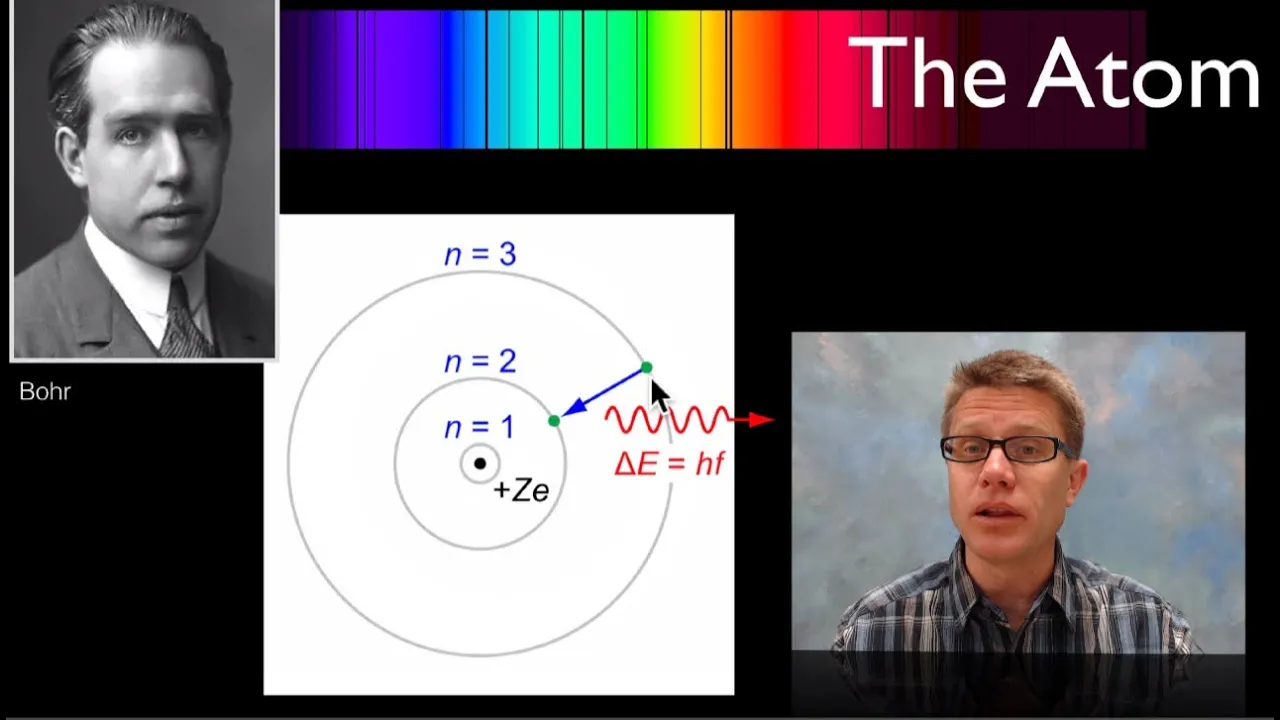
Spectroscopy and Spectral Lines: Knowing how astronomers use absorption and emission lines in starlight to identify chemical elements and detect shifts in spectral patterns.
Basic cosmological models: A foundational awareness of the Big Bang theory as a scientific model for the origin and history of the universe.
Hubble's Law and the Hubble Constant: Formulating the mathematical relationship between a galaxy's distance from Earth and its recession velocity.
Cosmological Redshift vs. Doppler Redshift: Differentiating between redshift caused by physical movement of an object through space versus the stretching of space itself under General Relativity.
The Cosmic Microwave Background (CMB): Investigating the thermal leftover radiation from the early universe as primary supporting evidence of the Big Bang.
Dark Energy and Accelerating Expansion: Exploring the discovery of the accelerating expansion of the universe and the mysterious force driving it.
The Fate of the Universe: Analyzing potential cosmological outcomes such as the Big Freeze, Big Rip, or Big Crunch based on expansion metrics and critical density.
4.1K views122likes1:19:27Original Release: 2023-10-12
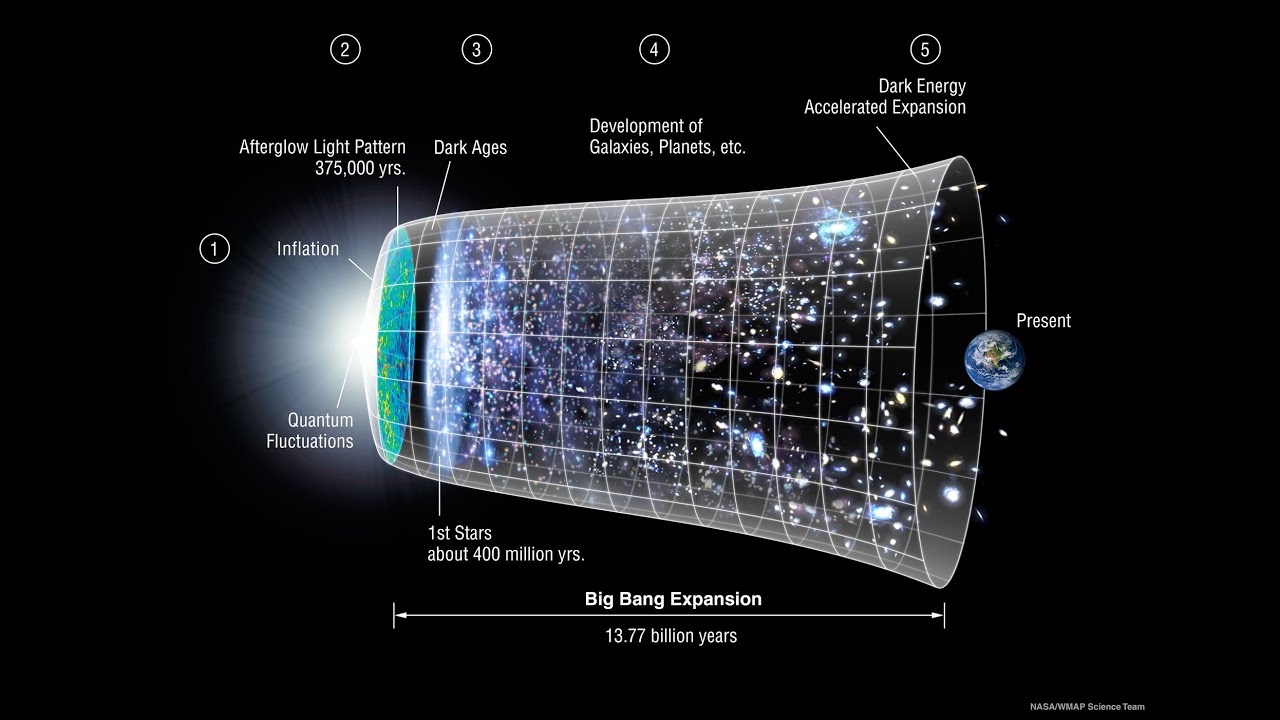
hi this is Jason Kendall welcome to the next of my introductory astronomy lectures today we're going to be talking about the big bang and specifically red shift last time we looked at Edwin Hubble's Amazing Discoveries about the nearby galaxies and we're going to extend that into his discovery of the cosmological red shift distance relationship the cosmological red shift is one of the key pillars of big bang and the cosmology itself it demonstrates just left the cat out of bag that the universe is expanding we're going to look at the evidence of the red shift and why we treat that evidence as supporting the expanding Universe once again cosmology is the study of the entire universe and everything in it and what it's going to do how it moves its origin and its fate next we're going to utilize an incredibly important idea that is the Cornerstone of the entire study of astronomy the cosmological principle the cosmological principle states that on the largest Cosmic scales the universe is both homogeneous and isotropic this means there's nothing special about our location in the universe other than the fact that it's where home is homogeneity means that the distribution of things is smooth and regular there could be an overall pattern but it must be continuous and unchanging in space so a perfect brick a brick wall perfectly laid out is homogeneous in this regard it's all brick and the individual bricks are arranged and stacked in roughly the same way and they all have roughly the same size or range of sizes isotropy means that everything is observed to be roughly the same in every Direction in the brick example if you're right up next to the brick wall looking around its surface because of how the mortar is laid out between the bricks there are different kinds of views in different directions they might seem to repeat so not every angle of Direction looks the same isotropy takes this further stating that there is no preferred Direction in the universe that is from your current location no matter which direction you look the universe will look the same in our brick example this would only work if the wall were one big brick with no mortar between the bricks for the universe if you take a big enough sample you see roughly the same numbers sizes and counts of galaxies in each Direction that's isotropy we say that the universe is isotropic around any point in the universe and of course in particular around us which is supported by the observation homogeneity means that there's no preferred location in the universe that is no matter where you are in the universe if you look at the universe it will look roughly the same right around you and be made of roughly the same things however red shift results results from the recent red shift survey such as the Sloan digital Sky survey on the right and the 2df red survey on the left of the distribution of relatively nearby galaxies seem to imply that the Universe isn't homogeneous and isotropic in other words the galaxies in One Direction are not seemingly distributed in exactly the same way as galaxies in another Direction but the galaxies that are investigated in these two surf face only extend out to Red shift about 0. 2 which is equivalent to a distance of only 750 Mega parex Million Parx we'll get to that red shift what that means soon when we study the most distant objects we find that at much larger distances from the earth the structure appears to smooth out and become more homogeneous on the largest size scales for example all Sky surveys of the positions on the sky of objects detected by radio telescopes reveal a much more uniform form appearance the objects seen in radio surveys are mostly expected to lie at higher red shifts than the galaxies seen in Optical light as shown here this suggests that when we consider the largest distance scales the universe appears to be homogeneous and isotropic thus we currently find support for the cosmological principle in the distribution of galaxies in the universe furthermore if you combine the observational evidence for homogeneity on the largest size scales with the argument or even assumption that the laws of physics are the same everywhere implying there's nothing special about what's going on where we are or anywhere else the isotropy as seen at one location means isotropy at all locations in the universe if you have a homogeneous Universe from physical law arguments or radio Galaxy surveys and you have isotropy about one point I.E our home then you have isotropy everywhere NN the universe looks the same everywhere and is made of the same stuff that no matter where you are you're going to see almost exactly the same things this of course doesn't apply to time things do look different long ago than they do today this is very important and I'll use this observationally supported idea to make an astounding claim at the end of this video in a previous video I talked about the great distance debate in the early part of the 20th century it was solved by Hubble in 1929 when he determined the distance between the Milky Way and the Andromeda galaxy as well as the the distances to some other spiral nebula which is what they were called at the time let's do a quick review of a couple of galaxies m81 and M82 m81 is the spiral on the left and M82 is the smudge on the right with the little red bits going through it before 1929 no one knew nobody knew how far away these nebuli were all such galaxies were thought to be star forming regions or planetary forming regions or something like that or perhaps even just big clouds of swirling disrupted gas when looking at the images taken at the time the confusion is easily forgivable an image like this which was taken with a modern backyard Observatory by Johanna shedler in Austria demonstrates a huge amount of detail back in the 1920s astronomical imaging was in its infancy today we know these are a pair of interacting galaxies about 12 million light years away each composed of about a 100 million stars it all begs an important question how exactly do we know the distance to these galaxies what put the great distance debate to bed and finally showed us once and for all that these spiral nebula were in fact well outside the Milky Way in other words it's all very pretty and all that but how do you know how far away they are between 1912 and 1917 prior to Hubble's Discovery vestos slier at the LEL Observatory was able to measure the Spectra of about 25 of these spiral nebula these Spectra were used to get radial velocity for these 25 galaxies 21 of them showed a red shift with some high speeds as up to 1,000 km per this red shift if interpreted as a Doppler shift showed that galaxies are rapidly receiving his paper discusses this process in the difficulties and I put some edges at the top and right in the middle there that's the the table of his of his Galaxy measurements as SE as published in April 1917 however he didn't have distances to these things these nebula but he knew he was on to something very important it was just that he didn't make the cosmological connection to the distance unfortunately for him L Observatory had no way of Imaging the galaxies in enough detail over long enough periods to begin to do any kind of distance measurements and he stated this unequivocally saying this is the soall island universe theory which regards our Stellar un Stellar system in the Milky Way as a great spiral nebula from which we see within this Theory it seems to me gains favor in the present observations it is beyond the scope of this paper to discuss the different theories of the Spiral nebula in the face of these and other observed facts he just didn't have the information on distance in order to continue this and this was his concluding paragraph then in 1929 Edwin huble who you see pictured here finally measured the distances to a few galaxies including M31 the Andromeda galaxy m33 and other local group galaxies he did so using what's known as a standard candle or something that has a known Luminosity or energy output if you measure the brightness of something at some distance for which you know the Luminosity then find another of the same thing but the second one is farther away then it'll be dimmed by the distance squared Hubble set out to compare the distances with the recession velocities and subsequently found that the session velocity is larger if the Galaxy is positioned further away this was understood after much debate to mean that he had found the systematic expansion of the universe this is a really big Discovery in fact it's one of the most important discoveries of 20th century science it changed the nature of the study of the universe it was the beginning of our journey away from learning about the story of the origin of Universe from stories told in ancient books to cosmology being a Precision science and that's where we are today almost a hundred years later how far is the Andromeda Galaxy from the Milky Way that was the question of the 1920s how did Edwood humble accomplish this feat and what were his standard Candles there were the seid variables whose light curves had been extensively studied by Henrietta Swan levit levit studied variable stars of the M small and large melenic clouds as recorded at photographic place taken with the Bruce astrograph at the boen station at the Harvard observatory in Peru she identified over 1700 variable stars in 1908 levit published the results of her studies in the astronomical Observatory analog Observatory animals at Harvard College noting that the brighter variables had a longer period of variation in a 1912 paper levit examined the relationship between the periods and the brightnesses of a sample of 25 of the seates variables in the small melanic Cloud she determined conclusively that there is a simple relation between the brightness of the sepid variables and their periods we discriminate between all the various kinds of variable Stars by looking at how they get bright and dim with time seids first are extraordinarily luminous stars second their light curves have this distinct shape with periods of oscillation on the order of tens of days Sapp variable Stars can get you the to an object in which they live now we just need a good handle on the red shift these Peaks follow an important pattern most importantly Lev found that the Luminosity at the peak brightness is tightly correlated to the time between successive Peaks therefore if you can find some bright stars and hope they aren't one-off Novi then you can return night after night to get the period of brightness of variation once you've determined that period Then you know the Absol abute magnitude of the star at the peak brightness once you know that you compare it to its apparent magnitude and use the distance modulus equation which I described at length in the previous videos in the series to get the Stars distance but basically if the seiad happens to live in a distant Galaxy then comparing nearby seid's brightnesses with the distant ones will give you the distance so Hubble's plan was to look for sephi in M31 and other galaxies and use the levit period luminos City relationship from the Milky Way seats to get the job done luckily these stars are so bright they can be picked out in the relatively nearby M31 at the Andromeda galaxy so Hubble went off to find those Stars by taking photographic plate images of M31 and m33 and was rewarded with a bunch of candidates as we can see from this photographic plate of M31 from October of 1923 Edwin Hubble first spied the star in a 45 minute long exposure he taken early on October 6 1923 with Mount Wilson's 100in telescope hubbles had spent months trying to determine the distance to M31 to see if it and other such controversial spiral nebuli were distant parts of the Milky Way or instead distinct quote Island universes he'd initially marked the three stars on this plate with n thinking they were Novi but when he cared compared his plate to earlier exposures he realized that one of the three was actually variable so he crossed out the end and excitedly pinned quite clearly Mar next to it here's another one of his plates for the Galaxy m33 another nearby Galaxy which is a which is really just the big smudge in the middle from 1926 as published in the astrophysical journal you can see how we marked up a series of seied variable stars for observation and followup notice that this plate is negative as was as is a common convention for publishing results so the stars look black and the sky looks White and the Galaxy is that big cloudy fuzzy thing in the middle numerous followup observations revealed the periods of these seate variables each dot on this curve represents a separate 45 minute exposure of that Galaxy a light curve was fitted to the observations likely each of the four candidates that you see here was observed on the same photographic plate on the same run but things can go wrong with such photography and these light curves are folded to stack onto the light curve it's not like they began measuring before Day Zero and it's only two peaks it's many many many days and this is convoluted and folded to find this pattern you can see in the saw too patterns of these four variables which are indicative of sured variability Hubble then went on to make these radial velocity measurements he did this for a number of galaxies using the same processes that vestos slier use however he used the 100in telescope on Mount Wilson which was the most important important telescope of its time just like the Hubble Space Telescope and James web Space Telescope are today incidentally Hubble's observing partner Milton humson was actually one of the mule drivers who helped bring the 100 inch mirror all the way up Mount Wilson in California he dropped out of school and had no formal education past the age of 14 and he loved those mountains and found a job taking materials and Equipment up to the mountain while Mount Willis Observatory was being built in 1917 he became a janitor of the observatory and just because he really loved it he volunteered to be a KN assistant at the observatory his technical skills while doing the work were rewarded by George hail who was the director of The Observatory who hired him onto the staff in 1919 humson then became one of the greatest observational astronomers of the time he and Hubble would stay up all night with the telescope taking the Spectra of these distant objects getting just one Spectrum would take between 30 and 50 hours of exposure to collect enough light to find the Spectrum this meant that the same photographic spectral plate had to be taken out of the telescope every night at the end of the session and put back into the telescope before starting this would be done over many nights to build up enough exposure to catch the faint light from these gargantuan distant objects to make this process even more painstaking the Galaxy would have to be centered in the telescope the telescope did have tracking but it wasn't sufficient for their needs hson and H continuously peered through a centering eyepiece at the base of the telescope to ensure that the tracking was perfect this extraordinary process took a very long time to create the data that you see on this image for reference the top one NGC 221 is a satellite elliptical galaxy of M31 the Andromeda galaxy NGC 4473 is an elliptical galaxy located about 50 million light years away to the constellation comma barones NGC 379 is a I galaxy in the constellation Pisces his quote of seven megap Parx from the second one or 7even million L years is off from today's Reckoning his distance measurement put all these as Too Close compared to Modern measurements but that's not really the point the point was at the time these were just being discovered to be outside of the Milky Way and this is what the whole Cosmic distance debate was all about which I discovered in a previous video now let's look more closely at just one of those observations so that we understand what's going on what we're looking at we have a series of lines and we're going to call them the calcium H and K lines these are the tiny dark spots in the middle of the smudge in the middle of the image with surrounded by a red circle I've also lined them up with a red arrow going up to Lambda knot and that's what I'm calling the calcium H and K line there's also two yellow arrows which indicate reference refence Spectra the reference Spectra was probably going to be something like a um uh such as such as a reference lamp like maybe iron carbide vaporous iron carbide a very hot iron carbide thing which is vaporized which then glows and emits this very particular light the Galaxy spectrum is in purple and is the smudge that's the real data the things on the left and the right are references such that you can actually make a measurement of the wavelength the reference lamp is a known wavelength set because you know the elements carbon iron carbide or whatever they were using and put that down and say this is the wavelength of those light and then you put the Spectrum in between it of the Galaxy and then you check again if you look at calcium and look absorption of calcium and you have a list of lines a list of Spectra including vaporized calcium you find in table that there are wavelengths According to which which have have been named H and K in terms of calcium that's what their names are it's just a little list in a book saying oh if we vaporize calcium and heat it up we get a whole series of lines and one of them we call H and the other one we call K and they're very prominent and the little red circle shows them but the reference lines show that they have been displaced from their rest wavelength and the rest wavelength is that Lambda sub e Lambda sub is where they would be naturally in the laboratory and I've indicated with a blue line where that should be and the little white Arrow shows how far off to the right or to the red these wavelengths of Light have been displaced so that's really interesting and we'll continue on a bit we'll talk more about that later and how that comes about so all these galaxies were used or at least their Spectra can be best measured because of that strong absorption feature or kn& in these things as well they're all the same process something is doing k&h absorption the Purple Line crossing all the Spectrum arcs the rest and lab wavelengths for the calcium H&K lines Galaxy Spectra like these are typically characterized by a strong Continuum component which is the smudge going across the middle not the reference little tick things this is caused by a combination of a range of stars spanning a range of temperature they all combine together in that Galaxy's light to form one Spectrum which is fairly flat overall the H&K absorption lines are superimposed on top of this spectrum on top of this continuous spectrum and are due to the absorption of atoms which are called Metals in astronomy speak and molecules in the atmospheres of stars and to cold Interstellar gas clouds that siphon off the radiation at these specific frequencies this implies that there's a presence of old Stellar populations which are typically found in elliptical galaxies and in the bulges of spiral galaxies we understand that these kinds of galaxies have the same kinds of stars that the Milky Way does and the absorption features are therefore due to the same kinds of processes that we see locally and in the laboratory and they're not different processes that act on different wavelengths therefore the absorption features that are seen in these images are red shifted and the red shift is the red arrow pointing to the right and the resultant location of the H and G lines is inside each of those circles again we're using the cosmological principle to state that there's nothing special going on anywhere so that the H and K lines are formed at the same wavelengths in the same kinds of stars and the same kinds of nebula and also if we're looking at the Galaxy shape we see that the farther they are the more the smaller they appear to be this shape difference assuming they're roughly the same size combined with the distance measurements seem to indicate that the radial velocities do increase the farther away the Galaxy is located now let's rotate this little diagram to help us understand even better the Spectra that were taken by Hubble look to be in black and white sometimes it's helpful to remember that the Spectre are seen By Us in bright light to be a rainbow Spectrum now if the top spectrum is stationary and the bottom one is rushing away from us extremely fast and then when we measure the rushing one we find that the lines are displaced from their laboratory wavelength to longer and redder wavelengths this is called red shift okay so let's take a moment to reflect that this didn't have to be this way we can make all sort make up all sorts of fancy ideas science fiction pure speculation Wild word strings based on a jargon generator nature could have surprised us in a lot of ways but this surprise is a doozy it was a shocking discovery that nearly every Galaxy is rushing away from us one red shift is an observational Discovery it is nearly Universal across all galaxies it didn't have to be this way this was a discovery and fourth this was extremely important we'll now look at Hubble's Law and show how it arises from the relativistic theory first let's define the idea of red shift red shift Z is a unitless measure of distance not distance is a unitless measure of the difference between the observed wavelength of light and the emitted wavelength of light divided by the emitted wavelength basically a measure of how much the light has been stretched or compressed from its original emitted wavelength now if we arrange the equation to help us with some things later again the red shift Z is the ratio of the change in the wavelength of a moving Source compared to its wavelength at rest this isn't observable we just have to know the wavelength of the light when it's emitted that's why we really depend on the physical laws being the same everywhere in the universe if it's not moving away then the red shift is defined to be zero so now I've added some Physics on the right is the special relativistic formula for the Doppler shift due to the emitter and observer being in relative motion towards or away from each other doppo shifts are more familiar when car speeds by you with a blaring siren the pitch goes higher as it approaches and it goes lower as it goes away this formula takes into account the first postulate of special relativity that the speed of light is always the same for all observers to get more about that please go and watch my series on special and general Rel activity suffice it for now that the big square root is the fully relativistic way of writing the Doppler shift again this is experimentally verified as well as originating from a General theoretical principle the rest wavelength meaning what we would measure if the thing emitting the light we're just sitting there of something emitting a pretty shade of green at 5,500 angstroms is given by that Lambda sub emit Lambda sub OBS means The observed wavelength with v meaning the speed of recession or approach of the source emitter to The Observer and C is the speed of the wave here the speed of light this formula applies to all sures moving with respect to any receiver when we're talking about light let's make things easier on ourselves and note that all the reference spectr we looked at before were speeding away at speeds much less than the speed of light this is helpful not just in the math but in helping you understand it so that big square root can be approximated by a much simpler version so now we see the relationship between red shift and the recession speed for slow speeds but it looks like a mess if you look at both ends we see that we can can reduce this down even more and now we have the final form for our relationship we haven't removed the wavelength observations they are represented by the Z now when Hubble and humson did their measurements they assumed it was a Doppler shift and got that Z Now with both of these measurements a distance from the seats and a recession speed from the redshift Hubble plotted his data and discovered this relationship for all of these galaxies this is Hubble's actual data from 1929 from it he derived a best fit value for the relationship which looks like the solid line the slope of that line that Hubble derived was 500 kilom per Mega Parc which is much larger than the values understood today so that's it Hubble's Law directly relates two observable measurements one from radial velocities in the Spectra and another by understanding Stellar physics and knowing various standard candles combining these two things together you can measure the distance to some unknown Galaxy by getting a radial velocity alone often times it's very hard to pick out a seid in a distant Galaxy or wait for a supernova but Spectra are easier to measure therefore it's important to discover more standard candles and get finer and more precise radio velocities arguably the second thing is easier of the two our faith in the fact that the physical laws of the universe are the same everywhere leads us to trust this distance rship relationship as real the main result is that more distant a galaxy is the faster its recession velocity Hubble's original value of 500 kilometers per second per Mega Parc is a lot bigger than we know it is to be today but that was due to some calibration errors in his work those errors don't invalidate the conclusion only the rate of expansion you'll often see H subot called the Hubble constant but it's really not Hubble constant is the value of the slope of that line at the present Cosmic time in the past it was different and it will be different in the future so its best name is the hule parameter H knot is measured today to be about 72 kilometers per second per Mega Parc and if you measure with the most if you measure with most standard candles however it's 68 if you derive it from cosmic microwave background measurements more on that later the obvious goal is to then obtain distances to galaxies to indicate our atttention let's invert this equation to obtain the distance as a function of red shift for relatively nearby galaxies here again Z is the cosmological red shift Z is the speed of light it gets more complicated for extreme distances in look back times as we saw with the original dopa formulation a few slides back H KN also measures the expansion rate of the universe we'll show you why it does that shortly but to Across the story for Skeptics in 1931 Hubble and humson followed up with measurements of farther galaxies and groups of galaxies the relation ship held for much more distant objects these observations are what finally ended the Great distance debate about the size of the universe it was no longer just the Milky Way it was the Milky Way plus lots of other things that seemed to be the Milky Way at very great distances this was a hot topic of debate prior to H's work whether the universe was just the Milky Way or if there was anything beyond I did a long video on this amazing part of Science History and you should go check it out note that their data was from just two years prior makes up only the tiny corner of the newer data and this was just the beginning here's a Hubble diagram from 2004 that shows the relation out to about 650 megap Parx the standard candles here are type 1 a sovi and were derived and measured by Robert Kushner at the Harvard Smithsonian Center for astrophysics they were critical in letting us know that the Hubble parameter has Chang with time these specific type the standard candles more on that in my video on dark energy cosmology the slope of this line is roughly 72 km/s per MEAP Parc way down in the lower left hand corner marks the span of Hubble's original diagram from 1929 and doesn't matter which standard candle you use we always measure the same distance velocity relation all of these are direct measurements with the distance and Radial velocity each with different standard Candles there is a rub though indirect measurements of the Hubble parameter using the cosmic microwave background and bar on acoustic oscillations give a significantly different answer which I'll talk about later the Hubble key project was one of the first to do a major search for many seates in distant galaxies and then measure the Hubble parameter they gave their final work in 2001 in fact this project was one of the core reasons for the launch of the Hubble Space Telescope and why the orbiting Observatory was named after Hubble just to make sure we all know there's no one on board the HST it's a robotic facility on another recent measurements as shown here here using seids and other standard candles show that H knot is about 72 or 73 km/s per MEAP par hn is very hard to measure recession speeds are roughly easy to measure from the shifts of spectral lines but distances are very hard and the recession speeds are Complicated by the random motions of galaxies due to the being in clusters are Falling Towards 100 megap Parx scale Mass gradients these extra non- cosmological motions have to be taken into account however subsequent measurements using Hubble Space Telescope and now the James web Space Telescope support these measurements the accuracy precision and interpretation of these observations are not under question universe is expanding so all these projects to measure the Hubble parameter have the intent of being able to Faithfully represent the distance to some new or unknown Galaxy using only the red shift as measured strictly from the Spectrum nearly every astrophysical process that we want to learn about depends on us accurately knowing the energy output if we know the distance to something then we can quickly relate how bright the object appears to be to how bright it actually is that is its energy output once we know that we can relate processes evident from its Spectrum from its environment or from its appearance to teach us what's going on over there so without the Hubble law we wouldn't have a handle on what's a lot of what's going on but first let's get back to that expansion of the universe stuff incidentally the inverse of the current value of the Hubble parameter gives us a rough approximation for the age of the universe because the units are kilometers per second per Mega Parc and if we know how many kilometers there are in a mega Parc and how many seconds there are in a year then we can get a good guess okay so let's go through it real quick first we take this thing and put the seconds of Mega Parx on the top because that's what the per and per allow us to do and I'm going to kind of use this as a mega fraction and start canceling units next we want to try to get rid of how many the mega parcs as a thing and convert them to kilometers so first we know that one megap Parc has over wow 206 trillion I mean not trillion billion well I guess I guess trillion if you're talking Brit talk but 206 billion astronomical units but how many astronomical units are there in a kilometer or reverse wise how many kilometers are there in an astronomical unit there's about 150 million kilometers in an astronomical unit and finally we've converted now MEAP parex to astronomical units and astronomical of kilometers we have kilometers on top and kilometers on bottom we have seconds on top the age of universe in seconds isn't really good so in one year there are just over Pi million 10 pi times 10 to the 7th seconds in a year which is a really cool little statement it's a little bit over Pi so we can call it 31 30 almost 32 million seconds in a year and if we multiply across the numbers across the top and multiply the ones the bottom and then divide up and down and get rid of the units we're left with years and that's approximately 14 bill billion years so that's a rough good guess as to the current age of the universe which is an interesting thought about what you get from just this rate of expansion Hubble's Law demonstrate that the universe is expanding in this systematic way the further a Galaxy away is from us the faster it appears to be moving from us the Hubble parameter H knot is a measurement of the rate of expansion of the universe as measured at the current Cosmic time it is not a distance velocity centered only on us it's not just that how do we know it's actually expanding let's actually go through what we mean by the expansion of space and how that relates to Hubble's Law and we're going to drive this using geometry distance measurements are always measured so some length so it doesn't matter how that length is measured so what I'm going to do is I'm going to make say a really big triangle somewhere in the universe I'm also going to say that it's anywhere and it's any rotation or orientation that we can m imagine we can rotate it around any which way and put that triangle in any location in the universe let's start with the triangle being around when the universe was say small and I'm going to color that triangle purple I've label each side and each vertex of the triangle My Hope was to kind of make it look like we're going around the triangle R12 at T KN means the length of the side of the triangle between vertex one and vertex two the T KN means the starting time we use parentheses on each because that length is a function of time and we're marking the starting point now at some later time T the triangle has grown such that all the angles are the same with respect to each other and the length of each side has doubled superimposing the two triangles we can see that it's just a bigger but looks the same if you remember your high school geometry we use the angle angle angle test to show that the two triangles are similar but not congruent this just means they look the same but differ only in size now let's capture the time functionality of the change of the sides of the triangle whatever happened to maintain its shape all the sides grew in exactly the same way meaning the scale factor function was the same for all three sides I'll call that scale factor a is a function of t or a of T we don't know the functional form of a of T it could be a wild function of time or very simple it just applies to all sides equally so now let's go through and peel each one of these things and pull them up to their respective places in the equation I've captured and related all the sides as a function of the scale factor in each case the r of T KN is a constant each of those three on the right hand side the size varies due to the scale factor function a of T and on the left hand side is the resultant size after some time T we'll just make it clean up so we have a little lined up so we're not looking at things that are moving around looking at all three equations these could be Vector equations explicitly demonstrating the orientation and location in space however we posited that the starting triangle orientation and location were arbitrary this is actually a restatement of the cosmological principle now let's just take a look at one of those sides anyone will do since this whole thing was arbitrarily Chosen and we now how see this how this change this equation changes with time we want to get that function we must have varied somehow small to big so now we're going to check that and we're going to first sometimes use convenience of dot notation which shows that a DOT above a variable means a Time derivative so that DDT means a derivative with respect to time and a DOT is just a very shorthand notation way of doing that so you don't have to carry around all that writing next we use the definition of speed as the rate of change of distance to rewrite v sub12 t as V of1 to not I'm going to use V For Speed for its speed not s since strictly speaking this is a velocity which attaches a Direction but I don't really care about the direction of the change at this point now then we're going to plug that top equation into the bottom one by noting that the r12t KN is equal to the r is a function of time divided by the scale factor at that time and therefore we have all variables as functions of time in one equation but now we want to simplify our notation for clarity even more since one to two was arbitrary we don't even need that subscript and the time variable is a given for everything same with all the rest finally we're going to call r sub12 d for distance then we get something that looks like this a blindingly simple looking thing but wait what's that a do over a thing that's kind of familiar it's actually the Hubble relationship where we Define the Hubble parameter is the change in the scale factor divided by the scale factor H knot is just its present value at the present time that's why I called it parameter and not a constant this is the Hubble relationship and now all we need is to understand how red shift measures and encapsulates that scale factor a okay so it's worth stopping here for a moment I was a bit sneaky and glossed over everything related to distances as you can see the sides of the triangles are lengths but more importantly they are lengths at one exact moment and Cosmic time this in general relativity is called a proper distance at T Sub Zero and at the later time T we've quote stopped time to take a measurement of each side that length is called a space-time interval this hold idea is ass assumed the cosmological principle isotropy and homogeneity for how we set up the triangle in our space then we said that the triangle expanded in that space however what if space itself expanded why would we ask such question because when general relativity was being formulated it was in response to the question how does gravity work within the framework of special relativity if we can make measurements nearly instantaneously or at least seemingly so compared to the size of the thing measured then we can use the old Pythagorean theorem to get the length of the sides time doesn't figure it into that but special relativity asks what if you measure lengths when something's moving fast and you posit that see the speed of light is a constant then you get a link between time and space but why expansion why back in 1900s and 1910s when Einstein first developed special relativity and general relativity it was well understood that gravity attracts it was also known that the Earth was very old as are the Sun and Moon so for stars and nebula to not be crashing down onto each other when they're so big and so massive yet relatively close enough to each other that it seemed worrisome that they hadn't crashed into each other other and made one big Blobby ball of stuff to alleviate that worry imaginative mathematics were developed quite aart from the questions of the astronomers and the physicists these solutions to the Einstein field equations of general relativity tried to keep the heavens from crashing down on us if space expanded that would do the trick so I've essentially followed the mathematical argument by simply creating A Spacetime that expanded I've also used the ideas of homogeneity on isotropy to show that this triangle growth would happen anywhere hot would just simply be that rate of growth in some sense this is completely physics free what we now need is a method to actually measure the lengths of these triangles especially when the sides are very very very large so let's look at our only hope light let's presume in the previous discussion is true what does that tell us about light so if we start with a Galaxy emitting light on the left and then we watch Watch What Happens as the universe expands and the light has finally arrived at the telescope so now we have a thing moving in SpaceTime according to normal physics thinkers if a thing moves it has momentum that's a basic Newtonian mechanics if a particle accelerates in any way it changes momentum but light doesn't ever change its speed and its momentum has been experimentally verified to be dependent upon his wavelength and the AG is the plong con trajectories and SpaceTime are called geodesics and they are the curved SpaceTime idea of a straight line these straight lines also must in take into account the passage of time light's geodesic is called null I discussed this at length on my lectures on relativity so I won't expand here combining the null geodesic a statement of physics about the nature of light always going at C for all observers with the concept of light as a particle with momentum inversely proportional to its wavelength we get startling result light changes wavelength as it passes through a changing SpaceTime because it cannot respond to that change by slowing down or speeding up no process is operating on the light other than traveling through space so to continue traveling along the geodesic it can only change one thing it's wavelength again a null geodesic is simply the shortest zero valued SpaceTime interval in other words it's what we would call a straight line in a curv space time if you moved at the speed of light there's a lot that goes into the statement really and you spend a good deal of time in a general relativity class learning about parallel transporting in a vector in and on a curved manifold specifically to the form of the Freedman Robinson Walker metric as you propagate a photon along a null geodesic it's momentum along this path varies like the energy of the photon so let's see how this plays out we return to the red shift definition and see if how that scale factor comes into play We rewrite it for clarity and now we apply this scale factor to each of the wavelengths of the photon noting The observed wavelength is just the scale factor times the original emitted wavelength okay we can do this because light travels on an N geodesic and its energy is directly proportional to its frequency a very loose way of saying it is if changes in the scale size of SpaceTime affect something with a real size that count quote can't quote counteract the change it's really loose way of saying then the thing will be stretched or compressed with the thing with the change in SpaceTime one of the Central and experimentally verified tenants of special relativity and general relativity is the constancy of speed of light for all observers when this is extended into gen relativity it gives us a null geodesic also the proportionality of the frequency of light to its energy is what got Einstein the Nobel Prize not relativity so this is very well established too if the speed of light does not change and the laws of physics are the same everywhere then the same process will emit the same wavelength of light regardless of the size Scale of the Universe when that light travels traverses the universe between emission and observation in order to maintain the constancy of the speed of light as the universe expands given its energy the wavelength must change to compensate for that expans expansion look I'm really trying not to get too deep into the derivation of the F Freedman Roberts and Walker metric and show the tenants of special and general activity create the I sign field equations with this metric is one solution given the nature of SpaceTime I'm also really glossing over the fact that the a of T contains all the physics of how the universe's contents affect the SpaceTime I'm trying to get the highlights of the points and Dodge all the point-by-point steps to get us there it's just that given how photons carry momentum and that their path through SpaceTime creates a change in their momentum ultimately means that there's a direct link between a universe with the ways space time intervals or distances are measurements and the energy output of those photons and the energy of those photons that take that path another nice but quite loose way of thinking about it is the total number of wave Peaks between the source and destination is doesn't change if you look at the universe when it was smaller and stopped the expansion and let fly the photons you could count the number of wave crafts between all the end points then you expand the universe and stretch all the lengths between the source and the destination stop the expansion and do the same thing the number of wave Peaks would be the same for that to happen the wavelength goes up and the frequency goes down the speed of light then being constant means that if we see a red shift that is not due to the relative motion of the end points then it is due to the stretching of SpaceTime itself you might be asking well where does all that Photon energy go the photon frequency is decreased so it looks like there's an energy loss but there really isn't the universe is a totally closed system so there isn't an increase in entropy of the photon field due to this expansion if there were some loss of energy to the universe in some way then the laws of thermodynamics say it would eventually go into heating something which would then in turn eventually make more photons because heating things up makes photons this means that the expansion of the universe and its action on photons would somehow make the universe brighter but this isn't seen quite the opposite in fact another way to say this is if we ran time backward we would return to the same Photon energies as we left them this is an underlying Assumption of the universe being a closed system not to be confused with a closed geometry in a sense light itself is closely tied to the measurements of the universe we can look at the speed of light as a conversion factor between space and time just think of this following thing light travels at 186,000 miles per second so we can say that 1 second is 186,000 Miles and that's a really good way of thinking about how we relate Space and Time 1 second is 100 186,000 miles photons just happen to only travel at that one speed gravitational waves also travel at the speed of light but that's a different video so let's divide out all those Lambda emits and get we're left with scale factors and then if we Define a not a Subzero a sub observe to be one meaning the scale factor today is one then we rearrange this equation to have something that looks insanely simple red shift is that red shift and scale factor relationship it clearly shows that if we look back in time for when the scale factor was smaller Z gets bigger as expected for the big bang when the scale factor starts to approach zero Z goes to Infinity it means the farther back in time we try to appear the redder the light becomes this is why I keep hang on this point this is why I keep saying it's an expansion why can't it just be everything that's really flying away from us why can't it just be a Doppler ship where it's just due to motion of the galaxies through space well first with all the observation we see and the many dozens more that exist the recession to speed distance relationship does not have an append on the direction you're looking it would be an astonishing coincidence if this were only due to the simple motion of galaxies a process would have to be devised to make it so they're flying away faster and faster the farther they are from us this just seems patently absurd on the surface we do not observe something similar from any other Galaxy or some doubling up of speeds due to some big Galaxy between us and a more distant one no it's a linear relationship centered on us that just is what we see well that sure does make us seem pretty darn special doesn't it ah but wait that would mean there is some physical law here or centered on here that applies only to us and to no other place in the universe you know what every time anyone has ever thought that in the history of science or philosophy they've always been proven wrong geocent cism dead wrong only plets in the Galaxy wrong only galaxy in the universe wrong humans are the only form of life with feelings and emotions as wrong Earth is the only planet on which liquid water occurred and oceans were and oceans that happened that were hospitable for life that's wrong seals ours therefore the cosmological principle rather the cernic principle holds here to we are not special so we're not at some Center and we're not different from any other Galaxy an astronomer in any other galaxy in the universe would also see the same Hubble law anyway this all goes by way of saying that the change in red shift directly measures the change in the scale factor size at Z of a th thousand the universe was a thousand one times smaller than it is today at that red shift the cosmic micr background is a cosmic mid infrared background with all that in hand let's keep moving it's worth going over a few examples to make sure we got this down here we see a classic example the stretching of a photon's wavelength is depicted on the surface of a balloon this common picture is the result of light traveling on a old geodesic in special relativity we don't have any curvatures the mowy metric clearly shows the speed of light's constancy when we extend the constancy of the speed of light in a curved space time and specifically curved space time that's allowed to expand then a photon's wavelength and frequency both change as the universe expands I deriv the whole thing in a different video where red shift comes from light again only follows null geodesics normal particles don't this expansion only applies to photons and whatever else someone may think up one day is traversing null geodesics that's why we use the balloon analogy it's a hypers simplification which tries not to talk about the metrics and length measurements and all that but you can see the Grid on the balloon changing and that means we're measuring lengths and times in a curved expanding space some things move in particular ways in those spaces we have to take those into account so red shift arises one because the photons have a constant speed of light the universe measuring stick are given by the fredman Robertson Walker metric and three the universe is expanding the third bit is the conclusion you must draw if you agree to the idea that c is a constant and that relativity is a thing and that you have discovered that photons momenta and energy are dependent on the frequency since there's ample experimental evidence for all of this we just keep walking our sides along seeing if that idea breaks anywhere and as of today neither idea has been broken and not for lack of trying so much for balloons now let's take a look at the obers Horizons in the expanding Universe here what I've done is I've created a little kind of tiny universe made out of a yellow bubble the yellow bubble will be centered on the yellow robot there's also other robots in there a blue one a red one and a and a purple one each of those represents different observers in different galaxies so all of these objects are extremely far apart and this just happens to be a person or Observer or alien or whatever you like to call it in some very distant Galaxy let's just see what happens if we allow for the expanding universe and see who gets to see what inside of yellow's capability of observing we have the red one the blue one and the purple one so now as the universe expands and everybody spreads apart the yellow one the blue one and the red one all three of the all four of them stay inside of yellows universe as it were but each of these observers because of the nature of the expansion has their own Horizon too notice how the VA the diameter of the balloon or the yellow area expanded from that small area to this large area if we assume that the blue robot had his small area the same air volume as the what we saw at beginning of the yellow we should actually see something a little like this notice for the blue Observer that the red and purple robots are outside of their of their view they do exist they're just outside of his view likewise with the purple robot only yellow is inside and finally only the yellow is inside the red so all of these outer far robot observers or whatever they are whoever they are these things they are very far away from each other far enough that they're outside of each other's Horizons they don't mix so we have a series of Horizons that are all stacked up on top of each other and none of them is the end for us let's say we're the yellow um observer in the middle at this point we have an observable Horizon that's it's kind of indicated by one of those the the circle that surrounds the yellow yellow Observer but that yellow Observer has only that as its Horizon and that Horizon is is the limit of a red shift of say very large if that red shift becomes larger and larger and larger we see that it gets to a point where we have a maximum Look Back Time and that maximum look back time is the age of the universe meaning the speed of light times the age well well not well how far light is able to travel since the beginning of the universe from a certain point and that's what we mean by this Horizon so that's actually makes an interesting statement because blue sees the same thing red sees the same thing purple sees the same thing everybody has their own Horizon more importantly then where do those Horizons end because presumably to the right of the red Observer there's more observers and to the upper left of the blue Observer there's more observers and to the left and down from the purple Observer there's more observers where does that end how does that stop H don't know currently it could just very well be that the universe is infinite in extent spatially which is a fascinating state M if the universe is infinite and extent spatially then all these observers all see all the same thing which is truly fascinating means we're really in no such special place at all so let's take a little bit and check what exactly I meant by that previous statement of the cosmic Horizon and to that we're going to also whack on the idea and Bash on the idea of the light year as a result so once again let's go back to this the concept that was elucidated with that little animation I did before which is that the Galaxy rushing away from us well it emitted light and the light travel along this line to get to the telescope we saw that before but now this is elucidated in kind of a graphic format here where time progresses from ago at the bottom to now at the top and we're at this galaxy that's on the left that stays put and the apparent change of the Galaxy or the actual change of the far Galaxy as it rushes away from from us due to the expansion of the universe is on the right hand side and the photon that travels comes from that right back over to the left so there's an emission distance which is the proper distance at time of emission there's the proper distance at now which is that which is when the Galaxy is where the Galaxy is now and these are proper distances which means if you simply stop the expansion and then put out a bunch of measuring sticks down now and just added those all up that's the distance you'd have and you could measure that in light years if you wished but wait a second measure in light years hold on the light travel time distance is simply the speed of light times the time difference between then and now and that's what we call the light travel distance so people at public events always ask about and they're told that light years of the distance to some Galaxy or way over there even Nasa uses this on their website oh this the light's been traveling to us for 12 billion years or sometimes they'll just get short and say this is 11 billion Lighty years away or whatever well light years are conceived as the speed of light times the time it took to travel from there to here and this is absolutely not the same as the proper distance at either the time of emission or the time of observation it's a completely different distance measurement because light travel time distance does not take into account any aspect of the expansion there's another distance we call the co-moving distance that's often used it is the proper distance divided by the scale factor this means that two galaxies if they had no random relative motion would stay at the same co-moving distance as Cosmic time progressed proper distance is tied to the expansion so it changes co- moving distance as the distance removed from the scale factor so light travel time distance really isn't anything but it's what a lot of people think about and what they think it is to be when they hear about the distance of something when they hear about it say oh this thing's from Jame from James web telescope we see the light as it was 200 million years at the Big Bang so it's 14.7 14.1 billion light years away or whatever the most important thing is that this is not the same thing we see that the distance traveled we is not the same thing light travel distance does not take into account any aspect of expansion it's simply a speed which is c times a time interval it does not take into account anything related to the scale factor or the expansion so that's pretty interesting and it's also something that we kind of have to look at more carefully so let's go back to the Horizon and put it in terms of a graphical format in this way so we're going to look at Red shift I said before in that previous thing with all the robots and balls that we were talking about red shifts and look back time and distances and Horizon so we know that if the red shift increases with time with as we look back in time as you can see in the left hand column the red shift goes up and up and up and up and up and we're looking back in time the Look Back Time all the way to the right notice that the red shift goes up very steeply towards the bottom and the Look Back Time starts to level off and change not at all and in fact past a certain red shift dist red shift we have Z zero change in look back time that's because red shift measures the expansion rate of the Universe from the time of the big bang and the Big Bang is roughly 13.7 billion years old now this set of numbers came from the fact that we assumed a flat universe with h equals 71 kilometers per second per Mega par with a standard Lambda CDM cosmology then we can derive all these things for a given Red shift and notice that maximum Look Back Time of 13.7 billion years and there might be a lot of confusion because if you look just to the left of it the present distance is 47 billion Lighty years it just sounds like they're completely different distances so which one's the correct distance and one seems way too far away I mean the universe is only 13.7 billion years old so how can something be 47 and a half billion light years away again that's the expansion of the universe and the present distance is a proper distance the proper distance today right now if we stop the expansion and just laid down a bunch of markers at Fourth column we use units of millions of Lighty years we see that instead of MEAP parex MEAP parex are a geometric measurement which is measured based off of trigonometry based ultimately off of the angular change of a star in the sky due to the Earth's motion around the Sun that's where the parek is defined so it's very very geometrically based but light years is just a distance times a time or well a distance divided by a time or a rate a speed a known speed or an established speed times a time interval it's not a geometric distance so everyone learns that a light ear is just the distance light travels in the year and that is completely true however the indic implication of that statement is that all distances are the same and that a distance is a distance is a distance one is just different units from the other our memory and our cultural bias say that if something's 10.8 billion light years away then it emitted that light 10 billion years ago more frequently in more responsible places people will just say it emitted the light 10.8 billion years ago but they won't say that it's 10.8 billion light years away they'll say it emitted light when it was 10.8 billion years ago so if we want to say 10.8 billion years ago it limited light and it's 10.8 billion light years away that's not true in an expanding Universe something that's measured to be 10.8 billion light years away emitted its light only 7.7 billion years ago now we're getting confused only because we got attached to this idea of light speed as a unit of speed in a high school physics sort of way where distance equals speed times a time and the fact that all of our experiences with non-curved non-expanding spacetimes we're just hung up what we learned in grade school and high school because Lightyear sound really cool and it's very easy for the teachers to teach especially when you say distance equals speed times time makes it kind of fun for them to teach but the idea or Intuition or common sense that we have from that early idea breaks down when we discover the evidence for an expanding Universe another way to view this Horizon concept is this is with this graph when we think of a time Horizon because as we saw in that graph before there was definitively a Look Back Time maximum red shift went up to Infinity but the Look Back Time had a maximum time of 13.7 billion years ago so we can look at that as a Time Horizon from which we cannot see any time before in every direction if we look farther and farther away objects we look at are deeper back in time if we look far enough quote we get to the Big Bang but all of its life would light would have been red shifted down to impossible to detect wavelengths more interestingly we can see that there's a maximum proper distance for this emission and that can be seen by this graph which shows that it's somewhere around five gigap parex or if you really really really want to go back 15 billion Lighty years farther out than that and make mostly farther back in time the size of the universe and Cosmic history was actually much smaller and that the dis emission distance starts to be comparable to local distances and gets closer and closer and eventually gets very close to zero or at least down to the size of some Primal Fireball that would eventually make up the universe and that happens of course at the Big Bang the outer ring of this graph this green ring is the emission distance of almost zero I mean this sounds bats but it does work out it works out due to the at what point in Cosmic time do you want to start your emission process and send the photon on its merry way again if the volume of Space is really small and you're you are right around the beginning of the expansion and you throw a photon at a Target the expansion quickly drags it away like a very fast escalator with a kid running the opposite direction the kid keeps running at the same speed and covers a lot of distance but the distance keeps growing growing underneath him at each moment it seems like the kid is being carried further and further away which is true but the escalator is going ultimately at a slower rate than the kid runs at some point the kid gets past a point where the dragging away is less than the going forward he'll Advance slowly then faster and faster until the time when the target finally receives the photon or he gets the other the escalator this process for the universe is maximized for a volume of space centered on a target of course with the source photons being just inside the light travel time Horizon at the time of the Big Bang this is not the edge of the universe as we saw with the example with The Observers and robots and balls before this is not the edge this is just our edge of capability of seeing this is our Horizon but it doesn't mean it's the edge of the universe there is no Edge to the universe it doesn't exist there is more more stuff of the same just a little bit away outside of that Horizon and as we saw from the picture below the three robots that were inside the yellow ball at the beginning are outside of each other's balls so each one of them has their own Horizon centered just like this the farther away they are they the more the space will expand and the space will expand such that the other observers will not see each other so it is there's more of the same past this Horizon and everybody sees the same Horizon which just but it's important to remember we're not at the center of the expansion we're only at the center of our light Horizon defined by the places from which light has had a chance to get to us so that's what this graph means we see on here the red shift increasing on that right hand side going all the way out to very large but look back back time gets larger and larger and larger and red shift gets even larger and larger but the look back time is a constant sort of a stayed steady look back time because that's just an advancement of a clock and so the thing going up to like one o'clock or noon we have an emission distance and then we have an event distance as well so these emission distances and current distance are interesting on the left hand side emission distance goes up and up and up till it gets to about 5.7 gigal light years and then it goes down to one at the other end so there's a maximum emission distance from which you get the largest possible distance between the emission of the photon and the Observer and receiving and that's just because of the nature of the expansion of the universe and the current distance is larger and larger getting past that 5 5.7 billion Lightyear um emission distance the current distance is the current proper distance the emission distance is the proper distance at time of emission see that's where we get those things from that's exactly what those previous slides were proper distance at time of emission proper distance now that's what those two things mean and so the the other things that the the going down into the left about 7 o'clock shows the extent of the Sloan digital Sky survey the Hubble Deep Field and the cosmic microwave background as well as when the first stars were born young galaxies and old galaxies in the Dark Ages when there was no light in the universe and those funny lines just show you that where when we wish to map the points of Look Back Time where when was the emission distance what was the emission distance at said Look Back Time and what is the current co-moving distance right now the current proper distance and that's where we get those things from notice that the emission distance goes up from the beginning time and then swings back down and goes smaller but then the current co-moving distance is is the current proper distance and that goes out and out and out and out and out and gets larger and larger as the universe expands so the bottom thing is a true expression of where things are now but the the top thing is where things were ago all right so now that's all interesting and everything but our original question was the measurement of the Hubble constant and the Hubble parameter and what Edwin huble did using can Levits information and vestos lifer techniques ah nowadays there are a lot of things to work out with hnot we saw well before that hnot seem to be centered around 72 but the recent years have discovered a tension in the measurements between the H constant and you can see from this graph there are two bands one going down the red side on the right and one going down the green side on the left and they're separated roughly by this group of things that are direct measurements and groups of things that are indirect measurements so let's look at each and what the impact is first let's look at the indirect measurements which we didn't really talk about in this discussion the indirect measurements come from trying to fit the Hubble parameter at the present day with the uh with measurements of the cosmic microwave background using the plon T plun Observatory as well as using the same data without the plun observatory and then with no com with not using the cosmic mwe background but only big bang nucleo synthesis arguments as well as microwave lensing uh and power Spectrum with microwave lensing that's what those things are those are indirect measurements they don't directly measure it they're fitted curves to data notice that they Center roughly around 67 or 69 or so more like 67 and a quarter 67.3 kilometers per second per megap Parc and that's what we see in the third one on agum on 2020 with the plun 2018 data it's roughly 67.2 s uh kilometers per second per Mega Parc and the error bars that's what those things going to the left and right are shows how confident they are in those values that they have so now those are indirect measurements but if we now look at their direct measurements which are below first we have the seids which we talked about extensively and the seiad variables seem to Center roughly around 73.2 or 73 or so somewhere around 73 and then we can see that there's type one Supernova or tip of the red giant Branch groups that's in the green that's below and they all sort they're a little bit lower but they're still in agreement with the direct measurements and if we scroll down and see other things different kinds of standard candles such as Myas masers the tul fishal relation surface brightness fluctuations type 2 supern noi the brightest H2 region in galaxies and lensing related and Mass model dependent lensing models meaning gravitational lensing of objects we see that these direct measurements of hnot uh lead us to roughly somewhere with the most optimistic average is roughly 73 kilometers per second per Mega parac those are direct measurements where we don't have to infer anything we have a standard candle of some sort and then some way of measuring it's it a statistical set of standard candles versus the statistical set of the um of the recession velocities so there's a statistical grouping of these things for individual sources and then when you group them all together you get a fitted curve just like we saw with Hubble's original curve and all the other curve and all the other lines that we saw in the previous graphs this is interesting oh and the bottom is very interesting thing coming up very recently is gravitational wave detections gravitational waves also travel along null geodesics so how they could they can do a direct measurement now they're not as accurate because there's only a few gravitational wave observatories and their ability to pinpoint things in the sky is very low so that has a great impact on what their measurement is for for h knot all this means there's a lot to work out with the Hubble constant and the Hubble tension means that there are recent measurements indicated it's roughly 70 68 I'll call it 67.6 we'll call it 68 eight and then higher values roughly around 73 or 74 which I list the 74 one from March 18 but it's roughly around 73 is the average for the direct ones as you can see from the red bar and the green bar the indirect measurements that principally come from the cosmic microwave background or physics arguments from big bang nucleosynthesis those two sets of measurements all of these sets both the direct and indirect are extraordinarily rigorous they're extraordinarily well understood they're all very they're both all sets are considered valid measurements of the Hubble parameter but they differ and they differ on a four Sigma level and what that means is that it's a very difficult re thing to think that these things are actually nonsignificant like these changes like oh it's something in between maybe it'll be just the average of these things no they are measuring very different qualities of something so there has to be a relationship that tells us why one of these why we get this H parameter when we measure direct and why we get this Hubble parameter we measure these indirect things there must be some reason we don't know what it is this is very important because it means what is the actual expansion rate it doesn't seem like there's any systematic errors the errors that are involved with this are most certainly embedded somewhere in here but and we see the error bars for each of these measurements but the important part about this whole thing is we have one group of measurements saying one thing and one group another there must be some Physics or some understanding that we do not yet know that links them together or says Ah but if we take this into account then we get then they balance out or they come to this value or something nobody knows what that is that is a current area of extraordinarily active research I did a little video on on an attempted kind of thing where somebody said oh what if light has a light TI light gets tired and loses energy or the or the physical constants of the universe change as time goes on there's a lot of reasons why that can't happen um and those are extensively discussed in much of the literature and it's currently ongoing but that was just one very flashy thing that came up in in previous months so what we're looking at is importantly two different tension this tension that is currently active research however just because there is this tension it does not invalidate the expansion the expansion does exist it just means we don't know everything yet that's all it means so in the end which version will win the direct measurements such as those of the hble Deep Field that we see on the left or an indirect observation such as the plon up plus is interpreting statistically the cosmic microwave background of the of the as seen here in the plunk on the right by the plunk telescope on the right which is Win which one will win um which one we don't know there'll probably be some modification of both understandings some modification of both so now let's go all the way back to the beginning the cosmological principle we look like we're at the center but that's what every other Observer will see too no matter where in the universe we are we will measure the same relation between the recessional velocity and the distance the same humble parameter if that's what we see and everyone else sees it then it's a Universal Property that's isotropy and homogeneity the universe is expanding now that where was the Big Bang we think that it's like oh if it's expanding it's expanding from some point so where is that point if we look take the expansion backward in time all the galaxies seem to originate from a single Event Event in SpaceTime called the Big Bang even though it seems like it we must not be at that Center because every Observer also sees themselves at the center doesn't matter which of these galaxies we see in this image and any Galaxy any Observer anywhere in the entire observable universe they would all see themselves at the center there is no place where things are actively dumping out or spreading away from the one place there is no shock wave there is no expansion front from some long ago explosion or detonation there is no single spot that has a bunch of smoking Embers or Tangled Up SpaceTime or wibbly wobbly messed up thing from which everything flowed there really is no special space in the universe therefore the Big Bang was everywhere all at once this is due to a combination of the cosmological principle that we've discovered about the nature of the universe and by observation what photons are and how they carry the energy and momentum and how we've played around with the field equations to give us something that kind of looks like a good idea all these things come together to give this startling inescapable counterintuitive result that defies Common Sense the Big Bang was everywhere all at once that's pretty pretty cool the universe today then is a low density dark and rather cool place we see that it continues to expand the universe 13.7 billion years ago was smaller denser and hotter Universe was opaque and filled with radiation in the form of photons how far back into the universe's past can we go go check out my videos on cosmology to learn more about that and don't forget to subscribe and like this video thanks
Up Next

27:39
The Cosmic Microwave Background Explained: The Big Bang's Afterglow
@SEA
800.2K views•2021-09-18
61:17
First Billion Years of the Universe with the Square Kilometre Array
@iaaudc
121 views•2022-05-26
29:29
Stellar Motions: Parallax, Proper Motion & Radial Velocity
@JasonKendallAstronomer
9.6K views•2018-07-16

6:10
Gamma-Ray Bursts: Cosmic Snipers Explained | Astronomy
@kurzgesagt
15M views•2016-07-31
Related Study Plans & Knowledge Roadmaps
Structured learning paths in Astronomy
astronomy
Reionization: Pop III Stars, IGM & 21cm Line
01Foundations of Cosmology & the Early Universe
02Population III Stars & Cosmic Dawn
03Physical Mechanisms of Reionization
+ 2 more learning modules
17h5 modules
Explore Roadmap
astronomy
Planetary Rings: Dynamics, Roche & Resonances
01Foundations of Gravity and Orbital Mechanics
02Tidal Forces and the Roche Limit
03Structure, Composition, and Collisions
+ 2 more learning modules
10h5 modules
Explore Roadmap
astronomy
Asteroseismology: Stellar Waves, Ages & Cores
01Foundations of Stellar Astrophysics & Wave Mechanics
02Stellar Oscillation Modes: P-modes and G-modes
03Mathematical Framework of Asteroseismology
+ 2 more learning modules
35h5 modules
Explore Roadmap
astronomy
Adaptive Optics: Physics, Engineering & Control
01Foundations of Wave Optics and Wavefronts
02Atmospheric Turbulence & Optical Distortion
03Wavefront Sensing Technologies
+ 3 more learning modules
35h6 modules
Explore Roadmap