Congestive heart failure presents on chest X-ray with characteristic findings including cardiomegaly (enlarged heart), pulmonary vascular redistribution (dilated pulmonary veins larger than base vessels), blunted costophrenic angles indicating pleural effusion, and Kerley B lines representing interstitial pulmonary edema, which together confirm the clinical diagnosis of heart failure.
Chest X-Ray in Congestive Heart Failure: Radiographic Findings
Added:Deep Dive
Basic anatomy of the cardiothoracic cavity, including the heart chambers, major vessels, and lung lobes.

Thorax organs - plastic anatomy
457.3K
The thorax contains the heart, lungs, and major blood vessels within the thoracic cavity, which is bounded by the thoracic cage (12 pairs of ribs, sternum, and thoracic vertebrae) and separated from the abdominal cavity by the diaphragm; the heart occupies the mediastinum with its four chambers (two atria receiving blood and two ventricles pumping blood), while the lungs fill most of the remaining space with the right lung having three lobes and the left lung having two lobes, and the great vessels include the superior and inferior vena cava returning blood to the heart, the aorta carrying blood away from the heart, and the pulmonary trunk transporting blood to the lungs for oxygenation.
Click to watch →
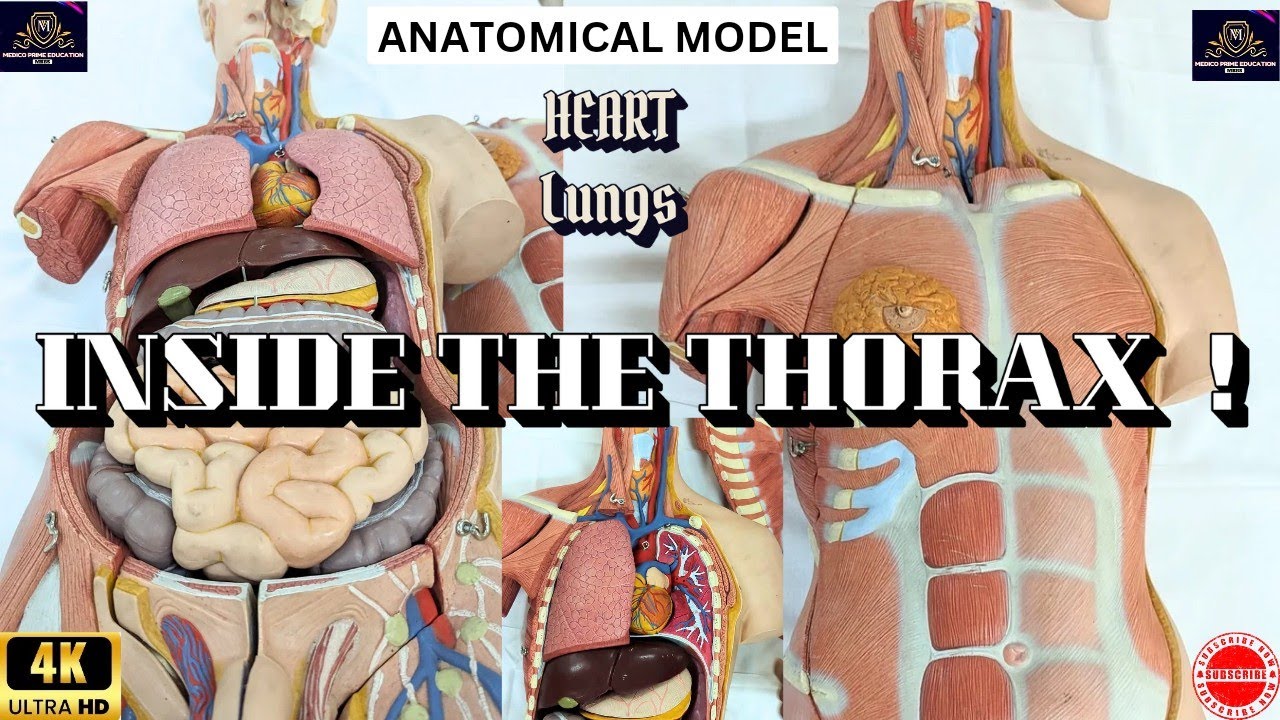
Thorax | Contents of Thorax | Heart Anatomy in model | Organs inside Thorax | Lungs in Real body
1.2K
The thoracic cavity is a bony structure formed by the rib cage, sternum, and thoracic vertebrae that houses vital organs including the lungs (left lung has two lobes separated by oblique fissure, right lung has three lobes separated by horizontal and oblique fissures), heart (located in the mediastinum, slightly tilted toward the left side), trachea (dividing into bronchi), esophagus, and major blood vessels. The heart contains four chambers (right and left atria and ventricles), with the action potential originating from the SA node in the right atrium, passing through the AV node, bundle of His, and Purkinje fibers. The heart valves include the tricuspid valve (right AV valve), bicuspid/mitral valve (left AV valve), pulmonary semilunar valve, and aortic semilunar valve. The diaphragm separates the thoracic cavity from the abdominal cavity.
Click to watch →

Heart anatomy part one
193
This comprehensive section covers fundamental cardiac and thoracic anatomy. The heart consists of four chambers: two atria (upper chambers receiving blood) and two ventricles (lower chambers pumping blood). The right side handles deoxygenated blood, while the left side handles oxygenated blood. Four valves regulate blood flow: tricuspid (right atrium-ventricle, three leaflets) and bicuspid/mitral (left atrium-ventricle, two leaflets). The thoracic cavity contains the heart and is bounded by the sternum anteriorly and vertebral column posteriorly. The mediastinum is the central compartment divided into superior and inferior parts by the sternal angle, with the inferior further dividing into anterior, middle, and posterior sections. The diaphragm separates the thoracic cavity from the abdominal cavity. The respiratory system includes the trachea leading to lungs, with the right lung having three lobes and left lung having two lobes. The pleural cavity contains pleural fluid reducing friction during breathing.
Click to watch →

Cardiovascular system 1(anatomy of mediastinum+pericardium+external heart features)
1.6K
This comprehensive section covers the anatomy of the thoracic cavity and heart. The mediastinum is the central compartment between the lungs and sternum, divided into superior (above sternal angle, containing thymus and major veins), anterior (between sternum and pericardium), and posterior (behind pericardium, containing esophagus and aorta) parts. The pericardium consists of fibrous and serous layers with two important sinuses: transverse (between pulmonary trunk and aorta) and oblique (posterior to left atrium). The heart has four chambers (right/left atria and ventricles) and four surfaces (anterior, diaphragmatic, right, and left). The coronary sulcus separates atria from ventricles, while the interventricular sulci separate the ventricles. The heart receives blood supply from the right and left coronary arteries.
Click to watch →
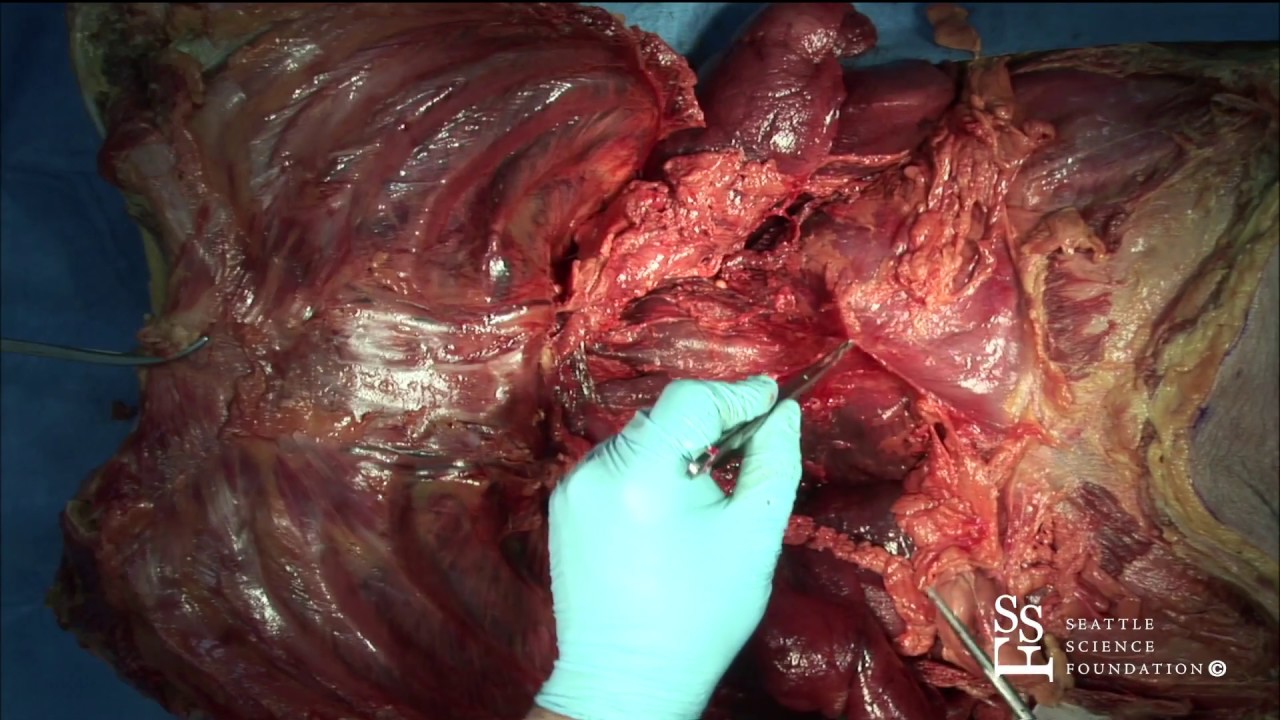
Thoracic Cavity Overview
1M
The thoracic cavity contains the heart and lungs, enclosed by the rib cage and separated from the abdomen by the diaphragm; the heart sits within the pericardial sac with the right and left ventricles having different wall thicknesses (thicker left ventricle for systemic circulation), while the lungs have hila where bronchi, blood vessels, and lymphatics enter, and the pleura consists of parietal and visceral layers with the parietal pleura being pain-sensitive.
Click to watch →
Deep Dive
Fundamentals of chest radiography (CXR) interpretation, including how different densities (air, fluid, bone) appear on an X-ray.
Chest X-Ray Interpretation Explained Clearly - How to read a CXR
1.1M
Chest X-ray interpretation relies on understanding five density levels (air-black, fat-dark gray, soft tissue-light gray, bone-off white, metal-bright white) and using a systematic ABC approach (Airway/Bone/Cardiac) to identify abnormalities like pneumonia (disappearing diaphragmatic line), pleural effusion (tracheal deviation away), atelectasis (tracheal deviation toward), and fractures by comparing adjacent structures with different densities.
Click to watch →

Radiographie de thorax de A à Z : Les bases d'interprétation
92.1K
Radiographic density determines how structures appear on X-ray film: (1) Air appears black/very dark (hyperlucent) because X-rays pass easily through it; (2) Fat and soft tissue appear intermediate gray; (3) Water/liquids appear white; (4) Bone/calcium appears very white (hyperdense). This principle explains why different tissues have varying appearances on chest X-rays and forms the foundation for interpreting pulmonary opacities.
Click to watch →

APRENDE A INTERPRETAR UNA RADIOGRAFIA DE TORAX
43.4K
Chest radiography relies on five basic tissue densities: air (black), fat (dark gray), soft tissue (light gray), metal (bright white), and bone (white). Five quality factors determine diagnostic acceptability: projection, penetration, inspiration, rotation, and extension. Posterior-anterior (PA) views are standard, showing oblique clavicles and scapulae outside lung fields. Anteroposterior (AP) views, used for bedridden patients, show rectified clavicles and scapulae within lung fields, with apparent cardiac enlargement due to magnification. Proper penetration reveals segmented vertebral columns with visible intervertebral discs; inadequate penetration obscures diaphragm detail, while over-penetration creates excessively dark films.
Click to watch →
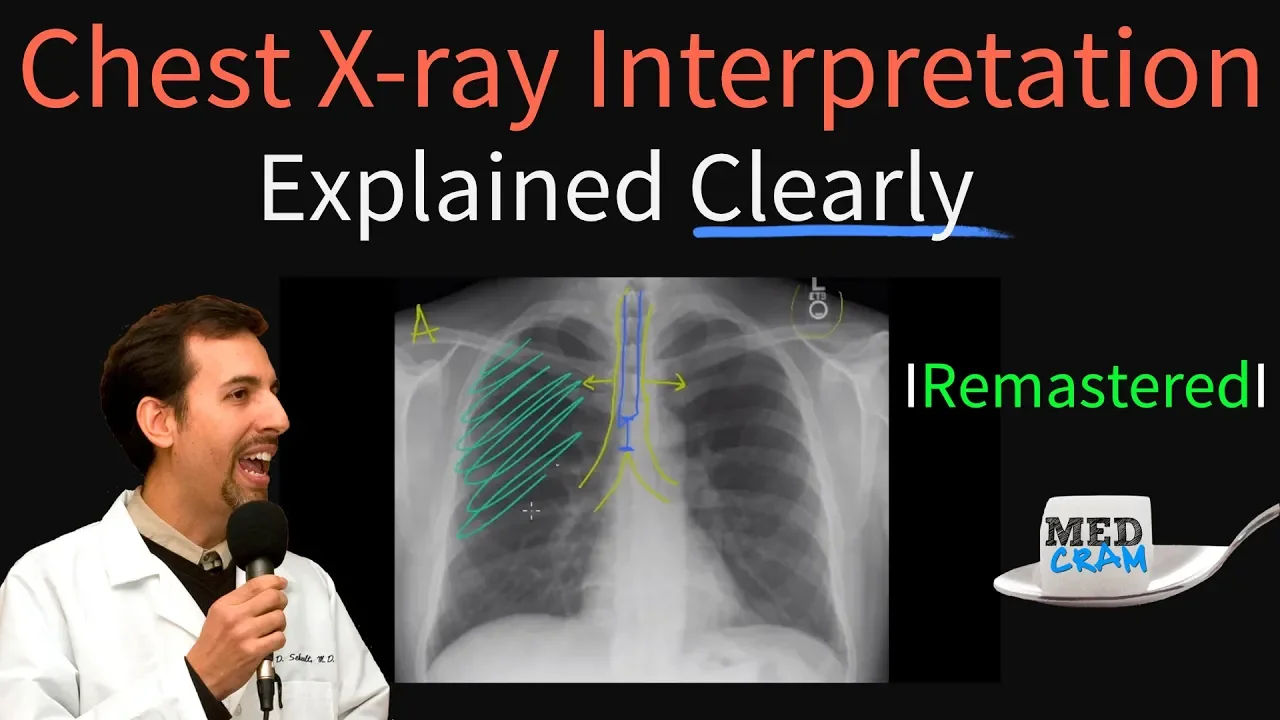
Chest X Ray Interpretation Explained Clearly - How to read a chest Xray
476.7K
Chest X-rays display five levels of tissue density that appear as different shades of black and white. Air density appears black, subcutaneous tissue and fat appear dark gray, soft tissues like the heart and blood vessels appear light gray, bone appears off-white, and metal objects (such as pacemakers or bullet fragments) appear bright white. Pathological conditions become visible when there is a difference in density between adjacent structures, creating demarcation lines that can be observed on the radiograph.
Click to watch →

Chest X-ray: Introduction and Approach
350.2K
In chest x-rays, areas that attenuate x-rays less appear darker, while areas that attenuate more appear brighter. The four principal radiographic densities are: air (very low density, appears very dark), bone and metal (high density, appear bright), fat (less dense than water, appears slightly darker than soft tissue), and water/soft tissue (intermediate density). This principle allows identification of different tissues based on their density characteristics.
Click to watch →
Deep Dive
Pathophysiology of congestive heart failure (CHF), specifically how left-sided heart failure leads to pulmonary venous congestion.

فيزيولوجيا مرضية - المحاضرة السادسة
356
Left heart failure involves left ventricular dysfunction, which may be systolic (pumping failure) or diastolic (filling failure). The left ventricle must generate pressure higher than the left atrium to eject blood. When left ventricular function is impaired, blood accumulates in the left atrium, causing pulmonary venous hypertension. This leads to fluid transudation from pulmonary capillaries into interstitial spaces and alveoli, resulting in pulmonary congestion and edema.
Click to watch →

Valvular Heart Diseases , C.V Pulmonary , Lec 10 (part 1)
3.5K
Left-sided heart failure begins when the left ventricle cannot pump blood effectively. This causes blood to back up into the left atrium, increasing left atrial pressure. The elevated pressure is transmitted to the pulmonary veins, causing pulmonary congestion. The lungs attempt to compensate by increasing pulmonary vascular resistance, but this eventually leads to pulmonary hypertension. The condition progresses to right-sided heart failure as the right ventricle struggles against the increased pulmonary resistance. This progression explains why left-sided heart failure often leads to systemic symptoms of right heart failure.
Click to watch →
Pathophysiology | Congestive Heart Failure| AKTU Digital Education
4.7K
Left-sided heart failure occurs when the left ventricle fails to contract properly, causing blood to accumulate in the left atrium and pulmonary veins, resulting in pulmonary congestion. Primary causes include systemic hypertension, mitral stenosis (valve narrowing), ischemic heart disease, and myocarditis. Clinical manifestations encompass pulmonary congestion, peripheral edema, dyspnea, orthopnea, decreased cardiac output, sodium/water retention, hypertension, and muscle fatigue. The renin-angiotensin system activation following decreased renal perfusion perpetuates the cycle through sodium and water retention, ultimately worsening pulmonary congestion and edema.
Click to watch →
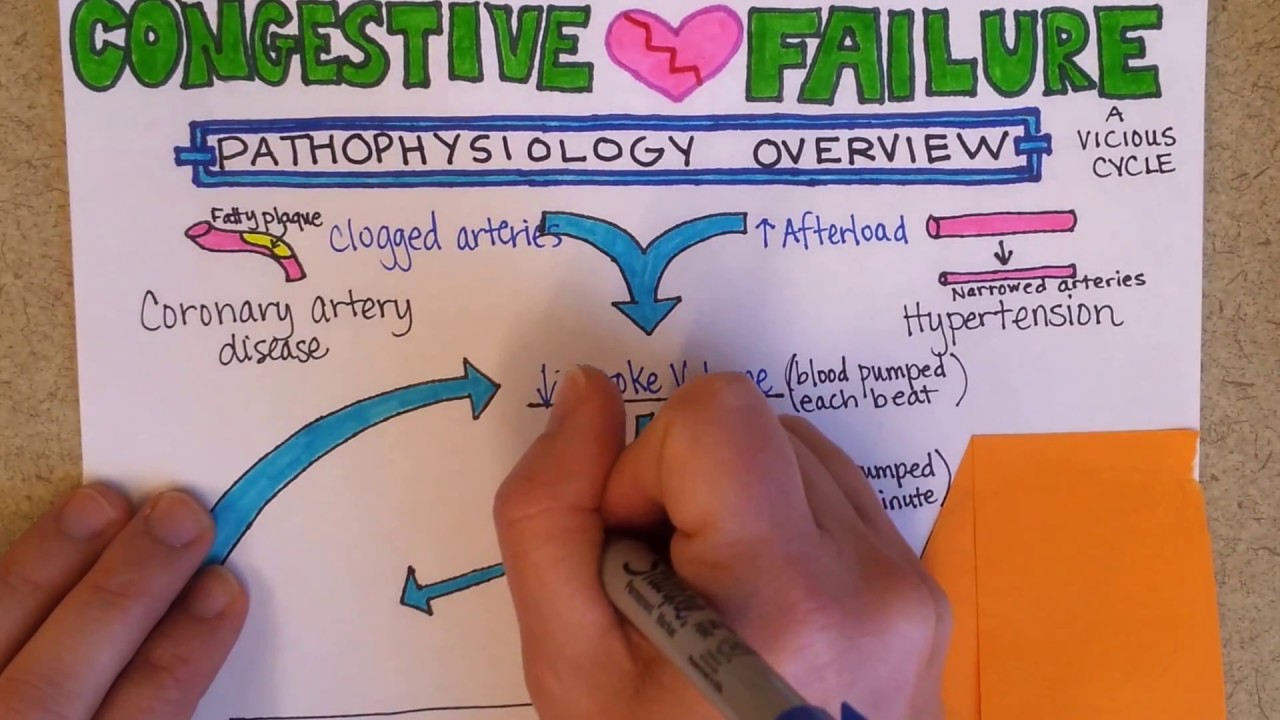
Congestive Heart Failure: Pathophysiology
334.7K
When left-sided heart failure occurs first, blood waits to enter the left side of the heart and accumulates in the lungs. This blood pooling causes pulmonary edema, which explains the 'congestion' in congestive heart failure - there is excessive fluid in the lungs.
Click to watch →

Congestive Heart Failure
226
In left-sided heart failure, the left ventricle cannot pump blood effectively toward systemic circulation, causing blood to backflow from the left ventricle to the left atrium. This blood then flows into the pulmonary veins, causing pulmonary congestion. The increased hydrostatic pressure in the pulmonary circulation leads to fluid leakage into the alveoli, resulting in pulmonary edema.
Click to watch →
Deep Dive
Normal pulmonary vascular anatomy and the typical distribution of blood flow in an upright chest radiograph.
Radiografia Cardiovascular
5.9K
Pulmonary circulation assessment on chest X-ray includes evaluation of normal, increased, and decreased pulmonary blood flow, as well as pulmonary venous and arterial hypertension. Normal pulmonary vascular distribution shows larger vessels at the lung bases due to gravity, with gradual tapering from central to peripheral vessels. The pulmonary artery trunk is normally less than 17mm. Pulmonary venous hypertension shows redistribution of blood flow to upper lobes (cephalization), dilated pulmonary veins, and Kerley lines (interstitial edema).
Click to watch →
Anatomia Radiológica do tórax
33.7K
Normal pulmonary vessels appear as branching structures that progressively reduce in diameter toward the periphery. Due to gravity, upper lobe vessels normally appear larger than lower lobe vessels. Equalization of the vascular pattern (inversion of the pulmonary vascular gradient) is an early sign of heart failure, though supine positioning can produce false positives. Vascular markers appear as discreet tree-branching patterns that become progressively thinner toward the periphery. This vascular distribution pattern serves as a critical diagnostic tool for assessing pulmonary and cardiac pathology.
Click to watch →
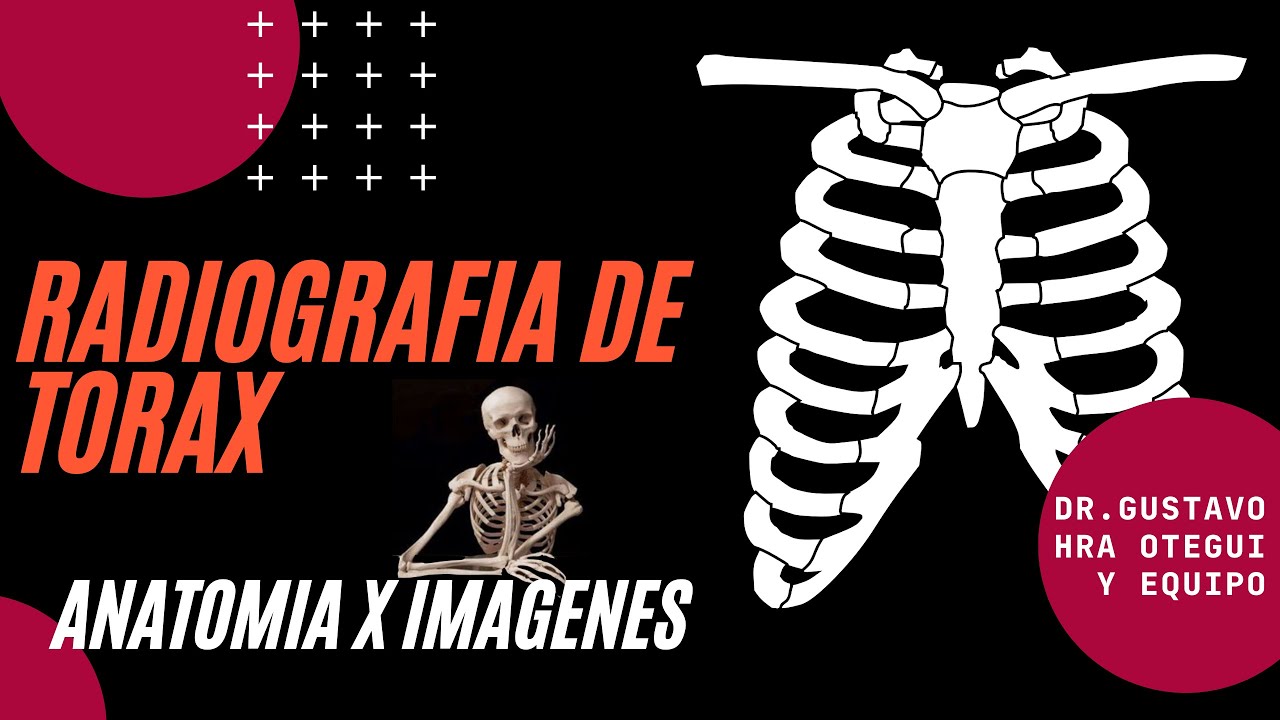
Radiografia de Torax
535
This segment covers pulmonary anatomy and vascular patterns. The pleura consists of visceral and parietal layers with a normally collapsed pleural space between them. Pleural effusion causes blunting of costophrenic angles as fluid accumulates in dependent areas. The right hemidiaphragm is normally higher than the left due to liver position. Pulmonary vascular distribution shows better ventilation in upper zones but more blood flow to lower zones. The trachea bifurcates at the carina into right and left main bronchi, with the right bronchus being shorter and more vertical.
Click to watch →

2 Plain Film Approach to Adult Heart Disease
2.4K
Five states of pulmonary vascularity can be assessed on chest radiograph: normal (lower lobe vessels more prominent due to gravity), pulmonary venous hypertension (cephalization), pulmonary arterial hypertension (centralized pattern with pruned periphery), increased pulmonary blood flow/hyperemia, and decreased pulmonary blood flow/oligemia. Grading pulmonary venous hypertension: Grade 1 (12-19mmHg) shows vascular redistribution; Grade 2 (20-25mmHg) shows interstitial edema with curly B lines; Grade 3 (>25mmHg) shows alveolar edema with batwing pattern. Normal interlobar pulmonary artery measures 9-16mm on upright films.
Click to watch →
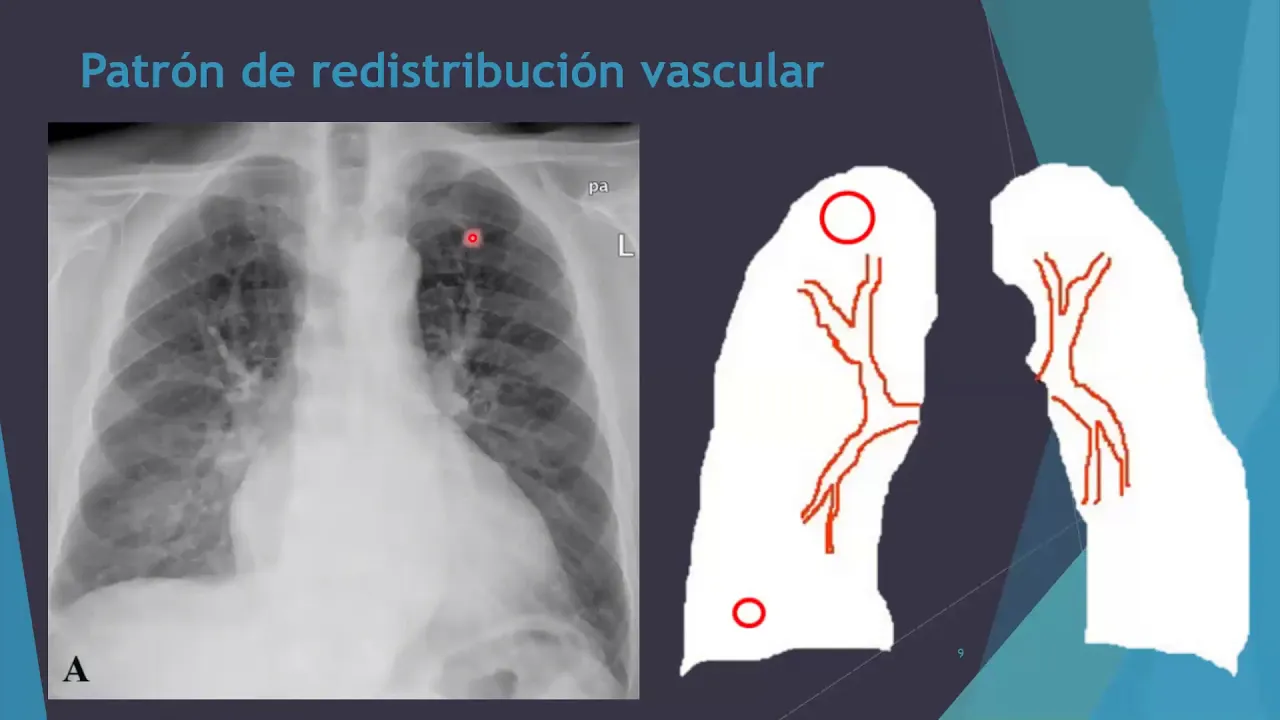
Patrones vasculares pulmonares PARTE I
8.3K
Pulmonary vascular patterns in chest radiology include normal distribution (uniform tree-like pattern from central to peripheral, with right hilum more caudal than left and basal vessels larger than apical due to gravity), redistribution (reversed pattern with larger apical vessels, caused by left-sided heart failure or mitral valve pathology when pulmonary venous pressure reaches 15-20 mmHg), pulmonary hypertension (enlarged pulmonary artery >3 cm and interlobar artery >16-17 mm, caused by increased pulmonary vascular resistance), and plethora (symmetric bilateral vascular dilation from increased pulmonary blood flow due to left-to-right shunts, hyperthyroidism, or anemia).
Click to watch →
Prerequisite Knowledge
- Concept 01Basic anatomy of the cardiothoracic cavity, including the heart chambers, major vessels, and lung lobes.
- Concept 02Fundamentals of chest radiography (CXR) interpretation, including how different densities (air, fluid, bone) appear on an X-ray.
- Concept 03Pathophysiology of congestive heart failure (CHF), specifically how left-sided heart failure leads to pulmonary venous congestion.
- Concept 04Normal pulmonary vascular anatomy and the typical distribution of blood flow in an upright chest radiograph.
Subsequent Learning
- Step 01Differentiating cardiogenic pulmonary edema from non-cardiogenic pulmonary edema (e.g., ARDS) on chest radiographs.
- Step 02Staging the severity of congestive heart failure based on radiographic progression (from vascular redistribution to alveolar edema).
- Step 03Correlating chest X-ray findings with clinical presentation (e.g., dyspnea, orthopnea, crackles) and laboratory markers like BNP.
- Step 04Monitoring therapeutic response and radiographic resolution of heart failure signs following diuretic treatment.
- Step 05Utilizing advanced cardiac imaging modalities, such as echocardiography and cardiac MRI, to evaluate underlying causes of heart failure.
Normal Baseline
CHF Signs
Normal Baseline
0:04Playing Section
- 1
Assesses baseline chest x-ray findings.
- 2
Confirms normal heart size and clear vessels.
Limitations of Chest Radiography and the Rise of Point-of-Care Lung Ultrasound (POCUS)
While chest X-rays (CXR) are traditionally used to diagnose congestive heart failure (CHF), they suffer from limited sensitivity and a 'lag effect,' where radiographic findings do not align in real-time with a patient's clinical status. An increasingly prominent alternative perspective advocates for Point-of-Care Lung Ultrasound (POCUS) as a superior diagnostic modality. LUS can detect pulmonary congestion (represented by 'B-lines') much earlier and with higher sensitivity and specificity than a CXR. Furthermore, POCUS is rapid, radiation-free, and performed at the bedside, allowing for immediate assessment of fluid status and treatment response, thereby challenging the standard reliance on delayed radiographic signs like cardiomegaly or Kerley B lines.
Deep Dive
Differentiating cardiogenic pulmonary edema from non-cardiogenic pulmonary edema (e.g., ARDS) on chest radiographs.
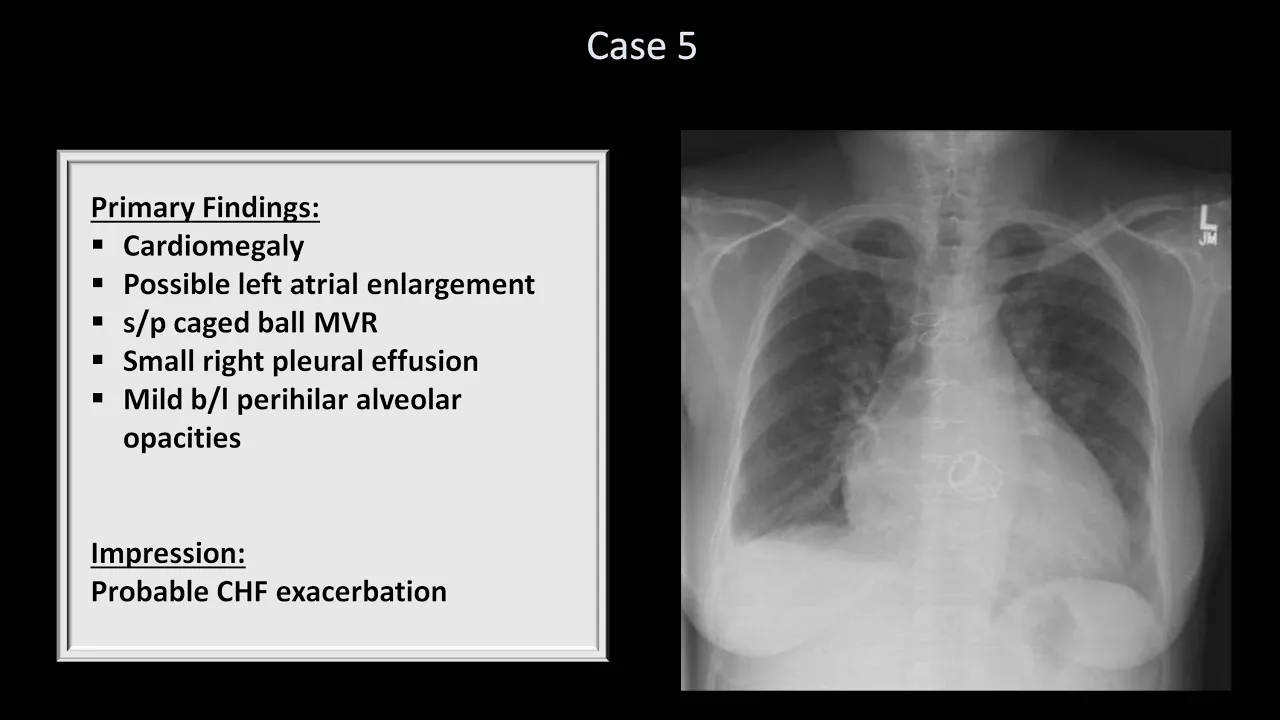
How to Interpret a Chest X-Ray (Lesson 10 - Self Assessment): Part 1
222K
Cardiogenic pulmonary edema results from elevated pulmonary capillary wedge pressure (left atrial pressure), commonly from heart failure. Non-cardiogenic pulmonary edema has normal wedge pressure and falls on the spectrum between acute lung injury (ALI) and acute respiratory distress syndrome (ARDS), distinguished primarily by severity of hypoxemia. Key differentiating features include cardiac size (normal in non-cardiogenic), regional distribution (patchy in non-cardiogenic), presence of air bronchograms, and absence of peribronchial cuffing. Causes include severe sepsis, pneumonia, and aspiration pneumonitis.
Click to watch →

NORCET Mini Mock Test 10 | Most Expected Questions for AIIMS NORCET with explanations #norcet10
1.7K
ARDS (non-cardiogenic) has normal pulmonary capillary wedge pressure with increased permeability. Cardiogenic pulmonary edema has increased pulmonary capillary wedge pressure due to left ventricular failure. Both present with pink frothy sputum and crackles, but the underlying mechanism differs. Pulmonary capillary wedge pressure is the key differentiating finding.
Click to watch →
Thoracic Radiology: Principles of Interpretation
119.2K
Distinguishing between cardiogenic and non-cardiogenic pulmonary edema is critical for appropriate treatment. Cardiogenic edema responds to diuretics like furosemide because excess fluid in the lungs is in the interstitial space and can be mobilized when preload decreases. Non-cardiogenic edema (from trauma, drowning, ARDS, sepsis) involves intracellular fluid accumulation that cannot be mobilized by diuretics. Clinical indicators include history of trauma or drowning, absence of cardiac disease signs, and acute onset. A diagnostic trial of furosemide can help differentiate: if the radiographic pattern improves within hours, cardiogenic edema is likely; if no improvement occurs despite hydration, non-cardiogenic etiology should be suspected. This distinction guides treatment selection and prognosis.
Click to watch →
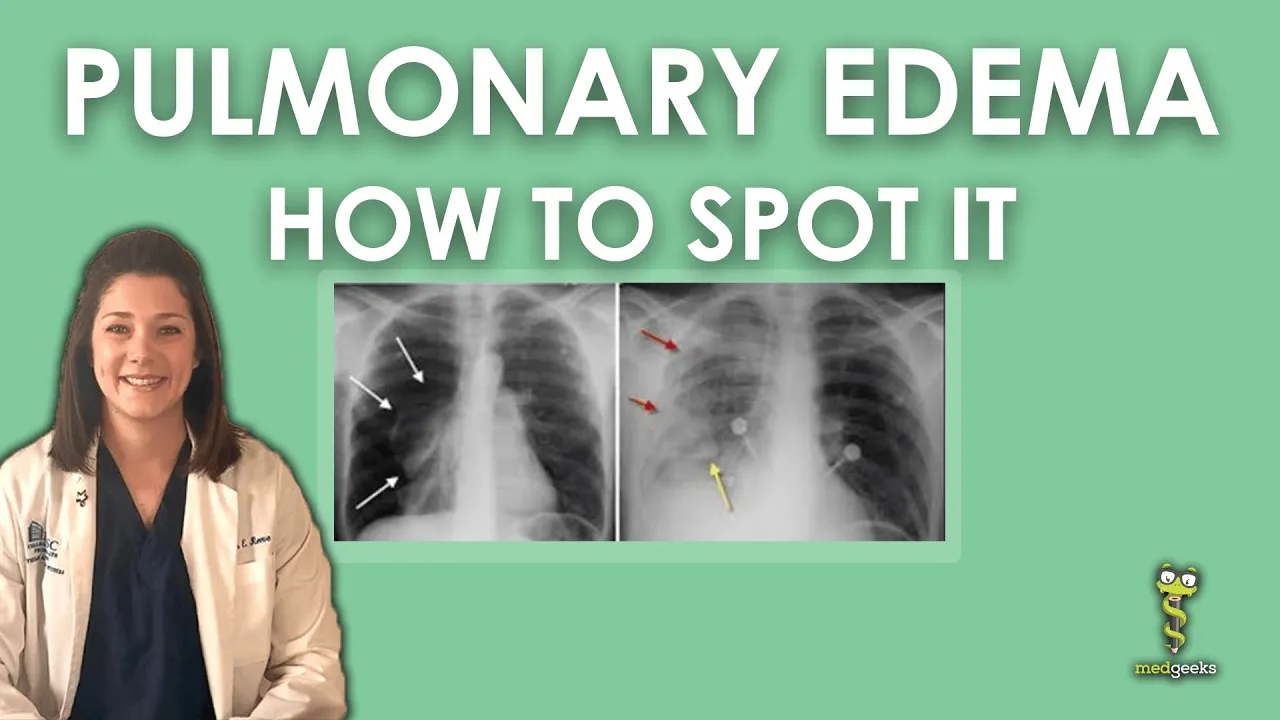
Pulmonary Edema Chest X-ray
78.9K
Pulmonary edema on chest X-ray results from disrupted Starling forces, with two main categories: cardiogenic (heart failure, hypertension, acute coronary syndrome) causing elevated pulmonary artery wedge pressure (>18 mmHg) and non-cardiogenic causes (ARDS, sepsis, pulmonary embolism, renal disease, high altitude) with PAWP <18 mmHg; clinical presentation includes dyspnea, orthopnea, and crackles, while chest X-ray shows pulmonary vascular congestion, enlarged hila, and alveolar infiltrates, requiring targeted treatment based on underlying etiology.
Click to watch →

Acute Respiratory Distress Syndrome (ARDS) | Clinical Medicine
214.7K
To diagnose ARDS, clinicians must rule out cardiogenic pulmonary edema as the cause of bilateral infiltrates. The most definitive test is Swan-Ganz catheterization, which measures pulmonary capillary wedge pressure; a value less than 18 mmHg confirms non-cardiogenic origin. Alternative diagnostic approaches include echocardiography to assess left ventricular function and diastolic pressures. This differentiation is critical because treatment strategies differ significantly between these conditions.
Click to watch →
Deep Dive
Staging the severity of congestive heart failure based on radiographic progression (from vascular redistribution to alveolar edema).

GAMBARAN FOTO THORAX GAGAL JANTUNG KONGESTIF...Bagaimana gambaran rontgen pembengkakan jantung?
2.9K
Congestive heart failure (CHF) progresses through three radiographic stages on chest X-ray: Stage 1 (redistribution) shows pulmonary vascular redistribution with increased vessel caliber in upper lobes and bronchial artery ratio >0.85; Stage 2 (interstitial edema) demonstrates Kerley B lines (short horizontal lines near costophrenic angles) and peribronchial cuffing; Stage 3 (alveolar edema) reveals alveolar consolidation, air bronchograms, and pleural effusion, with findings influenced by patient position and underlying lung disease.
Click to watch →

Congestive Heart Failure: Explanation of Chest X-ray Findings
22.2K
Congestive heart failure produces characteristic chest x-ray findings including cardiomegaly (cardiothoracic ratio >0.5), vascular redistribution (cephalization and increased artery-to-bronchus ratio), pulmonary venous congestion (hilar enlargement and vascular pedicle widening), pulmonary interstitial edema (curly B lines, peribronchial cuffing, and interlobar fissure thickening), pleural effusions, and in severe cases alveolar edema with a batwing pattern; these findings represent a spectrum from early to advanced disease severity.
Click to watch →
Grabación de la Clase de Insuficiencia Cardiaca Aguda del Dr Murillo 14/09/2020
221
Heart failure severity is classified radiologically: (1) Mild - cephalization of flow, interstitial edema (Kerley B lines, peribronchial cuffing), (2) Moderate - progression of interstitial edema, (3) Severe - alveolar edema with bat-wing appearance. Pulmonary capillary wedge pressure >25 mmHg indicates severe heart failure.
Click to watch →

CARDIOGENIC AND OTHER CAUSES OF PULMONARY EDEMA
848
Pulmonary edema progresses through three radiological stages: Stage 1 (PCWP < 18 mmHg) shows pulmonary vessel congestion; Stage 2 (18-25 mmHg) reveals interstitial edema with crisscrossing lines and peribronchial cuffing; Stage 3 (>25 mmHg) demonstrates alveolar edema with fluffy opacities and air bronchograms. Heart failure is classified by ejection fraction: HFrEF (<40%), HFmrEF (41-49%), and HFpEF (>50%). This staging guides prognosis and treatment intensity.
Click to watch →

Chest X Ray 7 Findings in 7 Minutes
7.5K
Heart failure is defined as insufficient cardiac output, divided into systolic and diastolic ventricular dysfunction, with three stages each having distinct radiographic features. Stage 1 shows cardiomegaly and redistribution of blood flow. Stage 2 shows pleural effusion, cuffing, and Kerley B lines. Stage 3 shows alveolar edema. The video demonstrates identifying congestive heart failure stage 2 through prominent pulmonary vessels, redistribution of blood flow, and peripheral cuffing.
Click to watch →
Deep Dive
Correlating chest X-ray findings with clinical presentation (e.g., dyspnea, orthopnea, crackles) and laboratory markers like BNP.

Approach to Symptomatology
5.9K
Chest X-ray findings help localize dyspnea etiology: hyperinflation (COPD), low lung volumes (pulmonary fibrosis), upper zone vascular prominence (early heart failure), enlarged central pulmonary arteries (pulmonary hypertension), bilateral pleural effusions (heart failure), unilateral pleural effusion (carcinoma/pulmonary embolism), patchy opacifications (pneumonia/interstitial lung disease), and pneumothorax (increased translucency). Laboratory investigations include CBC with hematocrit (detects anemia), metabolic panel (acid-base disturbances), ECG (ischemia/arrhythmias/ventricular hypertrophy), spirometry (obstructive vs restrictive disease), and BNP (ventricular stretch/damage).
Click to watch →

Heart Failure Explained - HFrEF vs HFpEF (Systolic vs Diastolic Heart Failure)
178.4K
Heart failure presents with pulmonary symptoms (dyspnea, orthopnea, paroxysmal nocturnal dyspnea) from pulmonary congestion and systemic symptoms (jugular venous distension, peripheral edema, hepatomegaly) from venous congestion. Diagnosis combines clinical assessment (bi-basilar crackles, peripheral edema, S3/S4 gallop, hepatojugular reflux) with laboratory testing (BNP/NT-proBNP >5000 pg/mL indicates poor prognosis) and imaging (chest X-ray for pulmonary edema, echocardiography for ejection fraction and valvular assessment). Risk factors include obesity, hypertension, diabetes, renal disease, and aging. HFpEF is more common in elderly females with higher comorbidity burden.
Click to watch →

Keperawatan Jantung
526
Diagnostic evaluation of heart failure integrates multiple modalities: (1) ECG with proper electrode placement (V1-V6) reveals sinus tachycardia; (2) Chest X-ray shows cardiomegaly, bilateral perihilar and basal infiltrates, Kerley B lines, and increased pulmonary vascular markings indicating pulmonary edema; (3) Laboratory findings include elevated BNP (950 pg/mL) indicating ventricular stretch, hyponatremia (128 mEq/L) from ADH release, and hyperkalemia (5.6 mEq/L) increasing arrhythmia risk. These findings correlate with clinical symptoms of dyspnea, orthopnea, PND, and hypoxemia, confirming decompensated heart failure.
Click to watch →
Pulmonary Edema Chest X-ray
78.9K
Pulmonary edema on chest X-ray results from disrupted Starling forces, with two main categories: cardiogenic (heart failure, hypertension, acute coronary syndrome) causing elevated pulmonary artery wedge pressure (>18 mmHg) and non-cardiogenic causes (ARDS, sepsis, pulmonary embolism, renal disease, high altitude) with PAWP <18 mmHg; clinical presentation includes dyspnea, orthopnea, and crackles, while chest X-ray shows pulmonary vascular congestion, enlarged hila, and alveolar infiltrates, requiring targeted treatment based on underlying etiology.
Click to watch →

ХСН. 22.02.24.
3.4K
Characteristic heart failure symptoms include dyspnea, orthopnea, paroxysmal nocturnal dyspnea, reduced exercise tolerance, fatigue, and peripheral edema. Signs include elevated central venous pressure, hepatoyugular reflux, third heart sound, displaced apical impulse, pulmonary crackles, and tachycardia. Laboratory diagnosis includes BNP/NT-proBNP assessment, complete blood count (anemia affects treatment), ferritin and transferrin saturation, electrolytes, creatinine, and GFR. BNP elevation results from myocardial stretching, with biological factors including sex (women higher), age (elderly higher), and BMI (lower BMI higher).
Click to watch →
Deep Dive
Monitoring therapeutic response and radiographic resolution of heart failure signs following diuretic treatment.
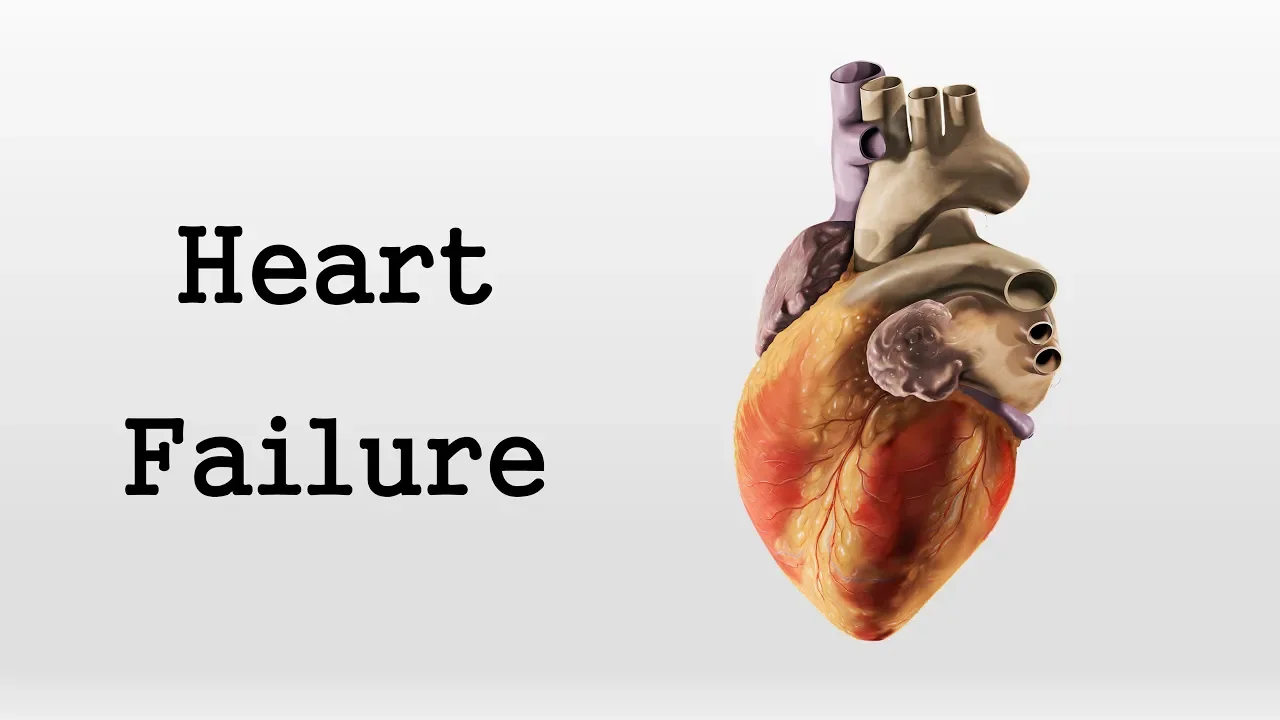
Heart Failure (Acute Decompensated Heart Failure)
149.3K
Telemetry is appropriate for the first 24-48 hours of acute heart failure admission but can be discontinued if patient improves, remains dynamically stable, and lacks significant arrhythmias while actively diuresed. Potassium and magnesium require daily monitoring. Multiple monitoring methods exist: ins and outs, daily weights, serial JVP, continuous CVP via central line, volume overload symptoms, and IVC ultrasound appearance. No single metric suffices; best practice avoids relying on only one method. Furosemide is the most common loop diuretic. For diuretic-naive patients, start with 20-40 mg IV; renal impairment requires higher doses. For outpatient users, start with twice their usual dose. Double dose if minimal response. Conversion guidelines: 80 mg oral furosemide ≈ 40 mg IV; 1 mg bumetanide ≈ 20 mg torsemide. IV thiazide (chlorothiazide) 30 minutes before loop diuretics may help refractory cases. Ultrafiltration is an option for non-responsive patients.
Click to watch →

II Simposio de Cardiología y Cirugía Cardiovascular
1.3K
Diuretic dosing in acute heart failure should be aggressive, with initial doses based on home therapy and clinical judgment. The logarithmic dose-response relationship means that small increases in dose produce disproportionately larger effects. The DUS trial showed that high-dose bolus infusion produces greater diuresis than continuous infusion without improving clinical outcomes. Diuretic response is monitored through urine output (less than 100-150 mL/hour indicates poor response), daily weight, clinical signs, and sodium urine concentration (less than 50-70 mEq/L indicates poor response).
Click to watch →
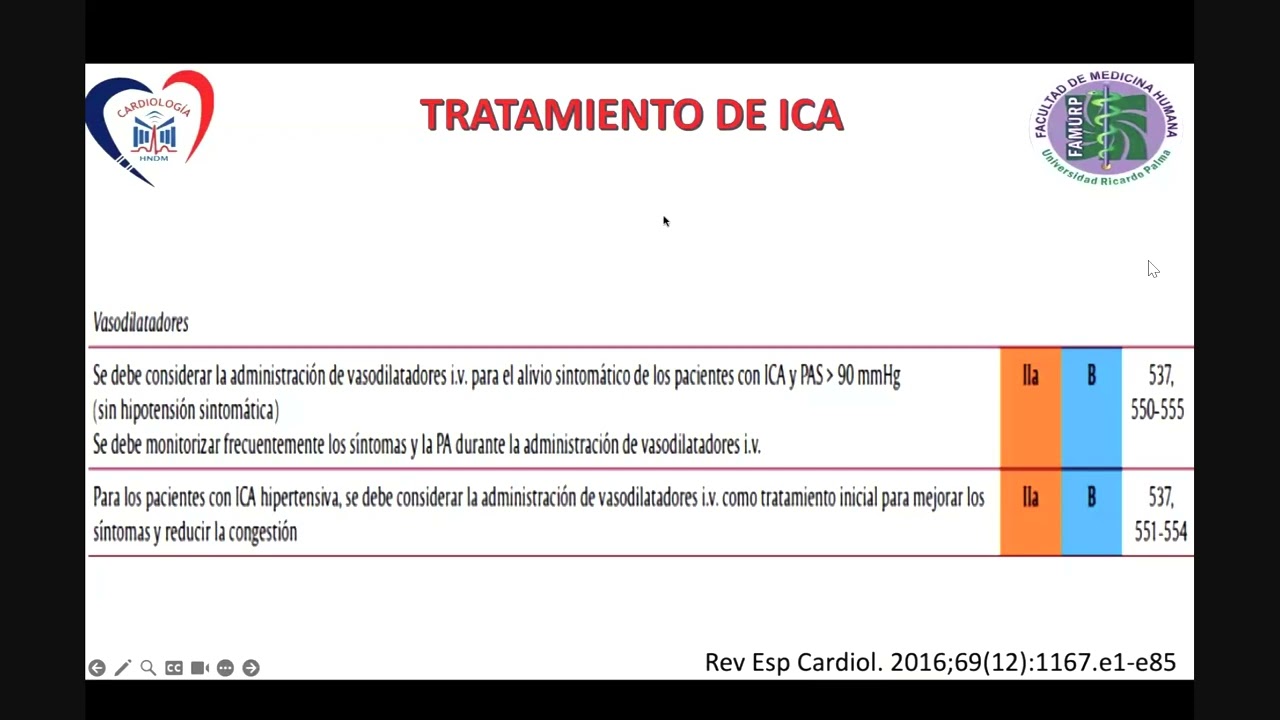
Insuficiencia cardiaca II - AngioCardiología - sem 5
358
Loop diuretics work by inhibiting Na-K-2Cl cotransporter, causing loss of sodium, chloride, potassium, magnesium, and calcium. In heart failure, tubular remodeling reduces diuretic responsiveness over time. Response is inadequate when urine output is <125 cc/hour or <250 cc in 2 hours. Evaluate response by urine volume (6 hours) or sodium excretion (2 hours). Good response: urine >100-150 cc/hour or sodium >50 mEq/L.
Click to watch →

Insuficiencia Cardíaca: Actualización Clínica con Mirada Generalista
663
Acute heart failure management requires phenotyping: vascular congestion (left-sided, orthopnea, B-lines) responds to vasodilators, while tissue congestion (right-sided, edema, elevated CA-125) responds to higher diuretic doses. Diuretic response assessment: initial furosemide 20-40 mg daily. If no response, measure urinary sodium at 2 hours post-furosemide. Adequate response: urinary sodium 50-70 mmol/L and urine output 100-150 mL/hour. If inadequate, double the dose. If urinary sodium <50 mmol/L despite escalation, add acetazolamide (if furosemide <80 mg/day) or hydrochlorothiazide (if furosemide >80 mg/day). Congestion-related renal dysfunction is common; if patient remains congested despite adequate urinary sodium, increase diuretic dose without fear of worsening renal function.
Click to watch →
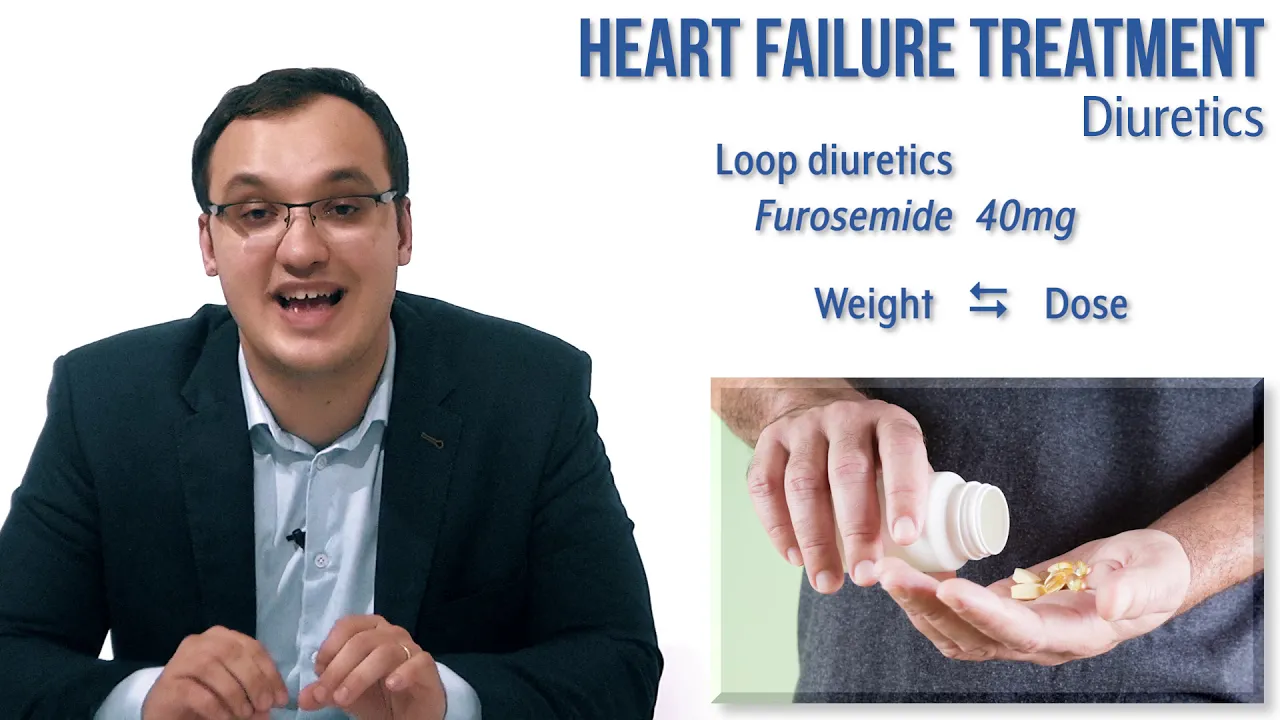
Heart failure: Treatment: Diuretics
29.3K
Furosemide is the primary loop diuretic used in heart failure treatment for all patient types, starting at 20-40mg oral daily and titrating upward weekly based on weight stability, with a maximum daily dose of 250mg (120mg twice daily); patients must monitor daily weight and report sudden increases of 4-5kg to their physician, while thiazide diuretics should be used cautiously in combination with loop diuretics due to increased risk of hypokalemia requiring electrolyte monitoring.
Click to watch →
Deep Dive
Utilizing advanced cardiac imaging modalities, such as echocardiography and cardiac MRI, to evaluate underlying causes of heart failure.

ND 08052021
305
Cardiac MRI is not a replacement for echocardiography as the first-line imaging modality for heart failure. Echocardiography remains the examination of first intention. However, cardiac MRI has specific applications, particularly when echocardiography has poor acoustic windows. It provides accurate volumes and ejection fraction measurements, and is the only technique that can assess both left and right ventricular function. Cardiac MRI enables classification of heart failure into reduced ejection fraction (HFrEF), preserved ejection fraction (HFpEF), or intermediate ejection fraction (40-49%). It can measure filling pressures and assess fibrosis through mapping techniques. The technique has excellent correlation and precision in volume measurements with high reproducibility. Cardiac MRI plays a crucial role in determining the etiology of heart failure through late gadolinium enhancement (LGE). There are three types of fibrosis: replacement fibrosis (cicatricial fibrosis following infarction), interstitial fibrosis (in remodeling and dilated cardiomyopathies), and focal fibrosis (seen in amyloidosis, sarcoidosis, or hemochromatosis). In ischemic cardiomyopathies, LGE shows subendocardial enhancement in the most vulnerable layers to ischemia. In non-ischemic cardiomyopathies, enhancement patterns vary: subepicardial in myocarditis, mid-wall in dilated cardiomyopathies, and diffuse in amyloidosis.
Click to watch →

CARDIAC DISORDER WITH THEIR MANAGMENT FOR NURSE STUDENTS
1K
Multiple diagnostic imaging modalities are used for heart failure evaluation including chest X-ray, echocardiography (cardiac ultrasound), cardiac MRI, and coronary angiography. These tests help assess cardiac structure, function, and identify underlying causes.
Click to watch →

Dr. Antonio García-Quintana: Técnicas de imagen, fundamentales para estratificar el riesgo de la IC
505
Cardiac imaging serves three fundamental purposes: diagnosis, etiological assessment, and prognostic evaluation. The clinical diagnosis of heart failure relies on syndromic assessment including clinical history, conventional radiology, ECG, and BNP levels. Echocardiography is essential for supporting etiological diagnosis, providing ventricular function assessment, valve pathology evaluation, pulmonary pressure estimation, and cardiac output calculation. Approximately 50% of heart failure patients have LVEF below 50%, and ventricular function is load-dependent. Echocardiography and cardiac MRI are the primary imaging modalities, with echocardiography being more widely available and cost-effective, while cardiac MRI provides superior tissue characterization but has limitations including higher cost and contraindications for certain patients.
Click to watch →

Falla Cardiaca
224
Advanced imaging for heart failure includes cardiac MRI (non-invasive, useful for amyloidosis, sarcoidosis, hypertrophic cardiomyopathy, and infections), coronary angiography (invasive, identifies ischemic causes and allows endovascular treatment), and endomyocardial biopsy (obtained during catheterization to determine etiology when other studies are inconclusive). These studies help identify specific causes and guide targeted treatment.
Click to watch →

Pato CV (última): Míocardiopatias e Insuficiencia cardíaca.
275
Echocardiography shows enlarged ventricular cavities, thin walls, depressed systolic function, and atrial enlargement. Spontaneous contrast indicates thrombus formation. Transesophageal echocardiography provides better visualization of structures and valves. Cardiac MRI is the reference non-invasive technique for quantifying volumes, ejection fraction, and characterizing myocardial tissue properties (edema, thrombi, interstitial expansion). Endomyocardial biopsy helps determine specific causes. Coronary angiography rules out ischemic causes and identifies surgically treatable conditions. The diagnostic approach should be tailored to the clinical scenario and suspected etiology.
Click to watch →
Normal Baseline
CHF Signs
Normal Baseline
0:04- 1
Assesses baseline chest x-ray findings.
- 2
Confirms normal heart size and clear vessels.
Limitations of Chest Radiography and the Rise of Point-of-Care Lung Ultrasound (POCUS)
While chest X-rays (CXR) are traditionally used to diagnose congestive heart failure (CHF), they suffer from limited sensitivity and a 'lag effect,' where radiographic findings do not align in real-time with a patient's clinical status. An increasingly prominent alternative perspective advocates for Point-of-Care Lung Ultrasound (POCUS) as a superior diagnostic modality. LUS can detect pulmonary congestion (represented by 'B-lines') much earlier and with higher sensitivity and specificity than a CXR. Furthermore, POCUS is rapid, radiation-free, and performed at the bedside, allowing for immediate assessment of fluid status and treatment response, thereby challenging the standard reliance on delayed radiographic signs like cardiomegaly or Kerley B lines.
Basic anatomy of the cardiothoracic cavity, including the heart chambers, major vessels, and lung lobes.
Fundamentals of chest radiography (CXR) interpretation, including how different densities (air, fluid, bone) appear on an X-ray.
Pathophysiology of congestive heart failure (CHF), specifically how left-sided heart failure leads to pulmonary venous congestion.
Normal pulmonary vascular anatomy and the typical distribution of blood flow in an upright chest radiograph.
Differentiating cardiogenic pulmonary edema from non-cardiogenic pulmonary edema (e.g., ARDS) on chest radiographs.
Staging the severity of congestive heart failure based on radiographic progression (from vascular redistribution to alveolar edema).
Correlating chest X-ray findings with clinical presentation (e.g., dyspnea, orthopnea, crackles) and laboratory markers like BNP.
Monitoring therapeutic response and radiographic resolution of heart failure signs following diuretic treatment.
Utilizing advanced cardiac imaging modalities, such as echocardiography and cardiac MRI, to evaluate underlying causes of heart failure.
91.1K views208likes2:24@BrighamRadClerkshipOriginal Release: 2009-09-20
today we're going to discuss the findings of congestive heart failure this is a chest x-ray on a patient who is at Baseline there is no uh clinical symptoms of pulmonary edemas such as shortness of breath parisal Eternal dnia or evidence of congestive heart failure we see that the heart size is normal the pulmonary vessels are sharply marginated and that they are normal in caliber notice the costophrenic angles the salai are sharp and we do not see any curly V lines these findings indicate that this is a normal chest x-ray without evidence for congestive heart failure he returns to us now with shortness of breath and pedal edema and we notice first that the heart has markedly increased in size since a prior study if you look carefully we could even see that the left atrium which is this opacity sitting under the Corina is enlarged of particular interest I think is the caliber of the epopee vessels we call this vascular redistribution or calization there is distension of the pulmonary veins uh due to the engorgement from increased left-sided pressures so we see that the heart has become dilated the left atrium has become Dil dilated the pulmonary veins have become dilated they are greater in caliber than the vessels at the bases now let's take a look at the costophrenic salside we can see here that it's blunted this lung should go all the way to the edge instead we see that there's development of plural fluid look at this area here this is a really nice example of curly be lines which represent thickened intralobular scepter due to edema in addition notice how blurred and indistinct the pulmonary vasculature is this is indicative of interstitial pulmonary edema so the findings here are those of congestive heart failure which confirm the clinical impression
Up Next

23:00
Understanding CT Windows, Levels, and Densities in Radiology
@sewingrad
95.3K views•2015-07-12

48:47
Graphic Medicine: Comics for Collaborative Healthcare Communication
@nationalpatientadvocate
189 views•2023-12-04

10:28
Neuroanatomy: Central and Peripheral Nervous System Divisions Explained
@AKLECTURES
136.2K views•2014-09-20
3:05
Stages of Labor and Vaginal Birth | Childbirth Animation
@nucleusmedicalmedia
52.1M views•2017-08-18
Related Study Plans & Knowledge Roadmaps
Structured learning paths in Medicine
medicine
Abnormal LFTs: Diagnostic Workup & Pathology
01Liver Anatomy and Basic Physiology
02Introduction to Liver Function Tests (LFTs)
03Hepatocellular vs. Cholestatic Patterns
+ 3 more learning modules
12h6 modules
Explore Roadmap
medicine
Analyzing Blood Smears: RBC, WBC & Platelets
01Introduction to Blood Components & Smear Preparation
02Normal Morphology of Blood Cells
03Erythrocyte Pathologies & Morphological Variants
+ 2 more learning modules
12h5 modules
Explore Roadmap
medicine
Mechanical Ventilation: Waveforms & Alarms
01Anatomy and Physiology of Breathing
02Introduction to Mechanical Ventilation & Core Modes
03Ventilator Settings and Waveform Interpretation
+ 2 more learning modules
12h5 modules
Explore Roadmap
medicine
Neuro Exam: Localization & Stroke Syndromes
01Foundations of Neuroanatomy and Vascular Supply
02The Neurological Examination: Step-by-Step
03Principles of Neurological Localization
+ 3 more learning modules
18h6 modules
Explore Roadmap