









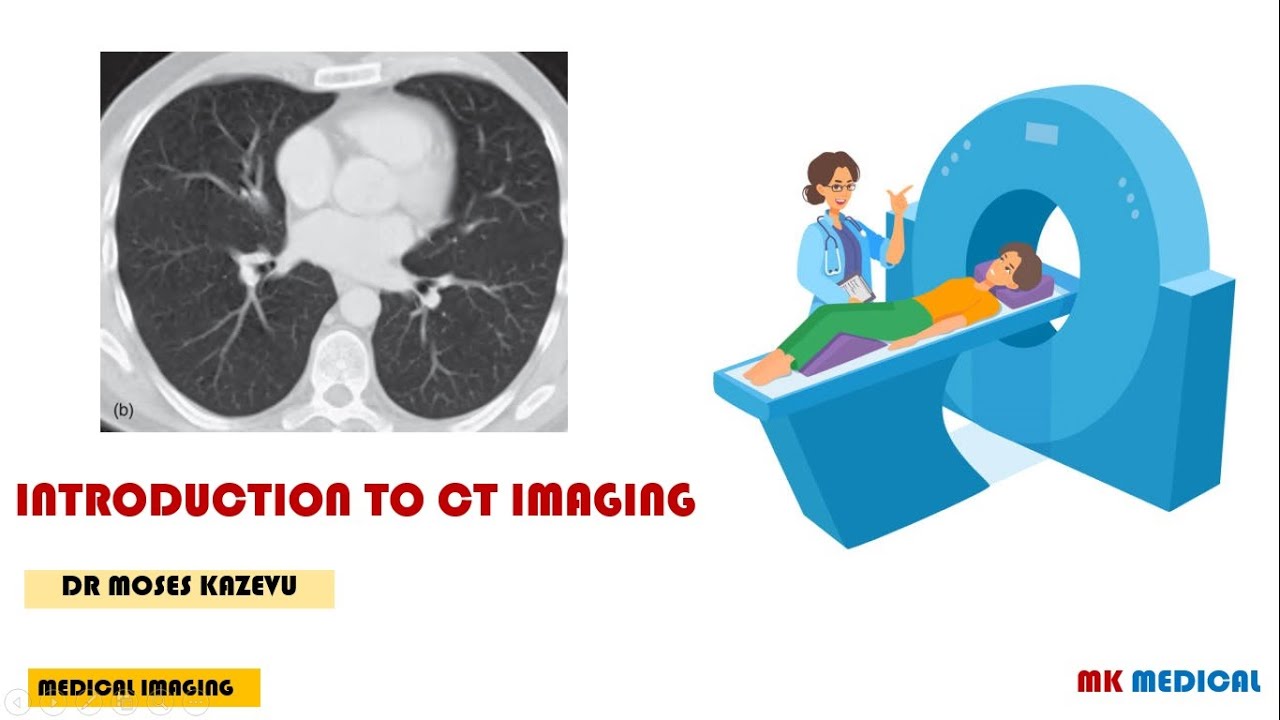






CT windows and levels are essential tools that radiologists use to optimize the visualization of different tissues on CT scans by adjusting the range of Hounsfield units (HU) displayed within the 256 shades of gray available on a computer monitor; the window width determines how many HU values are shown (affecting the range of densities visible), while the level determines where this window is centered on the HU scale (affecting which specific densities are emphasized), allowing radiologists to focus on specific tissue types such as lung parenchyma, soft tissues, or bone by selecting appropriate window settings like lung windows (W=1500, L=-700), soft tissue windows (W=400, L=+40), and bone windows (W=2000, L=+300).
Understanding CT Windows, Levels, and Densities in Radiology
Added:Basic physics of Computed Tomography (CT), including how X-ray tubes and detectors rotate to capture cross-sectional slice data.
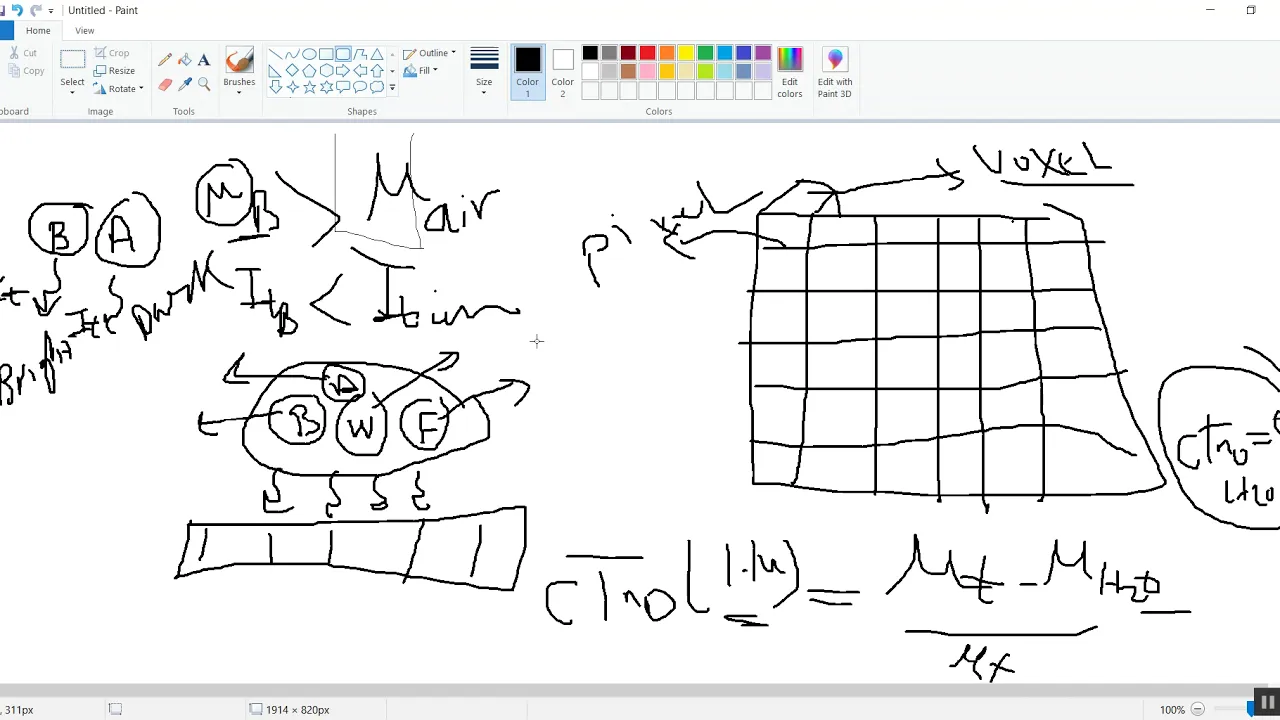
The concept of tissue attenuation, specifically how materials of differing densities (such as bone, water, fat, and air) absorb X-ray radiation.
Fundamentals of digital imaging representation, particularly how 3D anatomical voxels are mapped to 2D grayscale pixels.
Clinical interpretation of standard CT window presets, such as brain, lung, bone, and soft-tissue windows, to diagnose specific pathologies.
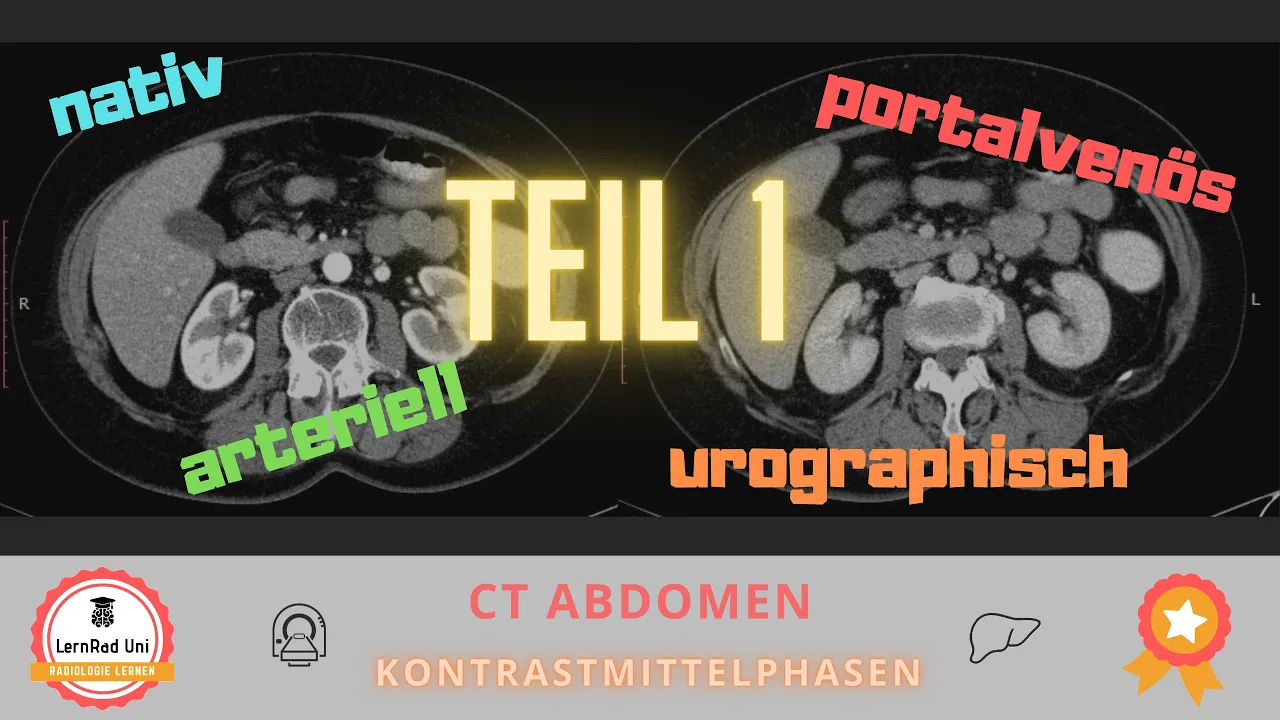
The role of contrast media (IV and oral) in altering tissue attenuation values (Hounsfield Units) during multi-phase CT scans.
Identification of common CT artifacts (e.g., beam hardening, partial volume averaging, and metal streaks) and their impact on density accuracy.
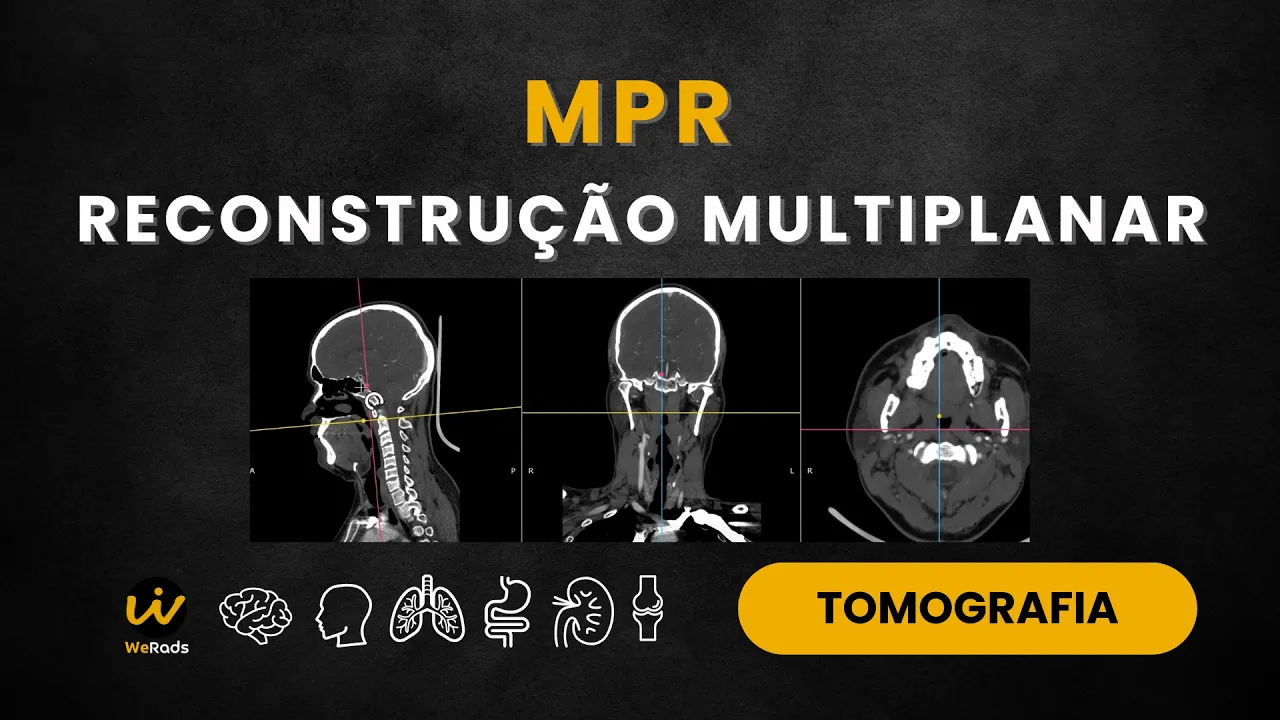
Advanced reconstruction and visualization techniques, including Multiplanar Reconstruction (MPR) and Maximum Intensity Projection (MIP).
95.3K views1.6Klikes23:00Original Release: 2015-07-12
hello this short talk is intended for medical students and Junior residents and other trainees on CT Windows levels and density so what we're talking about here is how Radiologists and other health professionals view a patients digital CT data either within on the pxs workstation or some other form of image display program such as within the patients electronic uh medical record you may have noticed how we go through a set of CT slices from any one series on a patient CT scan in several different displays before making our final interpretation so first of all there's a couple of things I want to clarify here the difference between a CT reconstruction versus the different windows that we display the information on reconstructions require the image processing of the raw data commonly by the technologists but sometimes by the radiologist using specialized software programs the data can be processed in different ways desending depending on what data we wish to obtain from it or what tissues we wish to display so typical reconstructions might include a soft tissue a bone and a lung reconstruction we can also reconstruct in multiple planes as well as the coronal and sagittal planes we can do some specialized planes along the organ of any along the plane of any organ of Interest we can do 3D reconstructions such as surface reconstructions maximum intensity projection reconstructions these are those you might have seen before for example uh where we display only the contrast within the aort or a minimal intensity projection where we just look at the air for example with a uh CT colonography study studies can also be reconstructed into different slice thicknesses we may want very thin slices to look at the lung perena or the temporal bone and thicker slices to look um at a study that's just looking generally through the abdomen for example here uh here are two slices of a patient CT scan and the technologist has taken the raw image data and applied two different software algorithms to reconstruct the slices through the thorax on the left it has been reconstructed with a conventional soft tissue algorithm and you can see that while you can see the lung prena fairly well it's a little blurry now both of these are being displayed in the lung windows that we'll talk about in a minute on the right the data has been reconstructed using a typical lung algorithm this is a very crisp and contrasty algorithm and it gives us very nice resolution you can see here of these small vessels within the lung parena this is the same set of data from the same patient but we're looking a little lower down here in the thorax at the heart again this is the smooth smoother soft tissue reconstruction that the technologist has given us a set of images and on the right is the same set of data again looking with a soft tissue window for a lung reconstruction and so you can see as we did in the lung that this is a much grainier much crisper much more contrasty appearance to the soft tissue structures and this is less pleasing for the radiologist ey to be able to interpret so we're going to look at the soft tissues on a soft tissue Recon construction you see it's smoother it's a little easier to read and we're going to look at the lung on the lung reconstruction on the left here we have a 3D reconstruction of the pelvis in a patient who has multiple complex pelvic fractures this image can be rotated and manipulated in various different ways for the orthopedic surgeon to be able to work out uh what type of surgery they wish to perform on the right is one of the types of multipler reconstructions the technologists can perform for us in this case to be able to look at the thoracic aorta you can see this doesn't look like a normal Anatomy here but what the technologist has done has laid out the aorta from the heart up here down through the diaphragm and this is a patient who has an atic dissection and this allows us to see just in one single image the plane of that dissection as it comes out from the ascending into the descending aorta so just to reiterate reconstructions are done usually by the technologist or by some separate type of software on a different workstation by the radiologist to allow the uh raw CT data to be manipulated into different projections or different slices depending on what our clinical question is the different windows are the different ways that we can visually display the digital information from any set of CT slices and there are a wide variety of windows um common windows that are used are lung Windows soft tissue Windows bone Windows brain Windows blood windows and you may have seen any of these used in your clinical practice so for example this is the same set of axial reconstructions and it's a soft tissue reconstruction on a patient and I've got it displayed here in three different ways this is a soft tissue window so it's optimized to look at the soft tissues of the media stum a lung window on the bottom left optimized to look at the lung parena and then again the same set of data but now displayed on a bone window which is going to allow us to look at the osus structures of the thorax and what you notice here is that we really can't evaluate the lung parena at all on the soft tissue window we can't evaluate the media stum on the lung window and we really can't evaluate much of anything else other than the bones on the bone window and this is why for thoracic abdominal CT scan the minimum that we're going to use is these three different Windows to look through the entire data set now I'm going to go on further to describe what I mean by a window and what I mean by a level but where can we find this information well if you look at the corner of any CT image um which corner it's in will depend on what type of CT scanner you have you will see down somewhere a little W and an L so this particular CT scan has a window 1500 and a level ofus 700 any tissue window is actually a combination of these two values a window and level and they're going to vary depending on how the what the display window is to understand what these windows and levels values mean and why we use them we have to go back to some very basic CT physics so densities of the different tissues on CT are measured in what's called hfield units which is often abbreviated to hu I'm going to use a bit of an oversimplification here because it just makes the math a lot easier so the hfield units range from a value of minus 1,000 to plus 1,000 now in actual fact in modern CT scanners they can go up to um plus 4,000 or greater um but for all intents and purposes for um tissues other than metal um nothing's going to be greater than than a th houndsfield units so let's just concentrate on those zero houndsfield units in the middle here is going to be water so we have here a potential of 2,000 hounds filled units across our range of soft tissue densities as the tissues get denser they have increasing houndsfield unit values so what are some common hfold unit values of soft tissues that we might see on a CT scan of the thorax so if we drew a region of interest on fat for example that's going to be around minus1 100 hfield units if we drew it on air in the lung it's going to be around minus 800 houndsfield units uh this is a contrast enhanced CT scan if we look on muscle this is probably going to be around 40 to 60 houndsfield units if we looked at the density of this intense contrast sitting in Thea here um this is going to be oh probably 1 to 200 houndsfield units and then we can look at two different types of bone we could look at some mallery bone here in the vertebral body that's uh probably going to be around uh 150 say to 200 and then the dense cortical bone as we can say here in the posterior facet joints which is going to be around three to 400 hfield units you can see on this one image we have densities from minus 800 hfield units to 400 hfield units so what's the problem here well the conventional computer display is going to show 256 different Shades of Gray for a CT image but our eye can only detect about a 6% change in grayscale so let's do the math so I just said we can detect about a 6% difference in Gray shade level so 6% is 17 Shades of Gray Shades of gr now if we have 2,000 houndsfield units that we're trying to display in all in one image how many HFI units is that per shade of gray that's going to equal about 8 Hound fill units per shade of gray however I've already said that we can only detect 17 different Shades of Gray so 256 Shades of Gray over 17 * 8 HFI unit per shade of gray originally means that tissues have to differ in density by about 120 Hound filled units if we're trying to look at put this whole 2,000 um hfold units in one image before we can detect a density difference between them and obviously this is not a helpful number uh the difference in between normal and pathological tissues is usually much much less than 120 hfield units so here's a head CT of a patient who has a large Hemorrhage in their right basil ganglia was a hypertensive Hemorrhage now if we looked at the densities on here that fres fresh Hemorrhage there is going to be about 70 houndsfield units there's no contrast on this study the gray matter is going to be about 40 houndsfield units the white matter about 25 27 houndsfield units and the CSF here near water so that's eight and then if we had air in the sinuses um which we don't have here but we have air outside the patient and that's about - 900 Hound filled units the very dense bone in the skull is going to be about plus 800 houndsfield units so you can see that although there is quite a range of densities on this image between -900 hfield units and plus 800 we're only actually interested in this image in a fairly narrow range probably from about eight for the CSF to um 70 um for that area of hemorrhage and we want to really be focusing in that area to see some very very small changes in density for potential es schea in this patient now this image here has been shown on a typical brain window which we'll explain further in a minute but what about if we Tred to look at this image on display that showed all 2,000 hounds filled units over that 256 Shades of Gray this is what that image would look like as you can see there is no diagnostic information that could be obtained for it whatsoever so what we want to do is focus down those 256 Shades of Gray into a very narrow window or region of Hansford units which contain the relevant densities for the tissue that we're interested in and we just can't look at all tissues just with the one window so so if we're interested in looking at the brain which has a very narrow range of densities within the gray white matter and ventricles we may be wanting to concentrate our range of densities into a very narrow range here if we're looking in the abdomen we might want to be concentrating it into a somewhat larger range of densities right here students often ask why acute hemorrhage in the brain appears white where acute Hemorrhage in the abdomen in the absence of contrast appears only slightly denser than the surrounding soft tissues so let's look again at these two windows we have our narrow brain window and our slightly wider abdominal window hemorr acute Hemorrhage as it's beginning to clot has a density of around 70 Hound filled units and so that is going to put that density right around here on these two windows now you can see on the brain window this is going to be right at the top end of the scale so it's going to appear white remember everything from here and above is white however on the abdominal window it's still within the range of gray values and so therefore it's not going to appear white so remember that I talked about two figures for every window display Windows used generically to mean the lung display or the abdominal display the bone display and so on there are two values of w and L the W the W stands for window the window is how many hounds filled units are displayed within those 256 Shades of Gray the L or the level stands for where is this window centered so let's go back to our graph so we may have a narrow window perhaps that window is only 100 houndsfield units wide and it's here so our W might be 100 here and our level which is the midpoint might be centered at 50 a different example might be a window of say a th000 but it has a level that is us 500 that's where the center of the window is you could have the same size window but you could have it move further up and have a level of plus 500 and it's going to be centered up more towards the osus range up here for example so that would be a window of window of plus 100,000 and a level of plus 500 now when we have a specific window for example here we'll come back to that soft tissue window everything that has a density that is less than that number bottom number of hansfield units is going to be black on the image and everything that is greater than that top level of the window shown is going to be white so you really can make very little diagnostic information from these ranges of densities all of our diagnostic information is going to be concentrated right here so here is a head CT of a patient who has a subdural hematoma following head trauma this is expl this is displayed on the typical uh brain window in this case this has a uh window of 70 and a level of 40 so looking on our little houndsfield unit um graph from before this window is centered at level 40 houndsfield units and it's 70 houndsfield units wide that means that anything that is five houndsfield units or less will look black and anything that is 75 HFI units so half of 70 is 35 sented at 40 so that makes it 75 hfield units is going to be looking uh White so when we look at the image we can't really distinguish the black of the CSF which is zero from the black of the air which is you know minus 900 handsfield units they both look the same gray scale and it's also pretty difficult for us to distinguish the dense blood here which is probably around 75 80 HFI units acute blood from the ajent skull which is plus 7 or 800 uh Hound fi units here the image has been just displayed a little bit differently the windows been made a little bit wider it's now H 90 HFI units and the level is a little bit different here at 68 hfield units and now we can distinguish between the density of the skull and the density of the J and subdural himage so this is called a vascular window and it's one of the three windows that a radiologist is going to look at any head C and they're going to want to look at a bone window for the skull a brain window to look at the brain parena and then a vascular window to look for areas of acute Hemorrhage close to the skull this is a commonly used lung window that we use to look at chest CTS and in this case the window is500 and the level is- 700 here's a soft tissue window for looking for at the medyum or the abdomen in this case we have a window of 400 and a level of + 40 and in thisa last case we have a typical bone window to look at the skeleton and in this case the window is 2,000 and the level is+ 300 so you can see that these values vary fairly dramatically depending on what tissues we want to look at and just to reiterate why we do this we want to concentrate those 256 Shades of Gray into the range of expected densities within the tissues that we are interested in because our eye can only detect a 6% difference in Gray scale so how do we um call up these various different display Windows to be able to do this it's obviously going to depend a lot upon the particular um pack system or image display system you're using um on this one you right click it's going to come up with an option one of which is window width and measure sometimes this is on the toolbar and then you have these various pre-selected windows that you can choose from they often have hotkey uh shortcuts from the keyboard and then of course you can just manually adjust these by usually doing a left click drag on the mouse sometimes a right click depending on your particular system depending on your system moving it forwards and backwards might change the window and moving it from side to side may change the level that may um flip on the different systems but effectively what we do as Radiologists is we push the button and we wiggle it around till the image looks okay in summary reconstructions are usually done by the technologist or they may be done by the radiologist and require specialized software and have performed on The Raw data Windows however allow us to display any reconstruction differently depending on what type of information we wish to obtain from that image and generally speaking a radiologist is going to display any one a sequence from a CT scan under multiple different Windows a window is how many HFI units within those 256 shades are going to be displayed anything lower than the window is going to look black anything higher than that window is going to look white the level is where is that window centered in the houndsfield units so the window is how many houndsfield units are displayed within those 256 Shades of Gray are the range of soft tissue densities and the level is where is the center of that window so any densities which are lower than the level minus half of the window will be black and any soft tissue densities are greater than the level plus half the window are going to be white so the wider the window the larger that number the greater range of tissue densities you're going to see but the less contrast in the image and the narrower the window the smaller that number the less range of densities you're going to be able to see but there is going to be more contrast between the different densities and generally speaking the denser the tissues you want to look at the higher the level needs to be and the less denser tissues the lower level although I've used a lot of numbers in this talk um just want to reiterate that for most people these numbers are not important I just want you to understand the various concepts of what we're talking about with window and level and why it's very important to look at every CT scan on these different Windows to be able to see the abnormalities you're looking for thank you very much
Up Next

20:56
Chest CT Anatomy: A Comprehensive Introduction for Medical Students
@christopherlack2222
3.2K views•2021-07-27

48:47
Graphic Medicine: Comics for Collaborative Healthcare Communication
@nationalpatientadvocate
189 views•2023-12-04

10:28
Neuroanatomy: Central and Peripheral Nervous System Divisions Explained
@AKLECTURES
136.2K views•2014-09-20
3:05
Stages of Labor and Vaginal Birth | Childbirth Animation
@nucleusmedicalmedia
52.1M views•2017-08-18
Related Study Plans & Knowledge Roadmaps
Structured learning paths in Medicine
medicine
Abnormal LFTs: Diagnostic Workup & Pathology
01Liver Anatomy and Basic Physiology
02Introduction to Liver Function Tests (LFTs)
03Hepatocellular vs. Cholestatic Patterns
+ 3 more learning modules
12h6 modules
Explore Roadmap
medicine
Analyzing Blood Smears: RBC, WBC & Platelets
01Introduction to Blood Components & Smear Preparation
02Normal Morphology of Blood Cells
03Erythrocyte Pathologies & Morphological Variants
+ 2 more learning modules
12h5 modules
Explore Roadmap
medicine
Mechanical Ventilation: Waveforms & Alarms
01Anatomy and Physiology of Breathing
02Introduction to Mechanical Ventilation & Core Modes
03Ventilator Settings and Waveform Interpretation
+ 2 more learning modules
12h5 modules
Explore Roadmap
medicine
Neuro Exam: Localization & Stroke Syndromes
01Foundations of Neuroanatomy and Vascular Supply
02The Neurological Examination: Step-by-Step
03Principles of Neurological Localization
+ 3 more learning modules
18h6 modules
Explore Roadmap