







![[46] Geospatial Data and Maps with Python (Christy Heaton)](https://i.ytimg.com/vi/EXHG-bLGT0Y/maxresdefault.jpg)











This video demonstrates a complete no-code GIS workflow for selecting optimal wind farm locations by integrating multiple spatial criteria: importing wind speed data from the Global Wind Atlas, defining an area of interest, applying buffer operations (2km from power lines and roads, 500m from protected areas), performing intersection and subtraction operations to identify suitable areas, clipping to the area of interest, matching with wind data using crop raster operations, and styling the final output for visualization.
No-Code Wind Farm Site Selection Workflow in GIS | Tutorial
Added:Basic GIS concepts, including understanding vector and raster data structures, layer layering, and coordinate reference systems (CRS).
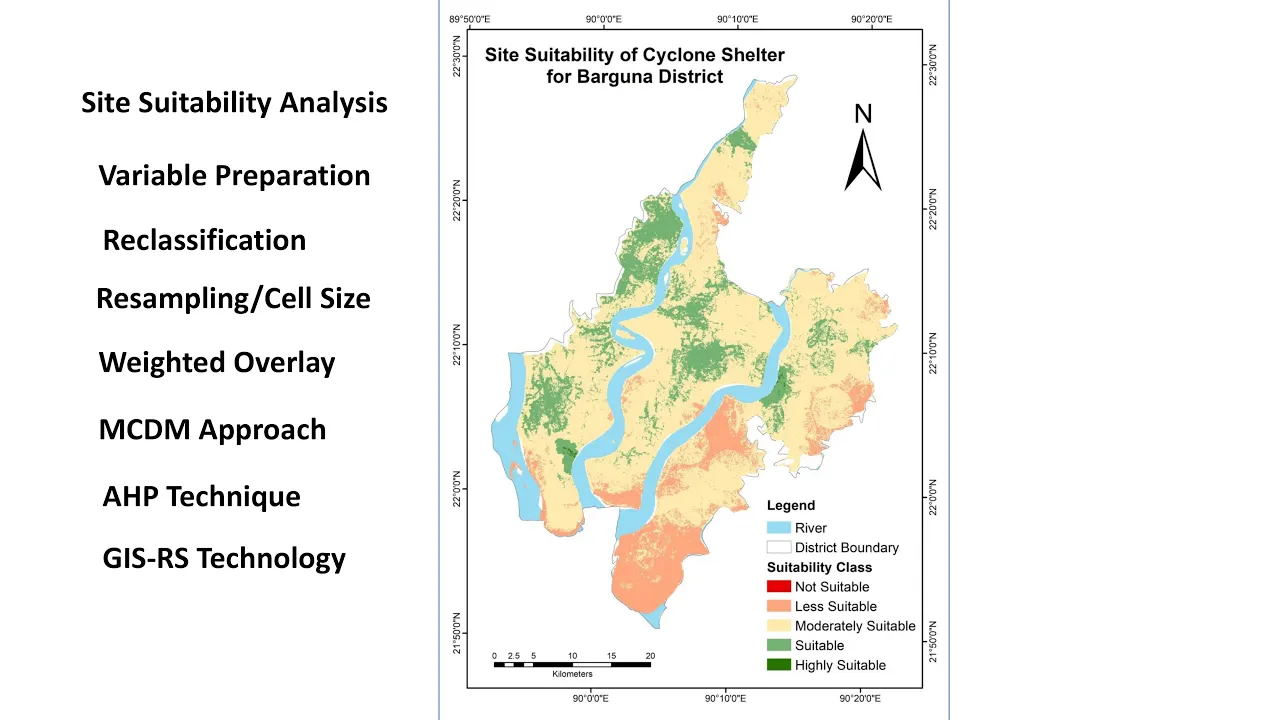
The fundamental logic of Multi-Criteria Decision Analysis (MCDA), specifically how different spatial criteria are weighted and combined for suitability mapping.
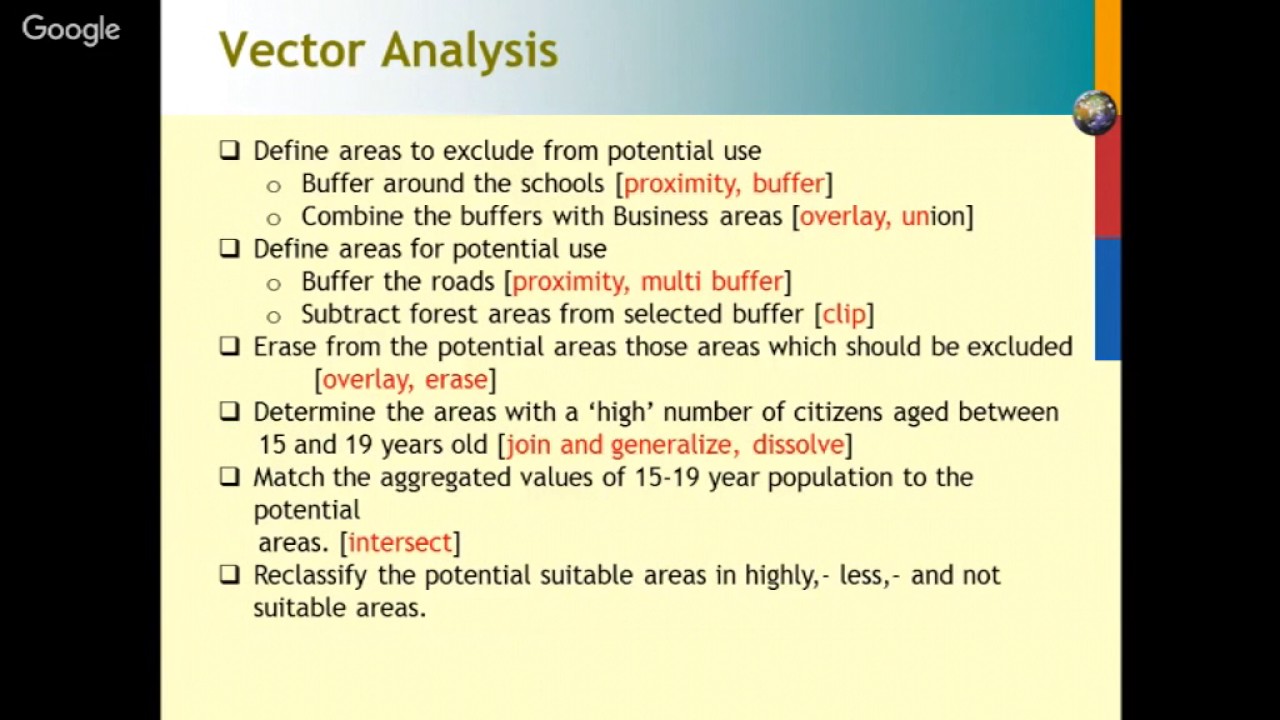
Common spatial analysis operations such as buffer creation, proximity/distance calculations, and boolean overlays (intersection, exclusion).
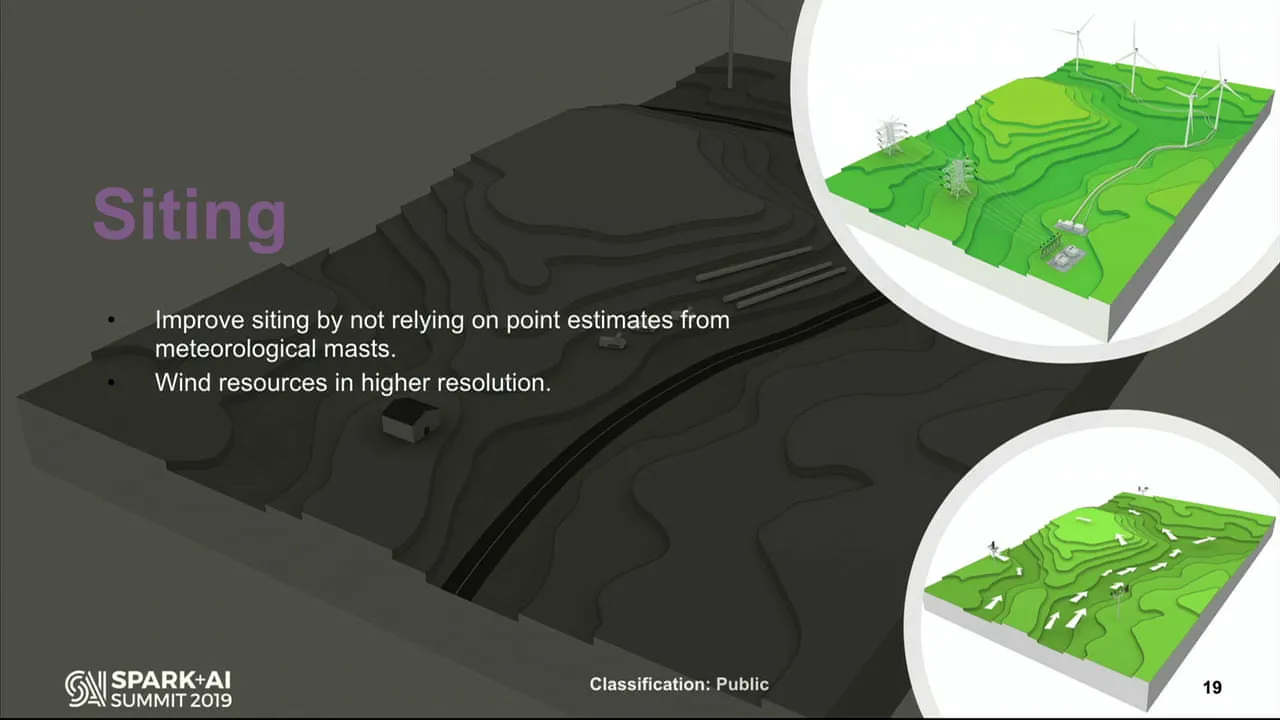
Key factors influencing wind turbine placement, such as average wind speeds, grid connectivity limits, accessibility constraints, and environmental exclusion zones.
Implementing advanced Multi-Criteria Evaluation (MCE) techniques, such as the Analytic Hierarchy Process (AHP) or Fuzzy Logic, to refine suitability scoring.
Automating the site selection workflow using visual programming tools (like ArcGIS ModelBuilder) or scripting (Python with ArcPy or PyQGIS) for scalability.
Performing localized impact assessments, including viewshed analysis (visual impact), noise propagation modeling, and shadow flicker analysis for the selected sites.
Integrating GIS suitability outputs with energy estimation software and financial models to calculate Levelized Cost of Energy (LCOE) and Annual Energy Production (AEP).
252 views10likes8:33Original Release: 2025-07-03
Hello, hello, hello. It's Anna from Atlas. In this video, we will look into sight selection in renewable energy and more specifically in wind power. I have previously made a video of site selection in solar energy that you can find in my guides. I also link it here.
But now we will look into wind power.
Wind energy sounds a bit strange. So, let's call it wind power, wind turbines, wind farms. You know, there is a very complete workflow that you can make in Atlas. And now I will show you it all.
So, let's go. So this is basically what we want to create. So just to give you a little preview of what the end result will look like. So suitable areas with the wind speed. Um and then I can also show you how the workflow will look like. So here is the complete workflow that we will create. Start by bringing in some data. We have integrations here on the right side under data actions.
And here if we click see all we get to global wind atlas. And let's click that one. you have you can choose a different speed but let's just go with the default and yeah we are in the spot around I mean it takes the closest raster tile so we can just import and we get what's around and we have the tile so it looks like this cool we have um from blue it goes from slower wind to red higher can you say higher slower slower you know uh more intense wind and yeah this one is a raster their image that's styled in color range. So right now the other thing that we want to create is our area of interest and we can just make a circle so it's easily understandable. So you have the tools here on the bottom in the toolbar and here you have drawings and circle and you can go roughly to the center and just drag out and I mean we can make it a bit bigger and then we can just uh click away. And now we can double click and take it to whatever spot we like. Maybe here on the right side there's a bit more uh possible places. So let's just have it there. And then if you click away you have saved your um area of interest. So let's rename it as well. Cool. Now we have our data and now it's time to go to workflows. So here on the left side you have the different sides of Atlas data builder, workflows and forms and we will go to workflows. So here we have the example workflow that we will recreate.
So let's go and build one from scratch.
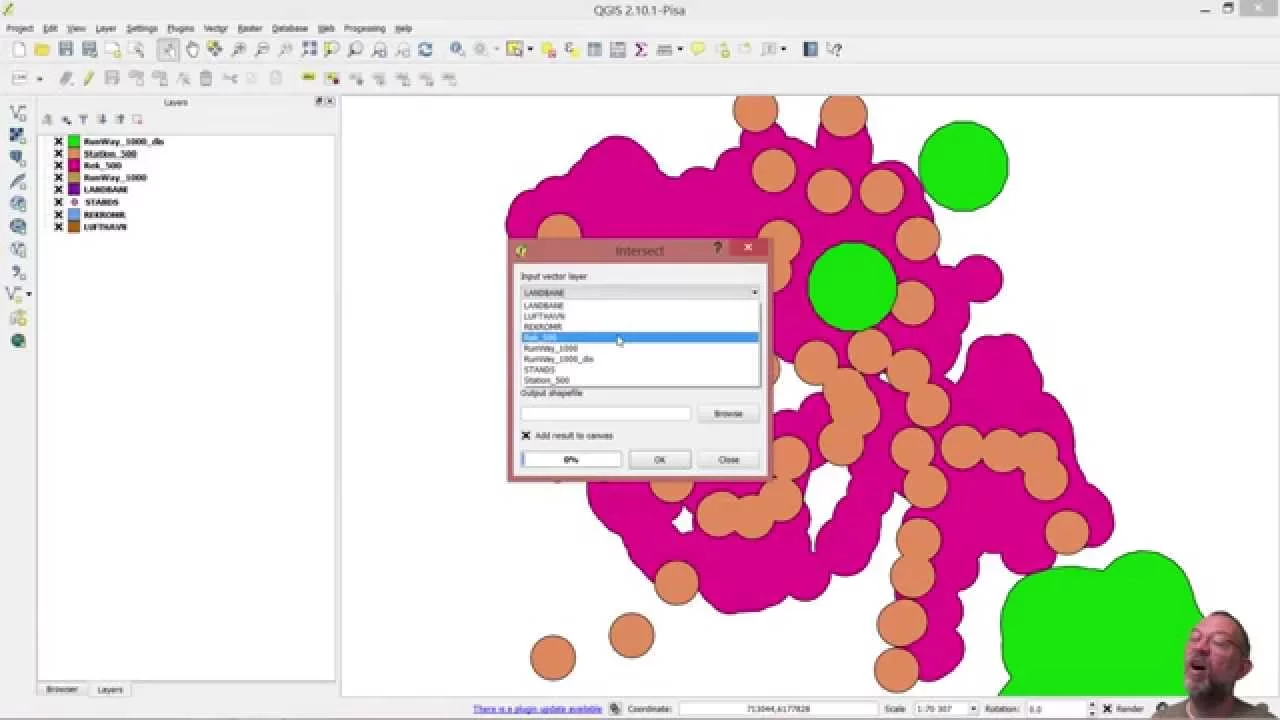
And we will just basically start by bringing in our area of interest. So this is our starting point. And now first thing we need to start looking into we create suitable areas and we want to of course analyze it by certain parameters. I know there can be tons and tons of different uh ways to find suitable areas for wind farms. I'm not an expert in this, but what I have learned is that we can at least look into what's close to the grid. Are there some roads close by for the infrastructure to be yeah moved in there? And then at the same time, we need to look at distance to protected areas for example because there we can't be too close by. But okay, let's bring in this data with our other integration open street map. So here on the right side blocks, we have it here. Um possibly one day also the wind outlet will be directly here but right now let's use this and let's search for power and power line and then we have that we need to connect just drag and drop and let's bring another so that we can look into the roads we can already connect the two and then we click and let's type highway because that's the tag for different types of roads. So, let's bring in some bigger roads like motorway. Let's search that again. Trunk and maybe primary like this. Okay, cool. And then one more. And that's the protected areas. So, we want to be far away from those. So, let's just add that too. And let's click that one. So, we just search for protected areas like this. And then, of course, we can't be too close to this. We can have some buffer zone. So let's bring in some buffer operations for each of these. So again just drag and drop and then I think 2,000 m so 2 kilometers is okay distance to power line and also to the road. So let's add the same one. And I click dissolve so that the buffer uh geometry is just one because it doesn't make any sense that it would be all separate ones for all the uh parts of for example the power line because it's possibly in many parts. So let's do the exact same thing for the roads. So 2K and dissolve. And then last but not least, I think it's enough if we have some 500 m to protected areas. Please let me know if I'm completely wrong here. Like I said, I'm not an expert in Jessine Atlas, but unfortunately not in a wind power, but okay, cool. And now we need to find out um where do these areas match. So we need to bring intersection operation so that it's for sure spots where both of these conditions are true.
And then we need to kind of do the opposite. So subtract where is this one true but this one not? Let's go forward.
And now we have those subtracted. So now that we have made the subtract um did I say substract before? It's a hard word for a non-native speaker. But now we need to clip the area from our area of interest again. So let's bring in clip operation and let's bring in the area of interest data set again. Let's just bring it here and let's just add both.
We want to take just a node. So now what we have now are just the suitable areas and we can already bring in this save to data set. So export uh so that we get it to the data side so that we have already this one. So let's just call this one suitable areas like that. Okay, cool.
And then we want to bring in the wind data finally. So we need to match the wind data with the suitable areas. So let's bring it in here. Then we need to use crop raster operation because this wind data is raster. So let's bring that in so that we just crop the wind data to the suitable areas vector layer. So now let's bring in the last piece of the puzzle. So save as data set and this will be kind of our like main output. So workflow output and you know what we have created the net and I think we are ready to run it. So let's go to the blue button and run the workflow. So you can see it working. These are already run and then it goes on goes on step by step and there we are. We already got the suitable areas and now we got the workflow output. So both if you want to look at these separately here in the map view you can just click that one. You can also click on the bottom and bring in the map view. It zooms in for you. So these are like I said just a vector layer just the suitable areas based on these parameters. Um but then if we want to look into the last one this looks a bit different. So this is now a raster layer of the wind um clip to the suitable areas. So let's go to back to the data side. And here we are. Let's zoom in there. And this is our output right now. Um, but it's not very descriptive because it's just the basic raster image styling. So, we need to go click the layer. Sorry, too fast or styling and it will open the styling panel, layer panel, whatever you want to call it here on the right side. And right now, you can see that the visualization type definitely is image like I said. Um, so we need to change it into color range. So, immediately better. um you see more, you understand that the darker parts are faster, there's more wind in the other parts, but you can also go ahead and change the color. You can go to diverging, different color palettes, and you can edit the range. So, um how much color range do you have here? So, how big are the differences? Let's just keep it like this. And then, I mean, we don't really need to do anything else. We can just look into the suitable area. Um we don't need the fill there. And we can maybe make it a bit darker. So it just gives you these nice outlines a bit and then just make it a bit thicker. Um okay, not that thick whoop like this maybe. So we properly see what are the suitable areas and what is the wind there. And now we are ready. This is how you run a site selection workflow for wind power in Atlas.
Up Next

40:21
Suitability Analysis with Model Builder in ArcGIS | Step-by-Step Guide
@Wanasolo
60.1K views•2012-12-04

12:54
Triumph of Orthodoxy Icon: Byzantine Art & History Explained
@BenCallan
2.1K views•2024-08-06

9:49
FastAPI vs Flask vs Django: Choosing the Right Python Web Framework
@TechWithTim
302.5K views•2024-05-26

1:42
Game of Thrones Opening Credits: A Cinematic Analysis
@gameofthrones
46.3M views•2011-04-18
Related Study Plans & Knowledge Roadmaps
Structured learning paths in General & Interdisciplinary Studies
general-studies
Elevator Engineering: History, Physics & Cities
01From Hoists to Safety Brakes: The Dawn of Vertical Lift
02Hydraulic vs. Traction: The Engineering Physics of Elevators
03Modern Speed, Safety, and Algorithms
+ 2 more learning modules
12h5 modules
Explore Roadmap
general-studies
Rubber: Material Science, History & Geopolitics
01Origins of Natural Rubber & Mesoamerican History
02The Chemistry of Natural Rubber & Vulcanization
03The Geopolitics of the Rubber Boom & Colonization
+ 2 more learning modules
12h5 modules
Explore Roadmap
general-studies
Containerization: Evolution, Logistics & Trade
01Ancient Trade & Bulk Cargo: Amphorae to Barrels
02The Industrial Revolution & Cardboard Packaging
03The Containerization Revolution: Malcom McLean
+ 2 more learning modules
12h5 modules
Explore Roadmap
general-studies
Textile Tech: Evolution, Labor & Global Impact
01Pre-Industrial Textiles: Handloom & Cottage Industry
02Mechanization: The Spinning Jenny to the Power Loom
03The Factory System & Global Labor Transformation
+ 2 more learning modules
10h5 modules
Explore Roadmap