


















Root-cause analysis tools such as 5 Whys, Fishbone diagrams, KT Problem Analysis (IS/IS NOT), and 8D provide systematic approaches to identifying and addressing problems, with the key principle being that without immediate and continuous use, these skills decline by approximately 90% after 30 days; effective implementation requires integrating these tools into organizational workflows, providing coaching through simulation-based training, and using escalation matrices to match problem complexity with appropriate analytical techniques.
Root-Cause Analysis Tools and Their Applications in Manufacturing
Added:Understanding of basic manufacturing workflows and common quality control metrics, such as defect rates, yield, and downtime.
The conceptual distinction between addressing immediate symptoms (containment actions) versus resolving underlying systemic failures (root causes).
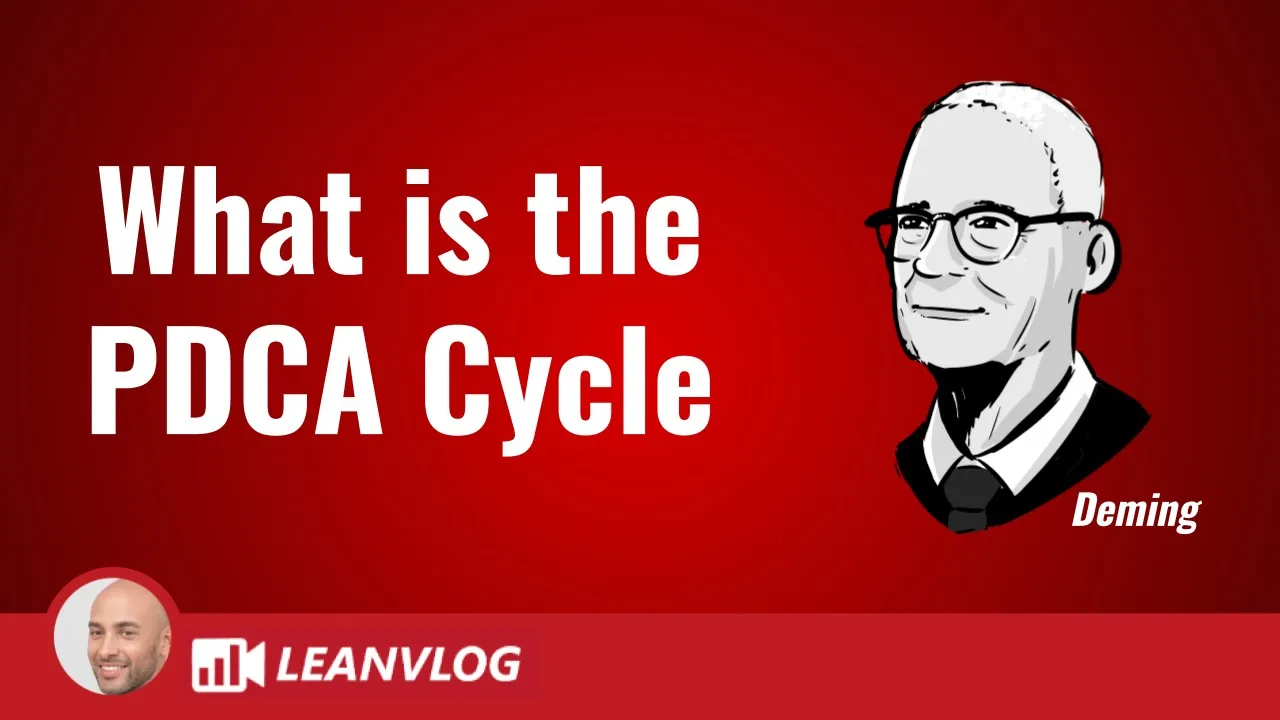
Familiarity with continuous improvement frameworks such as the Plan-Do-Check-Act (PDCA) cycle or Lean manufacturing principles.
Basic proficiency in data collection and categorization tools, such as check sheets and Pareto charts, to identify and prioritize problems.
Design and implementation of formal Corrective and Preventive Action (CAPA) procedures to track and verify the effectiveness of solutions.
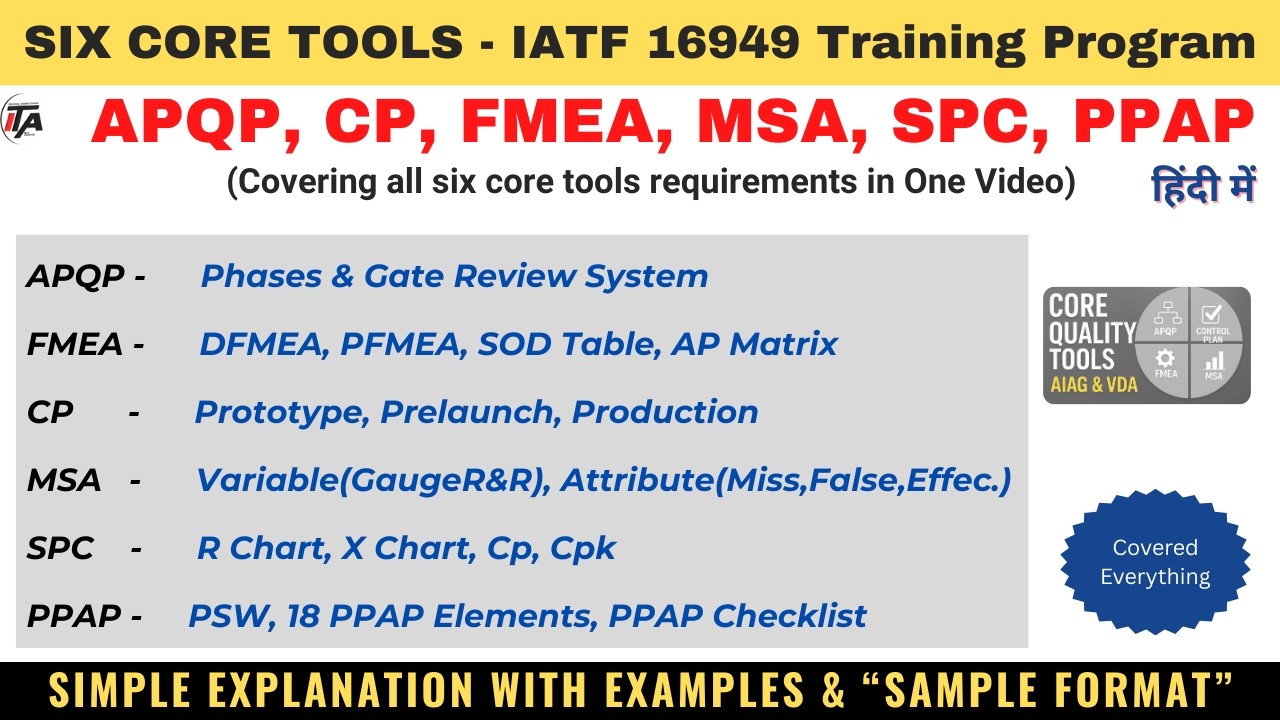
Proactive risk assessment methodologies, specifically Failure Mode and Effects Analysis (FMEA), to anticipate and mitigate failures before they occur.
Integration of root-cause analysis tools into larger Six Sigma initiatives, particularly within the DMAIC (Define, Measure, Analyze, Improve, Control) phase framework.
Application of Statistical Process Control (SPC) to continuously monitor manufacturing stability and trigger root-cause investigations when anomalies arise.
84.9K views683likes1:10:42Original Release: 2017-11-01
hello and welcome to today's industry week webcast root-cause analysis tools and how to use them sponsored by kepner-tregoe my name is steve mentor i'm the executive editor with industry week before we begin let me explain how you can participate in today's presentation first if at any time you're having audio difficulties or slides are not advancing simply hit your f5 key to refresh your webcast console if you have any technical difficulties during today's session please press the Help button on your player console to receive assistance in solving common issues this webinar technology allows you to resize the presentation by clicking the maximize icon or by dragging the lower right corner to enlarge the window we welcome your questions during today's event in order to submit your questions to today's presenter simply type your question into the question window on the left-hand side of your screen and then hit the submit button we'll be answering as many questions as possible during the Q&A session that will follow the main presentation but please feel free to send in your questions at any time and we'll add them to the queue please also be aware that today's session is being recorded and will be available on the industry week web sites within the next week for you to review you'll be notified by email when the archive is available on your console the kepner-tregoe logo is hotlinked so if you want to visit their website during this webcast you can click on a logo in a new window will open this will not take you out of the webinar i'd now like to introduce our presenter Michael Curran Hayes is the global practice leader in kepner-tregoe 'he's operational excellence and service excellence efforts in the Americas Michael provides executive leadership for a range of consulting and training services in these regions including client specific integrated teams of KT professionals his expertise is in process business process improvement operational improvement and strategy formulations clients he has worked with include Siemens Johnson & Johnson Pfizer Novartis and bristol-myers Squibb as well as various government regulatory agencies including the FDA and USDA and with that Michael the floor is yours hey thank you very much good afternoon good evening wherever you are appreciate everybody attending about an hour of taking an hour out of your time today I'm going to be going over the root cause analysis tools should be something that everybody finds interesting because it's something that I'm fascinated with having me done this for about 15 years for Katie um as you can see all of this sat through RCA sessions in our careers and there's a lot of people that sort of look like this button-down pompous typically the technical experts who feel like they already know the solution and are wondering why they are involved in it but as you can see that occasionally the meetings get pretty quiet and people fall asleep and then you get other people that everybody came in to do some sort of root cause analysis process and what they end up following is the one the guides in the dark suit he's got the expert suit on so they followed his process but I'm going to try to do today is make sure that you find ways to manage those meetings as well as finding ways to manage the people within those meetings and get them to use the root cause analysis tools the other piece that I'm going to work on is around human performance problems that's as we work in the industries that we work in and as I work with various clients that tends to be one of the top three issues that we have in there so I'm going to talk about a model around root cause analysis for people problems um and when you get into the root cause process you know I'm going to show you various tools that allow you to manage your people and one of the things that we found the KT is that this was interesting statistic that we've actually discovered and learns it's a pretty accurate around adults and learning is that without immediate use of learning new root-cause analysis tools or continuous use of root-cause analysis tools that they have those skill sets begin to decline by about 90% after 30 days and that's a really bad factor and what we're trying to do in KT and with the KT Kappa program that we run is make sure that the expectations set around the use of root cause analysis tools actually meet what you're expecting to have happen and actually exceed those particular pieces so before I get started what I'd like to do is do a quick poll there's a lot of root cause analysis tools out there in the world with myself and a couple colleagues we pulled together a few as you can see when you scroll down there's brainstorming five why's fishbones cause-and-effect fall tree and they move on and on and on and on around a number of different tools and I apologize if one of your favorite tools is not in there but why don't we take about 30 seconds and please click on as many of these tools as you use currently where you work okay it looks like we're populating them pretty quickly and then we have a lot of people out there give you a few more seconds to finish the population okay why don't we go ahead and stop the poll looks like we look at this five why's which is not surprising I used almost my 90% of the people fishbones is up there cause and effect and F meas agree with that although I won't be covering F meas and this one but I will be covering fishbones five why's a little bit of cause and effect brainstorming I'll talk a little bit about so the ones that people seem to gravitate the most towards are actually the same ones that I tend to use when I'm working with clients and I find my clients using so what you find from kepner-tregoe and I'll drop into Katy because that's how we call ourselves we have a program that's called Katy Kappa and it's been designed for root cause analysis as in the manufacturing and quality space especially for regulated industries although it works in all kinds of industries that's sort of where its genesis was from starting in the middle typically in our program we do some sort of Diagnostics with clients and then if you move to the right with the arrows typically the Diagnostics talk about process improvement around some some areas can be workflows can be SOPs can be all kinds of things there's an element of training part of what we believe in is passing on skillsets to people so that they're capable of doing the work for themselves once we leave the operations and then over in the left hand side from the capital program you've got change management which is apart typically when you're introducing or changing how you do root-cause analysis or improving how you do root-cause analysis it becomes a change management program so there's an element of that on the last one on the left which is pretty important as leadership alignment we can do all the things to the right of that but unless we have our leadership team and our leaders within the organization aligned and understanding the new tools and the new processes or the change in the processes it's going to be very difficult to make all this work so it's a fairly comprehensive program with about five different levers it's been highly successful it's built around our proprietary tools this is what's kept us in business for about 55 years so far and we work in the manufacturing quality IT Service Management in areas like pharmaceuticals energy auto and mining and the five tools which are what the company was founded on our problem analysis which I'm going to talk a little bit about our process decision analysis which is a easy process to choose a corrective action potential problem analysis which is a risk management process what I look at it is it's a light FMEA process other than there's the bottom one with potential opportunity analysis and that allows us to take things that are working well and how do we capitalize on it and then over on the left is situation appraisal which is a good questioning process because it's nothing else as a root cause analysis person you've got to be really good at asking good solid questions first right I'm actually going to work in two of these areas I'm going to work in the training area and I'm going to work in the process improvement area today so in the training piece take a look at up there it is okay just advanced I'm going to talk about three different three or four different tools today the first one I talked about is going to be 5y tools it's pretty simple tool it's known throughout the world as you can see in the poll it's probably the most common tool I think it was almost close to 90% of the people use that it came from when you look at it it came from the toy Gotha process whoops sorry slides are moving slowly and which began in the 1970s I was a Toyota Production system it's used now industry-wide and what Toyota found and the reason they use it as they were trying to do troubleshooting activities they did not discover root cause before actions were being taken and sometimes the actions were actually causing more problems so they step back and try to find a way that everybody line operators solloway up through senior management could address problems and keep them from reoccurring so the way a quick review of the 5y process works is that it is a series of questions five is the nomenclature that people fall to but typically it can be less than that in some cases it can go longer than that and what you end up finding is as an example to to quickly go through it let's say you are coming in on your shift and you're actually right around now where I am in the eastern time you're probably moving into the start of the third shift and when you come into the third shift your tool the line is not running so you're automatically by human nature and the way you think is a troubleshooter you're dropping into the 5y process and so you're asking well why is line running slope and you might get an answer from somebody on the previous shift that the something generally well the new widgets don't fit and then you're going to ask well why don't the new widgets fit and the response is going to be hey there's a hole that's too small it's not allowing us for easy insertion and you're on your third why why is that hole too small and then you're going to get an answer typically that is that's the way it was specified in the drawings and then you're going to ask well why the drawings have those specs and that question gets answered with well that's the data that's in our system and why is that data that seems to be bad in our system and you get the answer well looks like it's entry error typically when you get a object deviation type answer or something like that where you can start to take kottoor corrective actions on it you fit root cause with five why's the real simple processes everybody understands I think it gets used about 80% at a time and most of the basic process or mace basic problems that have the thing that we at Katie and what I try to bring the clients is that once you get into that its entry air as my example was it's a process that we take one more step is like think beyond the fix so we now know why we have this problem and we're going to be able to fix that but we'll ask where else in the operation might we potentially have this problem where else in the company do we use the same CAD system and the same are manufacturing the same things that maybe they haven't had the problem yet should we alert them about what we've had and what the experience is and how we fixed it so we're taking that additional step which we call think beyond the fix tends add a little bit of well actually adds a lot of value in thinking beyond just what the buy wise offer um the other thing is which happens you'll get to that fifth Y or six Y or whatever it is and you still have a cause unknown problem you don't know what happens there for us the way we look at it is this is a great problem statement and that problem statement is usually in a format that's an object defect format very very simple problem statement everybody understands what it is but now we've got to do some deeper dive use some other root cause analysis tool to try to address it and we've actually found with one of our clients IBM that if they get a good solid problem statement they've actually statistically found they've improved their finding of cause by about 15 to 20 percent just by having that initial statement um so five wise is a simple concept like I said I think it's used about 80 percent of the time and gets as an effective process it addresses those issues everybody understands how it works it takes very little training make it happen but then you get into what are you going to do about the tougher issues which are the 20% problems and those 20% problems I'm going to give you three more techniques that I tend to gravitate to they're not the perfect techniques there but they're ones that are pretty common in the industry and I find them very effective the first one is the Ishikawa diagram or excuse me they shook our process which is collectively known as fish bones um that's generally where I would go to next and the idea around the fish bones is that it's a standalone root cause analysis process it can also be a feeder to other root cause analysis processes in fact when I talk about the KT is is not technique but is a feeder that we use for identifying possible causes the fish bones all describe in a systematic way using six areas it is used by operators and troubleshooting teams and it tends to get people to focus on areas versus people at this point in time the diagram looks like this I think everybody is familiar with it a couple of points I want to make here on the fishbone diagram when we talk problem spec and when you go back to look at these slides and problem spec that is a specification that we develop a KT using and is not is is not template where we collect data and that problem spec which you'll see in a few minutes can be something that you end up using to generate possible causes I also note that sometimes I use process mapping here to identify to support my fishbone technique process mapping which wasn't one of the root cause analysis tool that was listed up there it's an excellent way to understand how the whole process works and show how the inputs and process steps relate to the output these I've found that these interrelationships in these steps typically help people or the team then generate causes or generate additional causes in the various fishbone areas of the diagram however you know using process maps to general generate the fishbone diagram can be a lengthy process my experience is nine times out of ten when you start doing a fishbone on a problem just by the idea of brainstorming or people's knowledge and experience they're able to populate possible causes in the people machine material areas as well as the ones along the bottom again when we work with clients using fishbones we work very hard to make sure that as they populate each area in the fishbone they put in causal statements with an object deviation format and the idea here is that sometimes you may put something on a fishbone that could be broad in general enough that there's multiple causes in it and I'll give you some examples later on when I show how fish building fits into the KT process but the idea is you want to make sure there are no gaps in the logic so you want to end up with causal statements you want to make sure that sometimes there are too many possible causes once you start separating them out so it may indicate you need to go back to your problem specification and take a look at the data that's in there it may not be as factual as you expected it to be all right um moving along those are two the top ones that were in the poll fish bones and five wise the next one I'm going to describe is KT problem analysis it's it's listed in KT we call a problem analysis and the way our first step is a problem statement which comes out of the five y space and you get that object deviation and then we collect data in a structured format called is isn't is not I have lots and lots of clients that have toolboxes of root cause analysis methods and in there it's usually listed as it is is not table I also have clients that say hey we're going to KT this one the full KT process which I won't spend a lot of time explaining I find with clients typically gets on those 20 percenters they've used five why's and if that's not successful they probably moved to a fishbone or effect situation and if that's not successful and that's usually those two or three techniques tend to get about 80% of the issues they'll move into the more complex ones and the KT is is not processes one of the ones that fits that scenario what it really does is visually as you can see in this PowerPoint slide it visually lays out the data that's been collected and we are very much into factual data so on the left is literally I think this is out of IT problem we were solving on the left is typically the way a lot of problems are described by people who are solving it or operators would first see it it's sort of a stream of consciousness writing things down they tend to get the good quality information but we want what we want to do in KT is put it into a template and a format on the right side that's a lot easier for people to track and follow let me take a minute and explain that kind of template all right and you advance that slide for me thank you um so it starts off with the problem statement and again that problem statement is very simple for us it's an object deviation or an object defect as I said earlier if you get at the end of five why's you're usually in that format and if you don't know cause you can list that last Y out and put it at the top of our template we then begin to define the problem into four areas which are fairly common to how people describe problems it's what happened where did it happen when did it happen an extent is how bad is the problem how many products how many widgets whatever is happening with it you know how bad is it and they can tell you on that is side in detail what's happening when we ask and go to the is not side which is a key part of our process and these is not vacation people think this naturally and this is information that we collect and what it does is tighten up the is data in those four areas and literally the is not information is what you're going to use to eliminate possible causes and get down to what we call the most probable cause um here's an example of that template that's completely empty this time and I'm not going to walk through populating this one I'll do it on another one but I want to try to give you a sense of how it works and what thee is and is not function works like but one of the easy ways to think about what is nots are as everybody tends to travel or even when you get home you tend to turn the TV on and right now if you're in the US there's a number of baseball games going on in the playoffs and actually last night it was in New York City so I came back for meetings turned on the TV to watch the game because this big game for New York City and when you turn when I turn on the TV in the hotel room went to the ESPN channel and the screen was entirely dark there was no picture whatsoever automatically your mind starts to think about what Katie calls is knots and so you start looking for is knots to begin to rule out possible causes so in this simple example I would end up I ended up turning a channel one channel to the right so let's say I was on 13 I went to 14 and when 14 came on there was a picture it wasn't the ESPN game I wanted was another ESPN channel but by seeing that was not the problem that automatically for me as an is not ruled out a bunch of possible causes that had already started running through my head number one was the cable working the room obviously it is because channel 14 works number two possible cause was the cable box to my TV working clearly it is another thought I had was cable out for the entire hotel well obviously it wasn't because the other channel showed me that there was a TV picture so by that simple mental exercise of looking for is not when I compare them to my uses so my is was channel 13 the baseball game channel 14 is not has a picture it's closely related and it tells me automatically that a bunch of possible causes make no sense given the data so that's how the is is and is not work we lay them out by asking questions starting in the first row and work left to right we'll go down to the second left to right and we end up populating the entire table I'm not moving please advance it and somebody advance thank you all right so now I'm going to show you using another example how the table gets populated by going left to right through the columns now this is a investigation that we helped in the German market around automobile problems so you have your problem statement object defect cars are crashing they actually I mean it's a real simple example but it actually is very effective in showing you how this how this whole table gets set up at that point in time we weren't sure why the cars are crashing so we decided to pull together a problem spec so the first is it's cars it is not semi trucks or buses next one it's they are crashing total loss of each car it is not broken down that car or a minor incident just a fender better vaccum a fender bender then we move into the wear areas it's happening on the Autobahn and we're specifically on the Autobahn we would ask it's five kilometres stretch south of Cologne is not happening and other urban areas in the Autobahn such as Berlin Munich Cranford et cetera um where is it happening in on the car well it's actually impacting the front but then the damage is all over it is not happening any specific spots so like you may be sideswipe some sideswipe something and it's not only the right side or the left side depending on which way you're traveling when did it start early September wasn't seen before September it's continuous we see it all the time with cars and that's section it is not periodic it is during the night which is a key piece of information it's not during the day or add-on or at dusk and then we get into the extent information it's I mean they're accidents all the time in the Autobahn in that particular stretch but in this particular case starting in September is about 2% above the average uh it's a total boss on the car it's not cosmetic or minor damage nmds come up sometimes because you ask and there are specific questions that we have aligned to these four areas there are times when you ask the specific question of the people that are involved then they don't have an idea or they're not sure about the data so we use the acronym nmd need more data as a space holder so that we know hey we don't have facts yet so that our and the last extent question is a it's stable it's not increasing or decreasing so in a real simple example that's how we fill out and is is not table for cars that were crashing on the autobahn near cologne then we would take the fishbone and either the fishbone hasn't resolved the possible cause or we've identified the system fishbone as a way to generate possible causes either way works for us and KT and in this particular example I'm going to pick something out of the environment area of the fishbone and the idea is here one of the possible causes is that it's black ice so what we would do is test the possible cause of our cars are crashing is black ice against each of these pairs one at a time and the concept is we want to take this factual information that we have right now and eliminate the possible cause if any of the facts do were right down assumptions if they get through some of the facts or actually confirm that that is root cause so in a quick example it was we would say if black ice is the cars reason why our cars are crashing how come is only happening cars and not semi trucks or buses and you might get some answers like well you know buses and semi trucks maybe the black ice isn't that thick so they're able to manage their way through it for us that's an assumption we document that and then we go down to the next one so if it's black ice why does it cause the polar fresh and it's not like a fender bender or broken me or something like that well that fact makes some sense with black rice because typically using when you hit it you tend to lose control of your car so that would allow you to have a total crash so that those two facts make sense so it's black ice is the cause of our cars crashing how come it only happens on the Autobahn and not anywhere else and the excuse me the five kilometer stretch of the Autobahn and Cologne and not anywhere else well that pair of facts really makes it difficult for black ice to be our root cause or even a potential possible cause because when you step back and look at it and we were working with people there was black ice in various spots of the Autobahn outside of Cologne beyond just a 5 kilometer stretch there were black ice periods of time at the same period when we started in early September and the other areas yet none of those other areas or other areas around cologne were showing any kind of or having this particular car crashing incident so in our process black ice was ruled out as a possible cause and then if you went back to your fishbone we take another I high probability possible cause and run it through these is not specification so in short that is is is not KT problem analysis sorry it is a nice way to collect factual data it does not take a long time as you saw and then the fourth tool that we use that that I like to go to and gravitate to is another root cause analysis tool called 8d it's a common process that was that is was started in the automotive industry by Ford it was actually something that Katie developed as well years and years ago the reason that I really like it is that it's scalable you can introduce various root cause analysis techniques within the 8d process and I'll show you a template in a little bit where we've done that you can also introduce in the ad process human form problem analysis on the right hand side are the steps in the 8d sorry steps obviously they're labeled as DS as you can see and most are half of the steps are around developing the understanding of the issue and then the other half of the steps are around taking action can somebody advance it thank you this is an example of an 8 D template that katie has pulled together that takes the steps that you saw the ad steps in the previous slide lays them out on a single page it's very visual you can see that in this process at the top is a problem statement this is where we would introduce five why's if at the end of the 5y process you still haven't found cause and you want to go to the 8d root cause analysis process right there we put the object defect 5 y here are the fish bones in this particular template there are some suggestions on how to generate information for the fish bones again you can either lift the fish bone process that I showed you earlier and lay it in here or you can duplicate it here's the katie is not specification laid out this is where we collect our data so you can see that the three tools that I've talked about so far see they fit nicely in this and then when you take a closer look at it it's got a lot of other good visual information which is why this one-page template makes is such a powerful thing this particular area that the cursor is on you can put pictures of the issue this particular area down here you're you're able to put in some process Maps some workflows over here you're testing out your possible causes and able to show that the you know which causes were considered which ones were ruled out and why and then you move into containment actions and root cause analysis and even down here is the idea think beyond the fix you found cause you've contained that you've done corrective actions you know now you've done a little bit of preventive action where else in the plant might this work so it's a pretty slick template using the 8d process that's able to build in other root cause analysis techniques and the last thing I'll say about it is that if you have other root cause analysis techniques that you are fond of or the company uses there is no problem switching some of these outs so you may switch out the fishbones to put in fault trees that's that's the beauty of this you can almost plug and play with it all right so summarizing I've talked about four different methods they work well in a break fix environment I ran around mechanical chemical or biological issues those are the typical ones that I work with when the type of clients that I tend to see on the healthy fix problems faster people who are trained in them and use them often enough remember that they've got to use them a lot so they didn't lose the understanding of them they'll end up feeling confident using them but it's it's they're just nice stuff nice solid tools and again from our analysis or our profusing our polling question it looks like everybody tends to gravitate towards at least does 3 take a few minutes now to talk about human performance problems this is a model that Katie uses it's pretty simple but it's very elegant it basically starts with the assumption that the performer there in the middle comes to work with every intention of doing a good job that day and then something tends to happen and there's a problem and what we find is that like I said earlier human performance issues or what we call fondly call operator error issues can - if you do a Pareto analysis of your problems in the plant you will find that they are usually in the top three issues and typically the very first solution is retrain that person so if Michaels problem obviously you didn't understand the SOPs or obviously he didn't all some sort of step but let's go ahead and retrain them and what I'm finding especially in regulated industries is that a lot of the regulator's now when they go in and do audits and they see retraining or they see problem people problems as a top issue and they constantly see the solution is what's retrain people they're basically coming back and saying you really haven't found root cause so this model is as I said very simple but very elegant it takes that concept that nobody's coming to work trying to do a bad job and will try to figure out what the issues are that cause people to have problems you need dance it please write again a key is a data factual type company this is the model again it's called a spricht fit model as you can see and these are the questions that we tend to ask of the performer which might be in this case the operator to try to understand why that operator or the team or that shift are having people problems we'll look at the response that we're seeing which is the are we'll look at the consequences that are happening encouraging or discouraging consequences for those people or that operator we'll take a look at the feedback that's happening we'll also look at the environment situation that's around that performer you know is is it conducive to performing that type of operation this is a bit of analysis it's not difficult analysis to do for people problems the questions are pretty self-explanatory you're asking the performer you're asking people there you're going out and observing the line to start to gather this data and and once you've gathered this data you will end up moving in to how to fix it which is this process called balance of consequences and the idea of balance of consequences is that you have a basically the way I look at it is the performer on the left hand side and what a desired response that you're trying to get out of that that person or that team or that shift is up at the top and then down at the bottom is what you're trying to achieve and then you use this tool to begin to find out what root causes this tool actually easily identifies and demonstrates the nature of the consequences to the performer was there immediate or delayed and the positive and negatives are encouraging consequences for positive and discouraging consequences is on the negative side and you're laying out the information you got when you collected that data on the previous slide in these blocks and then at the end you want to consider the consequences to the organization as well as just the individual or teams and so you lay those out as well and then what happens is when you step back and start to take a look at this information you look at which consequences will exert the strongest influence on the behavior and those are the ones you want to start to drive towards for the people or the team with a shift so that you start to eliminate your people problems it's a three step that's actually a two step model a little bit of data collection which the previous slide then taking that information and putting in as a set this series of boxes called balance of consequences okay I know there are a lot of other people problem type issues or excuse me people problem processes Swiss cheese one is one I see quite a bit all of them are pretty good the whole concept around in my opinion the whole concept around performance issues is to make sure that they don't focus on just individual they tend to try to look at the situation and what that individual is exhibiting um so after this I'm moving into an element of coaching but when you learn these techniques by wise fish Katie is is not even the human performance model how do you get people to practice and use those in a safe environment in the Katie CAPA program we have a new product called the sim lab it's basically a Lego Mindstorm robot which simulates the virtual manufacturing workshop and the participants are limited to data that the instructor passes out to them they start with easy problems they're all in the manufacturing space and as they get more confident in this safe easy-to-use environment they become more complex problems so they may move from using just a 5 y root-cause analysis tool into a fishbone diagram and then they may move into a full-blown 8d root cause analysis um the idea is that people get to practice it's very hands-on the AI the world is you I I keep hearing the word called gamification which tends to be where the industry is going in the training space and it's just a nice little tool that's easy to use pretty much driven by the instructor people get roles they get different kinds of information and they're able to practice things in a safe environment which is great to have happen after training happens before they go out to actually perform root cause analysis in the workshop excuse me not a new workshop in the plant um it's relatively well the industry is in the gamification now this is something that we provide in our Katie CAPA program I have clients now that are using this particular tool to identify you know what kind of training people need I have other clients that uses as tabletop exercises even after training is over by a couple months and I actually have a couple one client particular now that's using it as a way to lay out the SOPs for their investigation teams and set up scenarios to make sure that the investigation team follows their SOPs for the aspect um how they they manage it so let me get to the question slide I want to take a break for a second and you get me - there we go so I think we probably had some questions so far we do Michael thanks so we'll just take a short break here because we have such a large audience today and we wanted to get to a few questions and then we'll continue with the presentation the first question is what's the difference between fishbone and cause effect um that to me the fish bone is more graphic graphical it's it's very visual people can lay things out when I go into plants it lends itself to being in a shift change for a huddle it lends itself from a wall cause and effect is is very similar to it but I look at cot four in my mind cause and effect is where I end up using time lines which aren't bad these with fish bones or anywhere else but cause and effect tells me okay this is the something that causes this the effect I see so that they're not relatively different but I tend to like the fishbone because of the visual aspect of it okay our next question is how often do you find that you have done five whys on the wrong problem do you have a problem definition to assure that everyone is the same definition ahead of five whys that's a great question and yes I confess I've done five whys on the wrong problem I've done other tools and techniques on the wrong problem um if you go if you can recall back to that slide where we had the ket methodologies that was that orb so we had problem analysis decision on the right hand side and on the left hand what side was situation appraisal that questioning technique that we trained people in is one of the aspects of that is designed to make sure we get down to the right problem and the right type of tool so as we separate RFI issues we do these this can be used in shift change meetings this can be used at the shop floor by the operators I'm actually going to be doing a situation appraisal for a senior leadership team around their upcoming issues for calendar 2018 but the steps in that process get you down to actionable items that you identify then are either problems or decisions and then at that step you identify who it is that you want to get involved in what tool you'll use so with that as my starting point even when I go into a place somebody will tell me so this is the problem I will take a few minutes to do what we call SAR situation appraisal and our last question right now is as a retail marketing company I deal with outsourced vendors do you have customers with this format that send your templates out to their vendors to populate we do there's a bit of risk in that then the risk is if that vendor doesn't understand the process and the template that you're sending to them the bit of education goes a long ways and that process I think it's actually really important because many of the issues that I see are called SOS supplier of suppliers like your tier 2 tier 3 vendors the ones that made the parts for the supplier that you're buying that product for in the retail space and if you just send out templates to them and ask them to populate it without a little bit of explanation or a little bit of education or even in some cases formal training you may come back with you may get back the information that is absolutely doesn't help you do anything so it's a bit of time to educate people and you can do it quickly in a webinar in today's world I mean a lot of people have the supply chain that comes out of non-us operations so getting on a webinar real quick and walking them through let's say katie is is not and explaining something like that goes a long ways okay and Michael will go back to your presentation okay great so the last place I'm going to finish out because I have about the ten minutes before we get to last Q&A is around process improvement and what I want to try to achieve here is what we found in KT to really make root cause analysis tools stick you need to have a couple things that have to happen one is coaching of people and that's why the sim lab is a nice modern way to do the coaching you can actually coach people side by side but a safe environment coaching makes it a lot easier the other piece that has to happen to make people use the root cause analysis tools or at least trigger people use the root cause analysis tools is integrating the templates or templates into your workflows SOPs or business processes so that's what I'm going to focus on to finish this out again mind stuff could you advance it one please I'm going to go from simple to complex templates this is a very simple template it's actually very powerful because of its simplicity starts off with five why's and again these templates I find used all over the place I find them posted on walls I find them by the operators I find them embedded in the SOPs I find them as a Word documents that are in software systems for quality investigations but anyway you can get those templates that help people use the root cause analysis tools visible to them that automatically triggers them start doing that thinking which is the way the brain operates so we've got five whys at the top if you know what the cause is you're going to go down the right hand side confirm to cause and make sure you documented things if you're unsure with the causes you're going down the left-hand side you might use the K key is is not problem specification to get the data collected and then you go into either fish boning or brainstorming or using your knowledge experience to generate possible causes and test those against that is not specification that circles around 2:00 you've got down you've eliminated a bunch of possible causes you're down to a few probable causes you do a final test the nose to confirm so that's root cause very simple flow chart was very effective here's another flow chart a little more complex a lot more boxes obviously engineers love more boxes and love this kind of diagramming but the nice thing about this flow chart is it's got the same process I described in the earlier flow chart over here but we've now added in the people problem model the kakie human performance model over here on the right-hand side so it gives somebody those steps in that process and it's a big high level so they can follow down and if it's not a break fix mechanical issue but they think it's a people problem it's quickly evident and they can move over to this side um a next kind of process that we pull together a next matrix that we pull together is what I call an issue escalation matrix it's still what I would term it's probably somewhere between simple and complex basically it's a table that we developed with clients it's usually around four levels from minor to major problems it helps people apprised the problem level and begins to tell them what kinds of root cause analysis tools to use what types of people they need to engage how long they should have to fix something often this particular one is geared towards the pharmaceutical world because we've got regulatory impact safety efficacy and operational these boxes over here depending on what you manufacture and what industry and we change these boxes out to help us build that kind of model and it ends up in a escalation matrix looking something like this so we typically break them out into four levels so these are levels of complexity of the problem these are the type of activities that you should be doing depending on how complex the problem is this is maybe who you get involved these are the KT tools that you might be using these are any other Ruth root cause analysis tools and this is the documentation that needs to be follows and filled out so if we stay with level one which is usually a short line stop not a big deal you just going to identify the problem it's going to be the operator or in the life science world it might be a lab technician that's having that issue you're going to use the KT tool which is situation appraisal to identify the problems you might go to your SOPs and policies for the additional tools and this is what we're going to document a little bit bigger issue same process over here so it's a little more complex than the flowcharts but the beauty of this is at a single page and a snapshot people begin to understand ok I need to deal with what's considered a level two issue this is what I have to do this is who I involved and this is the documentation I make excuse my cell up and again the same concept but a much more complex table you can see many many more details same format same layout but more definition so there's less there's more rigidity around what's the level 1 versus level 2 problem and there's less ambiguity for people when they're trying to figure out where to go and there are more additional root cause analysis techniques way beyond the ones I've talked about but they're all perfectly acceptable at any one of these boxes and the documentation gets much much greater as the problems go um last one I'll talk about is what let's actually come out of the IT industry they tend to develop what are called playbooks an RIT practice in the company we've moved it into the manufacturing side that I'm on the OP X side and we're developing play books for our clients that combine flow charts and various tools and techniques so this is one we've developed for a life science client it's hard to read I realize that but if you were able to dive down into it you can see that performance model here you can see areas of the Cady problem analysis process so all the root cause analysis techniques that are part of this particular clients SOPs are baked into here and then some other tools are laid out down here at the bottom to help them with additional information um so that was a real fast we back of one side that was very quick around templates I don't want to minimize that the idea is taking the tools and root cause analysis techniques that you've decided to embrace and take templates and bake those into your workflows put those into your SOPs make sure they're part of your business processes because what happens is as people follow those processes those templates become triggers for them to say okay I need to use five why's or I need to use fishbones and those templates laid out help them mentally understand what they learned or what they might have done you know previously and reinforce the things so integrating templates from your tools into your workflows is huge it adds a ten ton of value finally give you a quick case study this is a telecommunications company they achieve they're four times over improvement goal they identified a few root cause analysis tools they developed some internal coaches that were operators that we supported them with that development around soft skills for coaching they've added in some other tools they made sure was embedded into their processes and they also decided to embrace the sim lab and use that for a safe environment to practice things and what ends up happening is a ton of improvement and it was way beyond what they expected the training was reinforced and the bottom line was they were able to exceed their improvement argument by about 300% and they delivered in the television communications space sixty four percent reduction and MTTR which is time to restore or resolve over a nine month period so that's pretty substantial it's a rut it's a very recent case and again it shows you the beauty of root cause analysis techniques combined with templates combined with coaching okay so I am being advanced to any final questions anything there that needs to be asked Steve yeah we've got a number of questions so we're going to jump right into that and while Michael is answering your questions please take a moment to complete the feedback form that appears on the left-hand side of your screen and with that we will start with can the people problem process presented be used for individuals or groups of individuals I can be used for both you know you it's typically people start to use that process on just individuals but with a little bit of thinking you can use it on I use it on shifts we have a play a process called best demonstrated performance so you might have one shift that's doing better than the other shifts in your operations and they you know they have a performance level that you want the others to attain attain so I would take the people problem and do it across a shift level and ask the same kind of questions okay another one yeah is it acceptable to put as an issue training people operators or is it a no identification root well-studied I'm not sure I understand that but let me take a crack at it okay if can you repeat it one more time sure it says this is acceptable to put as an issue training people operator or is a no identification root well-studied so to me if I understood it right is the root cause operators and the solution is training people um again I fall back to I don't think people intentionally try to create problems something's happening in that model that I use demonstrated that's that's impacting them to have that problem so that's that's where I gravitate to I I would rather find what's causing them to operate that way versus that's more training that tends not to necessarily fix everything and if you train the same version three times then it's got to be something else yeah how does Katie measure the success of their training in other words what is the measurable that can be reported and tracked um that's a great question when we work with people in consulting engagements back in that Katie CAPA model where we have the diagnostic piece we'll sit down with the client and understand why they're looking at fixing their troubleshooting process those are operations or a particular area their operations or manufacturing and then we'll try to understand what the metrics are that they're using that telling them they have those issues and then in our analysis we'll come in and do some Diagnostics take a look at that whatever they're asking us to look at confirming that their metrics are accurate and then come back with a proposal around you know based on what we've seen here are a number of different projects that we can work with you together that will drive this metric in this direction and typically we're we've been doing this long enough we can give a pretty good idea of what that improvement and that metric might be so we work in that training is a part of those engagements and that capability transfer to people around a lot of different of our technologies and others is what helps move that metric okay we're coming up on the top of the hour we are going to go over a few minutes due to the size of our audience and the number of questions we've received so please stick with us any suggestions for sharing lessons learned between departments companies etc yeah that's got a lot of things in my head running one is that think beyond the fix if you make that a functional part of how you finish out your problem-solving process the steps in there are all around where else in the in the plant can we have this potentially happen I mean when we're plants you know pump problems are huge and you always know you've got four of the same pumps working in different spots they may be doing different functions but if you have one that's giving you heartburn and you solve the problem you should automatically be thinking about alerting the other areas of the plant to what you found same thing goes and I see it a lot in the life science space where it's plant to plant so you'll have a sister plant manufacturing identical or very similar products one might be in Puerto Rico and another might be in Ireland and what happens is the plant in Puerto Rico has identified the root cause of something that's been systemic and they've done a good job of expanding that think beyond the fix out into the plant itself but what they need to be able to do is elevate that out and put out an alert to the rest of their company and specifically to that plant in Ireland that I gave is an example that's manufacturing the same thing about what they found the way to do that it's easy as an email pick up the phone more formally the way to do that is through some sort of SOP or software system where they can access what you've done and be able to see the data and then apply that to their operation okay but else our next question is how do you get folks to think about beyond the fix that you mentioned rather than react to the situation or issue immediately um it's two to two things one is simple and the other is a little more complex a lot of the simple ways of doing that is just ask people to do that the reality is people want problems to be solved they want their jobs to be less complex they want it to be easier and the way to do that is to start doing think beyond the fix and the way to get them to start doing that is if you're in the management level you've got to remind them of that you've got to ask them do that you have to help them do that talk to them through that then more formally you can have it like we do in the ad root-cause analysis template where it's a formal step at the process and again that gets back to if I get a bunch of those templates back and that step which I think is right at the very end there's nothing in there I know people aren't doing that so now I'm going to go back out and walk the walk and start talking the talk it's changing people's behavior is as we all know challenging that's why we have in the KT Kappa program a whole lever around change management but really what it gets down to and I was with a senior vice president up in Boston two weeks ago who was big on change management and he says that basically it's winning it over one person at a time for a period of time until it gets ahold and move along okay so we've looked at a number of tools in this webinar next question is how can I know what's the best tool to use um visit that is what's what's your culture comfortable with some industries they're not comfortable with highly complex problem-solving tools other industries are some operations I think just about everybody has heard of five why's no matter what industry you're in um so that's why I go to basic tool and it's easy for people to follow and once you start showing people success and using a RCA methodology they tend to want to learn more and then you just have to step back you and the rest of your management team and identify of all the root cause analysis tools out of the critical few you don't want to bury people you know 6 or 10 because they're only going to use one or two and you want to figure out what those 1 2 or 3 tools are that you want them to continually use and then we call that a common language you pretty soon find people using those over and over and over like in those meetings at first these slides I have in fact I hear a lot when I go to clients they tell me hey we're going to Katy this one and that's all we need to say everybody knows they're going to start with filling out that problem specification these is not ok our next question is when solving problems were generally pushed to solve them as quickly as possible we also want to have some metrics that we can use to measure the effectiveness of our problem-solving activities so what are some effective metrics that encourage quick but effective problem solving but don't discourage people from reporting or adding more problems to the workload now that's a hard one and the first metric of jumps to my mind is that one I use in the case studies a MTCR and it's a pretty good metric the amount when you go to the tables that I had the issue escalation table did the more complex one which have the yellow band and the red wording on the right-hand side it talks about levels and it talks about you know five-minute shutdown or five-minute line stop this is what you do for level one and those kinds of timing things help people understand how do I do things quickly how do I do things that are more complex or at a greater level the other thing is quickly to think about is you know what are you reinforcing as management there is a ton of pressure to fix things quickly but you know you've got to pick a few metrics identify those and find out what's driving those and build momentum to make those work happy to talk to anybody about various metrics okay have you had any experience with an apparent cause do we treat these investigations the same as a root cause and what was the first apparent cause yeah have you had any experience with an apparent cause I'm not certain what an apparent cause is I'll take a stab at what I think it might mean um when we work there's you always have in Just's or meetings or whatever uh people who know what what the cause is because we saw that last week we saw that last year and so if that's to you an apparent cause I agree and they tend to be the ones that people say oh yeah we saw that last week we did this to fix it let's just do it again and my position is you know you might be right but let's stop and think for a second about that let's just gather real fast a little bit of data and then take that cause through that data and make sure that it's really the root cause a lot of times a parent cause has come back because you haven't found the root cause you haven't spent the time to get down to what's really the cause of the cause okay and I think just have time for one more question that is to utilize the fishbone to eliminate areas that do not address the problem ah yes so you've got all those bones and you will lay those out in a fishbone technique like we showed in the slides you lay in possible causes in each one of those bones and it will become pretty apparent that you're going to zero in on one area so like in my example when I was talking about cars are crashing in this particular case they were zeroing zeroing in on the environmental area and so rather than take all the possible causes and all of those other areas through some sort of process of elimination we tend to focus on that area that in this case of his environment and the the idea that what actually happens is because of the technical people you have there and the smees and the people with with the truckload called tribal knowledge they can zero in on which of those those areas makes the most sense or in some cases they can zero in on a couple different possible causes from a couple different areas that seem to be likely and then we run those through our is not specification okay well I'm afraid we've run out of time I'd like to thank our speaker Michael Curran Hayes and our sponsor kepner-tregoe as a reminder if you're registered as a group please add the names and emails of all in attendance on the exit survey on behalf of industry week have a productive remainder of the day
Up Next

1:54
Pre-Written Crisis News Releases: Best Practices
@TheBraudCast-GerardBraud
101 views•2019-08-28

20:08
Hollywood Fantasy Orchestrator RPG Expansion Pack Tutorial Walkthrough
@HighResolutionJapan
1.1K views•2024-03-08

9:49
FastAPI vs Flask vs Django: Choosing the Right Python Web Framework
@TechWithTim
302.5K views•2024-05-26

1:42
Game of Thrones Opening Credits: A Cinematic Analysis
@gameofthrones
46.3M views•2011-04-18
Related Study Plans & Knowledge Roadmaps
Structured learning paths in General & Interdisciplinary Studies
general-studies
Containerization: Evolution, Logistics & Trade
01Ancient Trade & Bulk Cargo: Amphorae to Barrels
02The Industrial Revolution & Cardboard Packaging
03The Containerization Revolution: Malcom McLean
+ 2 more learning modules
12h5 modules
Explore Roadmap
general-studies
Textile Tech: Evolution, Labor & Global Impact
01Pre-Industrial Textiles: Handloom & Cottage Industry
02Mechanization: The Spinning Jenny to the Power Loom
03The Factory System & Global Labor Transformation
+ 2 more learning modules
10h5 modules
Explore Roadmap
general-studies
Pharmacology: Botany, Patents & Biopiracy
01Foundations of Ethnobotany & Traditional Medicine
02The Birth of Synthetic Chemistry: Aspirin & Penicillin
03The Battle Against Malaria: Quinine to Artemisinin
+ 3 more learning modules
12h6 modules
Explore Roadmap
general-studies
Writing Surfaces: Papyrus, Parchment & Paper
01Ancient Foundations: Clay, Stone, and Egyptian Papyrus
02Parchment, Vellum, and the Rise of the Codex
03The Chinese Rag Paper Revolution and the Silk Road
+ 3 more learning modules
9h6 modules
Explore Roadmap