




















This video tutorial demonstrates how to analyze molecular docking results using AutoDock, covering the extraction of key parameters such as binding free energies, RMSD values, and inhibition constants (Ki) from the dlg file, followed by visualization techniques using tools like PLP, ProteinPlus, LigPlot+, and PyMol to generate 2D and 3D representations of protein-ligand interactions for publication-quality figures.
Molecular Docking Analysis: Autodock Results & Interaction Visualization
Added:Fundamental concepts of structural biology, including protein structure levels, active/binding sites, and ligand-receptor complementarity.
The basic theory of molecular docking, including search algorithms, grid parameters, and the significance of binding affinity or binding energy.
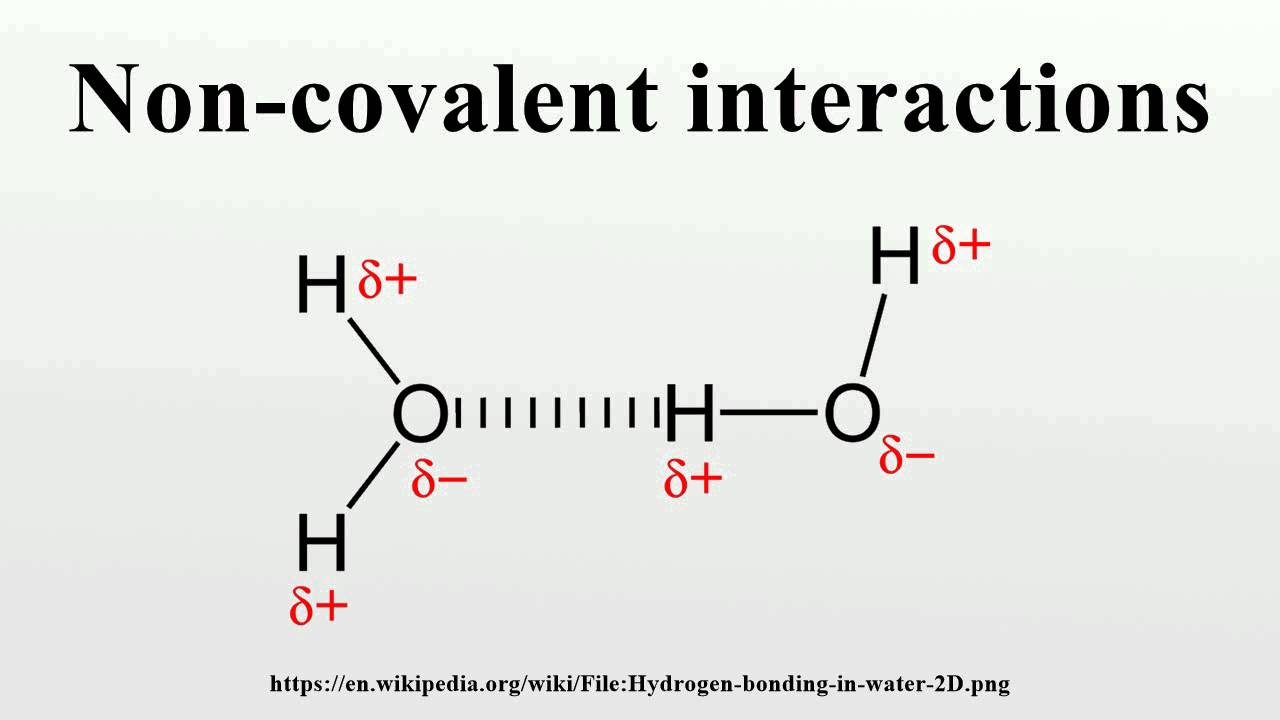
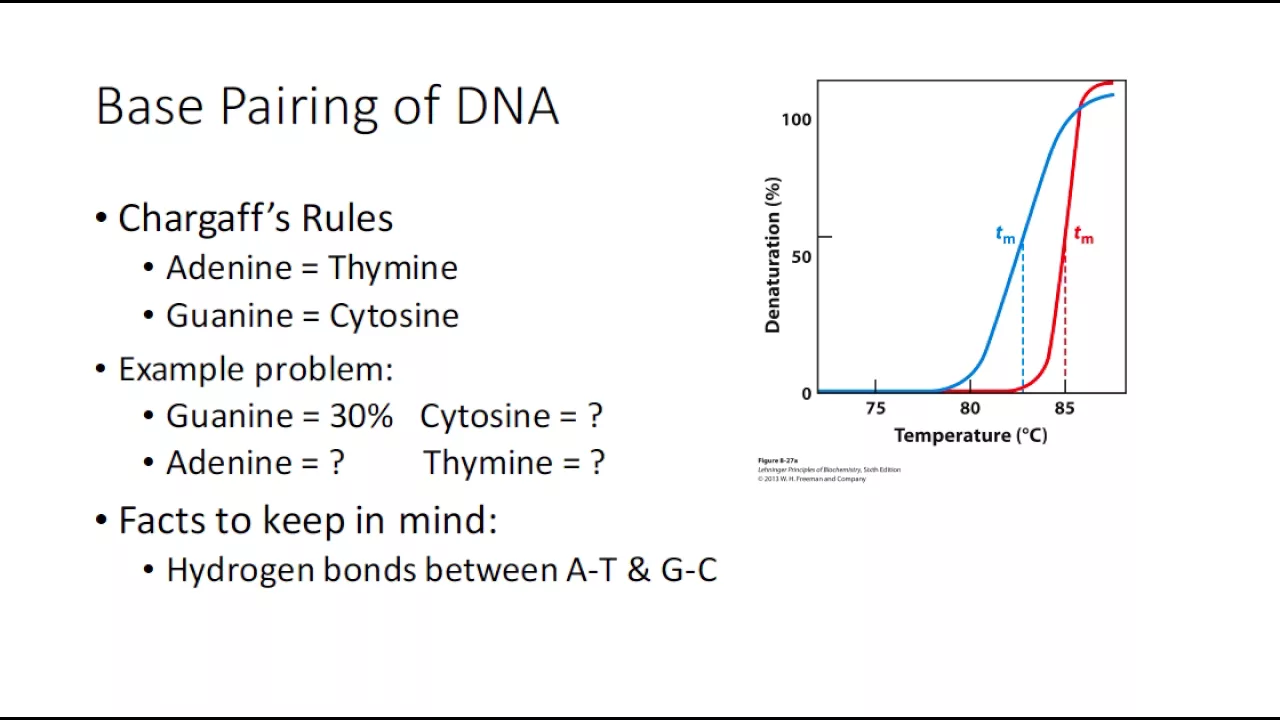
Types of non-covalent chemical interactions, such as hydrogen bonds, hydrophobic interactions, pi-stacking, and electrostatic forces.
Familiarity with standard structural biology file formats, particularly .pdb, .pdbqt, and .sdf.
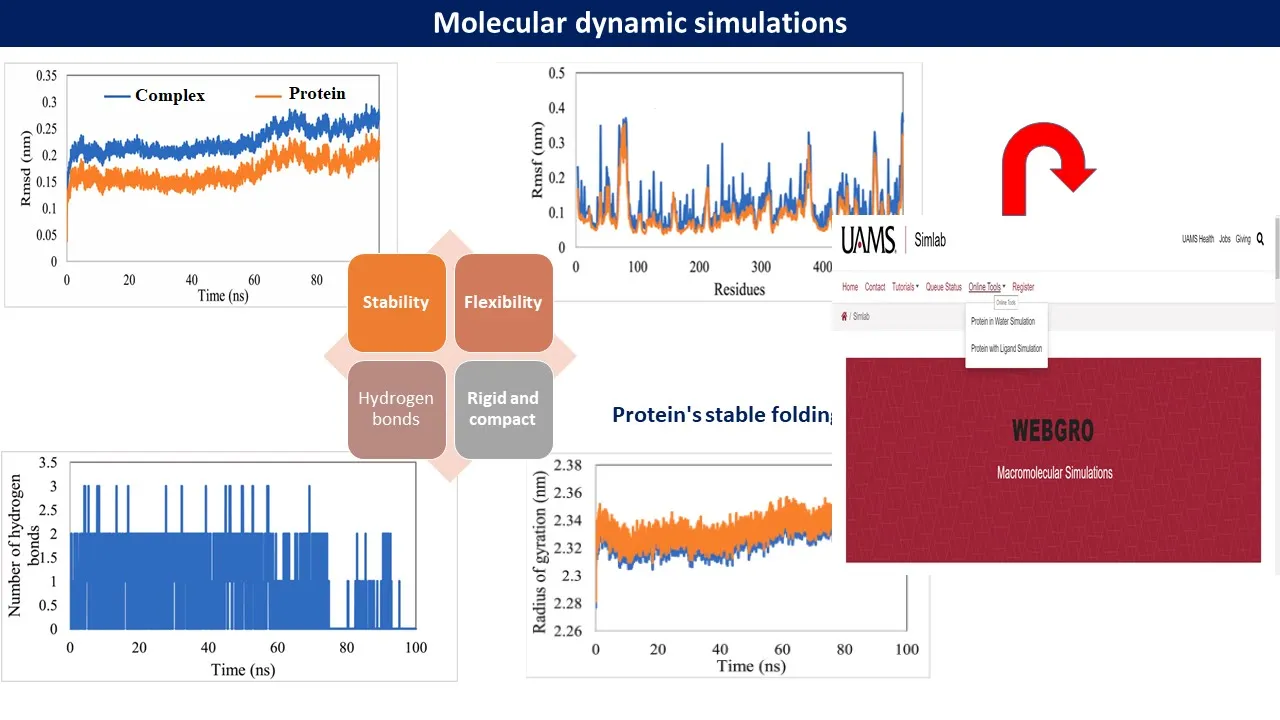
Molecular Dynamics (MD) simulations to evaluate the stability, conformational changes, and physical behavior of the protein-ligand complex over time.
High-Throughput Virtual Screening (HTVS) methodologies to screen large databases of chemical compounds against a target protein.
Advanced binding free energy calculations using MM-PBSA or MM-GBSA protocols to achieve more accurate binding energy predictions.
Structure-Based Drug Design (SBDD) and lead optimization techniques, using docking insights to rationally modify ligand structures for enhanced potency.
112.9K views2.5Klikes25:15Original Release: 2020-07-18
[Music] [Music] welcome to bioinformatics with bb channel my name is babajan bananganapuli an associate professor in bioinformatics in this channel we will cover various biological data analysis concepts in genomics transcriptomics proteomics and metabolomics if you like this content please subscribe to our channel [Music] bioinformatics with bb channel reached 2 000 subscribers within a month i want to give a big thank you for watching and subscribing to the channel [Music] last video we learned about a molecular docking of a protein ligand molecule using auto dark so in this video we look on to how we can analyze our interpret the docking results this step is very important and very crucial if you are going for publication or if you want to publish your data in highly repeated journals okay so here uh what what the major things we are going to cover in this in this video we are going to cover about how we can retrieve the auto doc results okay so we are going to see about the dlg file analysis we are going to see about what are the how we can save the protein lag and complex in from the auto dock and how to convert that put in like and pdp to pdb format file so along with that one we are also going to see about how we can visualize the protein ligand molecule in 3d and also 2d format let's start if you recall previous video the main objective of molecular docking is to attain the ligand receptor complex with optimized conformation and with the intention of processing a less binding energy okay so the net predicted binding energy from the auto dock reveal the terms of various parameters such as hydrogen bonds electrostatic interaction torsion free energies and dispersion and repulsion values like van der waal interactions dissolvation energy total intramolecular energy and unborn system energy okay so let's check dot dlg file docking log file which we have generated from the auto dock what the information is presented inside that file okay this information is very helpful for us we have to create a table like this you can see here the table for your docking analysis we have to use the rmst values and also the binding energy very important one and also the imaging construct this table i got it from some publication so one of one of our publication so we added these values here okay these values in the form of a table we added we took binding free energies and also the inhibition constant and this number of hydrogen bond amino acid interaction will see in the visualization part okay so these are the two very two important things we have to we have to consider are we have to retry from the dot dlg format file so just let us check the dlg format file so this dot dlg format file we will get it from the docking results just type rmsd table okay so click on rmst table so if you see here rmsd stable now it will show you various classes of information is there inside this table okay so here is a ranking pattern what is the ranking pattern is there what is the sub ranks are there in which run the binding energy has been you received and what is the cluster rmst is there reference rmst all this information you will get this from this values so already i told you what is the binding free energy it's a combination of various things like hydrogen bonds electrostatic torsion free energy dispersion repellation energy and total intermolecular combination of all this thing you will get this binding free energy of a ligand protein molecule so if you see this cluster rmst cluster rmsd is a root mean square difference root mean square difference in coordinate between the docking conformation and cluster reference so the reference rms is a root mean square difference between the docker complex and the input structure so here info inhibition constant if you see the inhibition concept that is also very important one if you scroll down to the little bit down you will find the complete information about each and every round you can see the cluster one rank one this ninth run showed the highest highest rank out of the all the 10 runs has been done by the auto dock so you can see it the estimated free binding energy as i told you here it's a combination of various things like contortion free energies unborn system energy and different type of non-covalent interactions like a wonder wall hydrogen bond dissolvation energy so combines together you will find the free energy values along with that you also find this inhibition of estimated inhibition constant so this ki or inhibition constant is correlated to the half of maximal inhibitory constant at which 50 percent of the protein is inhibited okay so this quantity measures indicate the amount of specific drug are substantive need to inhibit the biological process okay so the k the innovation constant is a very important score to consider that can be measure the effective of compound as a drug but you have to remember uh so we are doing here a theoretical approach we are just predicting this one you cannot judge based upon this theoretical value the drug likeness of your compound so you have to do it's mandatory for us to come to the conclusion about the drug by doing the experimental studies only so what i'm going to keep in this table so i'm going to keep this reference rmsd okay so here the reference rmsd of this structure is 0.85 okay so i'm going to keep this 0.85 here and the binding free energy minus 14.17 calories per mole and also the inhibition constant i am going to add 41.06 pico molar so these are the three major thing i am going to consider from this table okay so this number of hydrogen bonds and also the amino acid interaction we are going to see in the visualization part apart from various scores in docking file the visualization of receptor ligand geometries and the interaction will give us better understanding in in drug development procedure so it's very important for us to understand or to visualize or to represent the interaction in between the protein and ligand molecules so there are various approaches are there where we can check the visualization of talking ligand complex by using the various software service tools so here the plp is there okay so the plp is considered to be as protein-like interaction profiler protein plus leak plot so these three different tools will give you a different visualization pattern for us like 3d figures 2d figures and you will see that some in-depth analysis like identification of cavities and also you will find the two-dimensional structure also it's very easy for us to understand what are the type of interactions are there so apart from that primal is also one of the option for us where we can visualize our protein on ligand complex the major limitation with the pymol is it will show you only hydrogen bond interaction for you so it's not going to show you a other non-covalent interactions i'm going to show you some of the softwares for you where it will show your various kinds of interaction between the protein and ligand molecule so in first step what we need to do is we'll save the docking complex as a pdb format file okay then we will start to visualize that protein okay let's start so the first step is we have to convert to the pdb format file okay so we have to convert the dlg format into a pdp format well it's the first step so go to auto doc so click on analyze docking open so here i save this one as a dlg format file okay so dlg format file open a dlg format file go to analyze micro molecule open so if you click on open it will automatically show you a ligand confirmation sorry put in put in like and confirmation file so again go to here analyze confirmation play so click on this and option okay so here show information so you can see here uh it will show you a different type of information also for you so as i as i told you i just want a best confirmation you can see here so you will see the different confirmation is there we already know the ninth confirmation ninth run is the best confirmation we got it which is having a score of minus 14.17 okay so once you once you click on the once you got this ninth run ninth run if you got in doubt which run exactly you got the highest rank go to dlg format file and check this one here the number of runs so it's the ninth one you got the 14.1 this is the highest binding free energy value so here directly jump into the ninth one okay so here click on write complex okay you can save this one as a pdbqt format file initially you can see here first we have to we cannot keep this one as a pdb format file first we have to save this one as a pdb cube deformation file so i'm going to save this one as a pdb qt p q d okay so here i save this one as a one dot pdb qt save okay so now i saved this one okay so you can visualize sp1.pdbqt in pi mode if you go to pi mode here click on this one you can drag this one you can visualize this protein and ligand molecule but in some of the software they are not going to accept this pdbqt format that's why we have to kind of we have to change our we have to change the format of this pdb qt to pdb format so we can you can do this one in open bible so here we have to save we have to first click on the pdb gamma qt format file okay so here give the path and you can have to save this one as a protein databank format file so put in database format file output you can save as a best document dot pdb okay so best talking that pdp save on desktop click on convert okay so if you can't click on automatically this all the component sources all coordinates has been written in the best talking format file now close this one now we have the pdb format file now this pdb format file can helpful for us to further visualization of your protein and ligand complex by using the various softwares so let us start with the first one the plp protein ligand interaction profiler so in google you have to type this protein interaction put in like interaction profiler so also i'm going i'm going to give this a web link in the description box so here this protein ligand interaction profiler is a web service fully automated okay so you just need to provide a pdb structure so whether it your own pdb protein like and complex file or you can upload uh the already crystallized protein ligand by just giving the pdb id to it so here uh it will it will give you a complete list of non-covalent interaction in between the protein and ligand molecule so let us start so here i am going to give pdb structure select this pdb so choose beststockingconfirmation.pdb file okay click on run so click here small molecule it will show you the name of that molecule and it will give a complete list for you so here it will show you various kinds of interaction you can see here not only it will show you image and also it will show your tables also for you what are the type of interactions are they in between the protein and ligand molecule you can see here so there are some hydrogen bonds also is that they mentioned about what is the distance in between the hydrogen bond you can see a 2.75 angstrom the glutamic acid alanine argentine cell in asparagine also itself and also it will show you what are the donors and acceptor regions that are in the protein region protein and ligand molecule region so along with this it will show you various kinds of interaction as i told you so if it will show you a hydrogen bond interaction hydrophobic contacts pisces stacking interaction salt bridges water bridges halogen bonds metal complex it will show you so many things for you so not only it will generate your high quality images and also it will give us a primo session file to customize our pdb file where we can change the style of the pro sorry the visualization style of the protein and ligand molecule okay so you can say these images directly click here uh the png format file if you want a png format file you can save this one as a png format file okay where you can see this image like this and also if you want to save this table it's very easy for you you can just copy this table and paste in your uh in your word or text document okay so here if you want to save the primo session you click on this primo psc file so here on desktop open pi mode so file open desktop and best talking that psc file okay you can see here it will show you a confirmation of protein and ligand molecule for you so if you want to change uh this protein ligand molecule as a stick format we can we can change that information okay so here go to sequence so go to sequence here so click on win the first drug molecule here preset ball and stick okay you can see here so it had shown in a ball and stick formation so it will change this conformation as a ball and stick for you you can change the various confirmation whatever the confirmation you want for your publication purpose okay this is about the plp the next database we are going to check protein plus protein plus server so here also very simple one you just need to provide your protein complex file so choose best docking complex go so here in this protein plus it not only generated 2d figures for you and also you can perform the in-depth analysis in between the protein and ligand complex you can see here visualization resolution also one of the key here you can change this confirmation here the cartoon whatever the confirmation you want you can change here itself background so whatever the background you want you can change this information here so now so you can the various various options are available for you we can check the hydrogen predictions drug and ligand molecule binding score 2d view and also if you have a if you have a docking complex in between the protein and protein you can check the put input interactions and also you can see protein metal complex geometry so if you want to see the water molecule placement you can see so we can do so many things by using this tool so for our for our protocol we are going to check the two things one is a drug score okay so click on do g site score scorer so you have to select the pocket okay don't select the sub pocket so here the pocket so automatically so we are going to check the drag ability of the ligand molecule so if you want to check the properties also this option is available so here in this option we're going to select this drug ability click on calculate so here this is the results we got we're going to get this in the result form okay if you click here in a show option it will show you a the where exactly your ligand has been in which specific pocket your ligand has been interacted in the protein mole okay so it will provide you a surface area the cavity that a pocket a surface area in a protein and also it will show your drugs codes also for you if you want to know more about this one i will just provide the link for you in the description box about the doji site scorer how you can interpret the set drug score okay so along with this one i'm going to show you one more thing for you here post view 3d interaction diagram so click on this one click on post view so here it will show you a ligand molecule so it will actually ask you what are the ligand molecules are there you just need to click here in this ligand molecule so it will automatically load this name of this like it molecule and click on the calculate so here you can see the results it will show you a hydrogen bonding interaction along with the drug molecule in a 2d format okay you can you can save this image in a pdf format or png format file so click on this png format file file so here i'm going to save this one you can check this putting unlike an interaction into the format file this is how we can use this protein plus tool to visualize the 2d gram and also to calculate the drug likeness of your ligand molecule okay so as i told you you can use all other options depending upon the type of analysis you are doing you can use all this information so next one is we are going to work on the one over another tool called as a leak plot so the link plot is from the ebi okay so you have to download this software so click on this link plot gu format file and click on download so once you've done this one legend plus it is supported with the java you have to install the java also in your system okay so click on this link plus so close click on the open pdb file okay so you browse desktop here here the pdb select the pdb and click on best docking will show you uh what is the ligand inside your protein inside your complex okay select that one click on run so here it will show you 2d diagram along with the hydrogen bond interaction you can see here there is a hydrogen two hydrogen bond interactions are there in between the protein and ligand molecule which distance is around 3.15 with the glutamic acid and this uh 3.01 with the alanine molecule so along with this it will also show you a where the summon acid cavities surrounding to this particular truck you can change this one if you want to add a specific interaction in for example if you want to add a hydrophobic interaction there is option is available for you you can click the hydrophobic and health interactions of the protein and glycogen molecule so you can change the colors so you can change the colors here if the type of interaction you want type of bond you want you can do many things here once you've done this one click on this right ps file so here post script format save this one the landscape current selected broad okay so click on save now it has been saved as a ps format file you can use you open that one in a photoshop or in any image formatting tool uh to save this jpg or a png format file so here the three tools are i showed you where you can generate 3d format files under 2d format files so in primal one few more options are available if you want to work with the primol only if you want to show only the hydrogen bond interaction so then you can work with the pi mode is the best one also okay so you can you can drag any file pdb format file or pdbqt file so here i just drag this pdb qd file first i just go to the primal action preset publication mode okay so here now i selected this ligand molecule click on this ligand molecule here click preset balance stick now it representation is much better if you represent in a balanced stick matter it will representation is much better for you so here go to file again the selected one find find polar context to any atom so it will show you the hydrogen bond interaction in between the protein and ligand molecules so now you can see here we don't know which specific amino acids are there so for this reason you have to go to show line so select this one so whatever the interacting regions are there select the specific command assets okay so now i selected this one click on hide lines now click select revision show sticks now you can see here so now the protein ligand interaction is very clear for us okay if you want to hide the carton molecule if you want to show only the sticks and the drug molecule just simply go here hide cartoon now it will show you only interaction in between the amount assets and the ligand molecule now you can save this image if you want you can see here click on this file export as image png format file okay you can save this one as a image so you can change the background you can check our previous primal primal lecture where you can change the background colors you can share you can annotate this amino acids also by adding different parameters like surface and also if you want to add some mesh to it you can do many things these are the two things you definitely need for the publication one is preparation of a docking results in a table format and also the visualization part okay so thanks for watching if this video is helpful to you please give a like and if you have not yet subscribed please subscribe to the channel for more amazing contents in [Music] [Applause] bioinformatics [Music] [Applause] [Music] [Applause] [Music] you
Up Next

10:01
Michaelis-Menten Equation: Enzyme Kinetics Explained
@quickbiochemistrybasics
630.1K views•2020-02-05
14:12
Quantitative Real-Time PCR (qPCR): Principle, Method & Data Analysis
@animatedbiologywitharpan
129.2K views•2023-09-06
23:33
Microbial Degradation of Plastics: Biodegradation Pathways & Sustainability
@majeedhammad
2.9K views•2021-04-11
16:04
CRISPR and Genetic Engineering: How Gene Editing Works and Why It Matters
@kurzgesagt
30.5M views•2016-08-10
Related Study Plans & Knowledge Roadmaps
Structured learning paths in Biotechnology
biotechnology
AAV Production: Transfection, Prep & qPCR
01Introduction to Gene Therapy and AAV Biology
02Mammalian Cell Culture: Suspension HEK293 Cells
03Upstream Bioprocessing: Triple-Transfection Optimization
+ 2 more learning modules
18h5 modules
Explore Roadmap
biotechnology
Building Gut-on-a-Chip: PDMS, Cells & TEER
01Foundations of Microfluidics and Gut Anatomy
02Cleanroom Fabrication & PDMS Soft Lithography
03Epithelial Cell Culture and On-Chip Seeding
+ 2 more learning modules
26h5 modules
Explore Roadmap
biotechnology
Optimizing CFPS: E. coli Extract & Yield
01Fundamentals of Molecular Biology and Translation
02Introduction to Cell-Free Protein Synthesis (CFPS)
03Preparing E. coli Crude Lysate (The Extract)
+ 2 more learning modules
19h5 modules
Explore Roadmap
biotechnology
Haematococcus PBR: Design, Stress & Astaxanthin
01Biology and Life Cycle of Haematococcus pluvialis
02Bench-Scale Photobioreactor (PBR) Design and Engineering
03Culture Media Formulation and Inoculation
+ 2 more learning modules
15h5 modules
Explore Roadmap