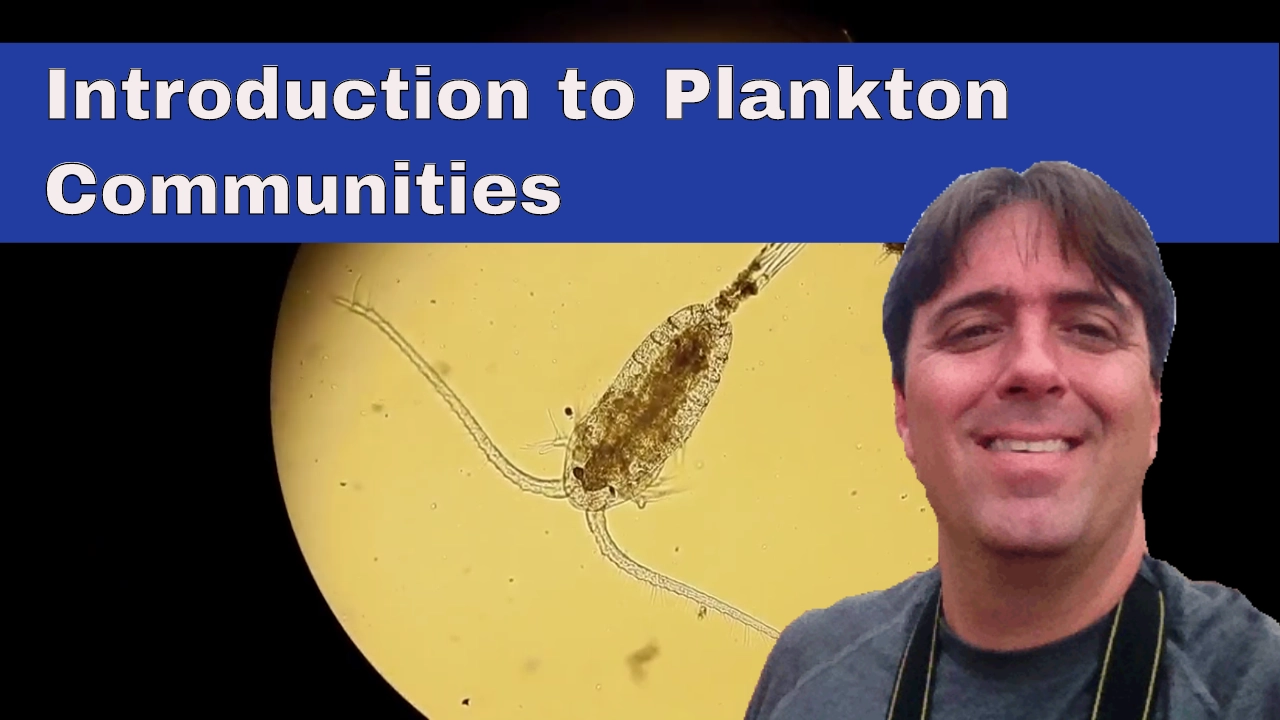








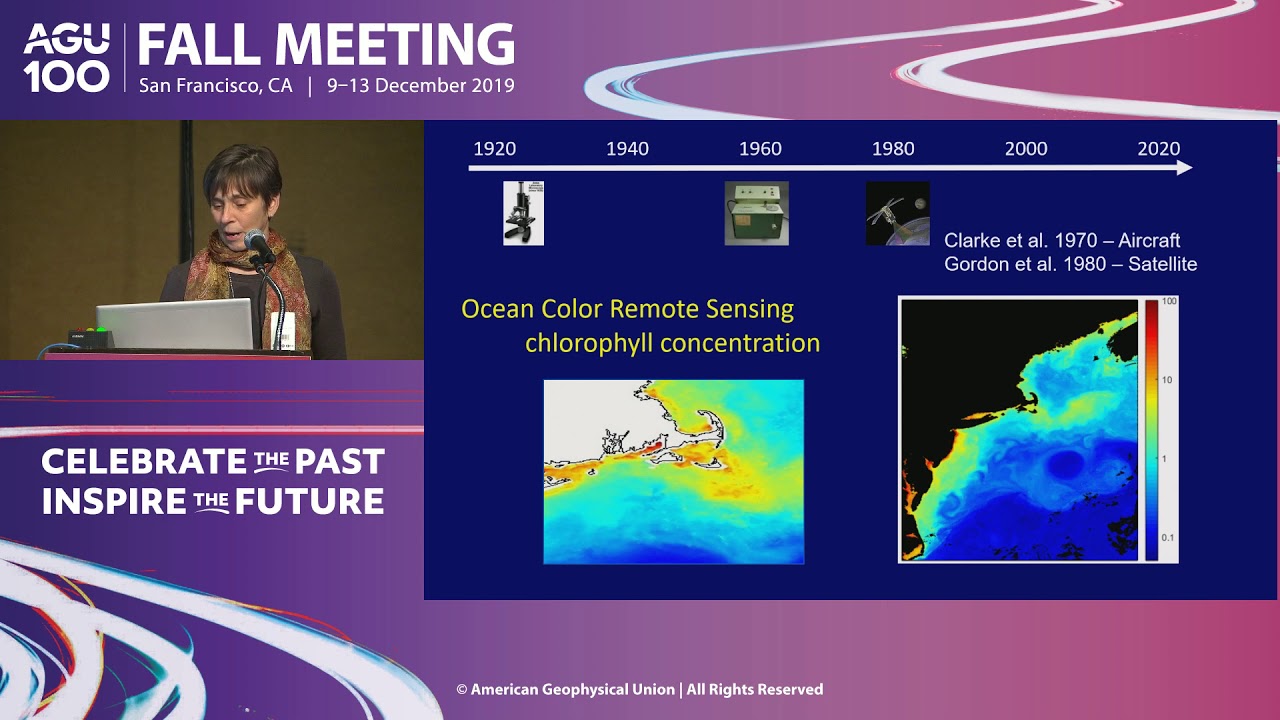










Automated underwater imaging systems, such as FlowCytobot, enable high-resolution, continuous monitoring of plankton communities in the ocean by combining flow cytometry with video imaging. This technology allows researchers to count individual cells, measure their sizes, and identify species at unprecedented temporal and spatial resolution, revealing ecological dynamics like seasonal blooms, temperature-driven growth rates, and species-specific mortality factors that were previously impossible to study with traditional sampling methods.
Ocean Sciences 2020 Plenaries: Plankton Tech & Ocean Modeling
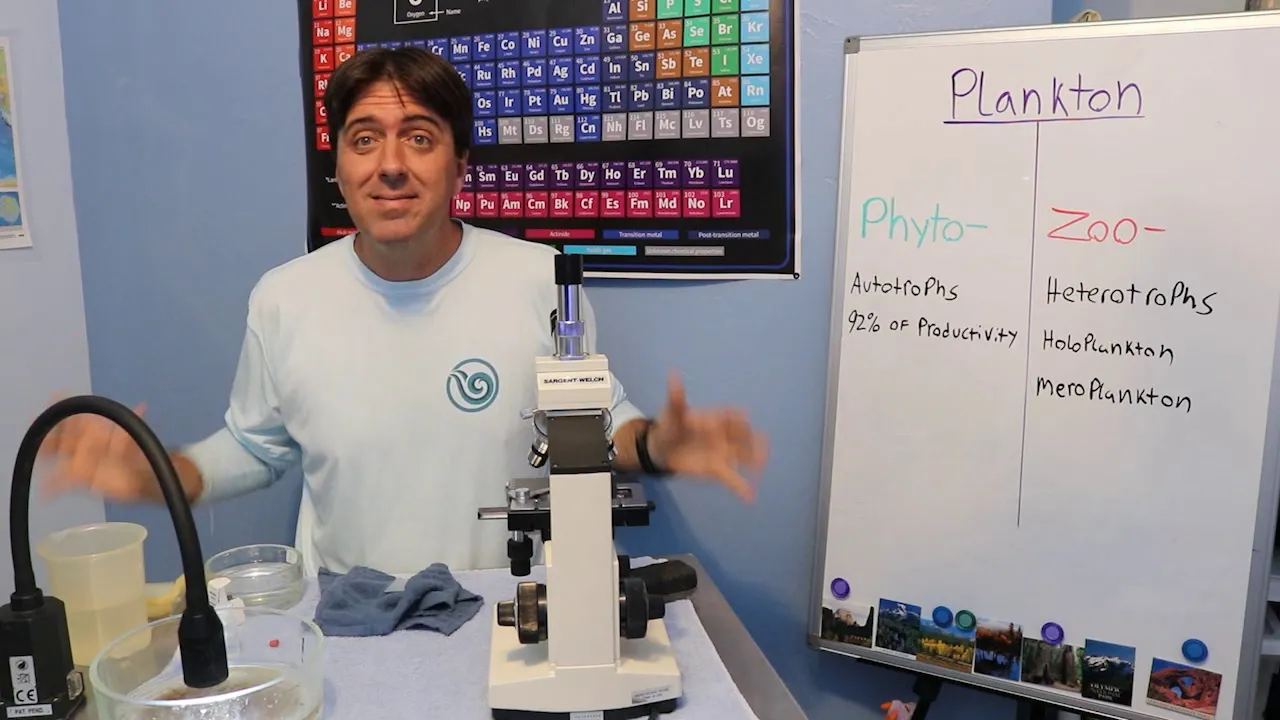
Added:Basic marine biology, specifically the distinction between phytoplankton and zooplankton and their role as the foundation of the marine food web.
Fundamental principles of physical oceanography, including ocean currents, global conveyor belts, and wind-driven circulation.
An introductory understanding of scientific modeling, specifically how mathematical equations and computer simulations are used to represent physical systems.
The general ecological impacts of anthropogenic stressors, such as rising global temperatures, ocean acidification, and plastic pollution.
Advanced marine imaging technologies, including in-situ flow cytometry, underwater holography, and the use of machine learning algorithms for automated plankton classification.
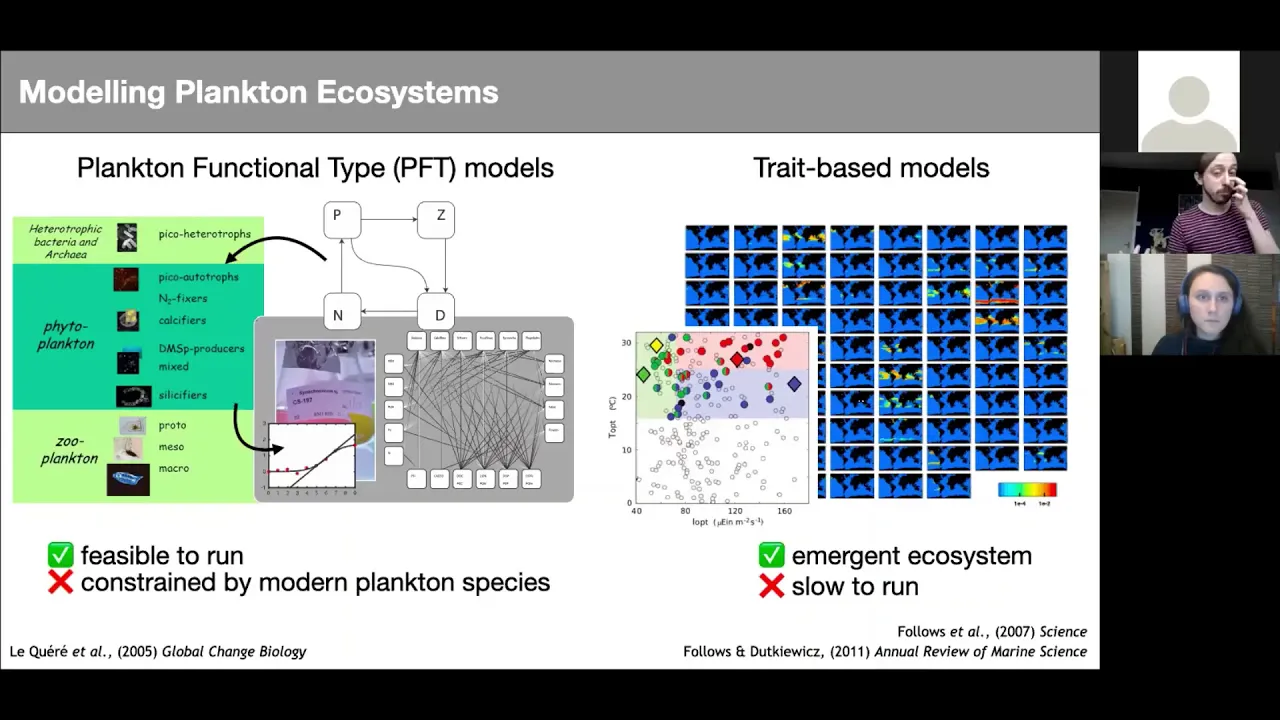
Biogeochemical ocean modeling, focusing on how plankton dynamics influence the biological carbon pump and global climate feedback loops.
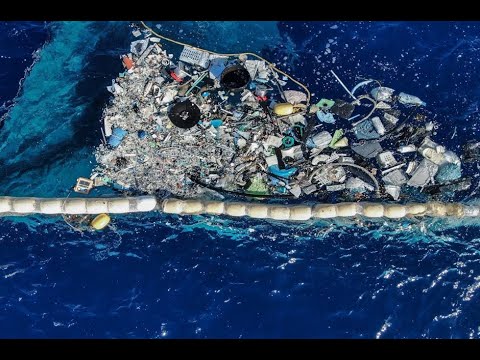
The transport dynamics of microplastics, analyzing how ocean currents, biofouling, and turbulence affect the drift and settling of synthetic particles.
Application of high-resolution ocean models to environmental policy, such as planning Marine Protected Areas (MPAs) and optimizing ocean cleanup strategies.
1.5K views25likes2:04:51Original Release: 2020-02-19
[Music] ladies and gentlemen please take your seats our program is about to begin thank you [Music] [Music] [Music] [Music] please take a moment to silence all cell phones and mobile devices video and audio recording of any kind is also prohibited thank you [Music] [Music] [Music] [Music] [Music] ladies and gentlemen please take your seats our program is about to begin thank you [Music] [Music] [Music] please take a moment to silence all cell phones and mobile devices video and audio recording of any kind is also prohibited thank you [Music] good morning I hope you all have had a fantastic start Tirion Sciences meeting experience whoo I'm loving the enthusiasm on behalf of the organizers I'd like to thank Daniel Avila and the Berklee College of Music for composing that original musical piece you heard coming in during the introduction my name is Kristen Bock I'm an ocean an associate professor in chemical oceanography at the University of South Florida college of marine science and I'm honored to be up here today as the oceanography Society co-chair for the 2020 ocean sciences meeting this meeting gives us all the opportunity to share latest findings and inspire new collaborations across ocean sciences as you know this meeting is co-sponsored by the American Geophysical Union the Association for the science of limnology oceanography as low and the oceanography Society toss each of these organizations with the engagement of us as individuals and as a scientific community works to facilitate opportunities to bridge disciplines connect communities and make lasting partnerships in science as an interagency effort the ocean sciences meeting is a great example of collaboration bringing together thought leaders of the international ocean sciences community from students and early career researchers to senior scientists in order to advance the knowledge of the oceans and ultimately to improve the health of our planet I'm excited to introduce two of these thought leaders here today for the science plenaries a biological oceanographer an inventor heidi salsa is a senior scientist at the Woods Hole Oceanographic Institution and she currently holds this Daniel Stanley W Watson chair for excellence in oceanography in her work heidi has advanced research his abilities to study microscopic organisms that fuel ocean food chains interact with Earth's climate and sometimes produce harmful algal blooms that threaten both ecosystems and human health Heidi also serves as lead investigator for the eastern excuse me the Northeast US long term ecological research project and she recently stepped down from the roles from a rolls chief scientist of the Martha's Vineyard coastal observatory after 14 years she is active in many national and international roles she was named a Woods Hole Oceanographic Institute ocean life Institute Fellow in 2003 other accolades include the presidential Early Career Award for scientists and engineers the Aaron's Award for Excellence in teaching advising and mentoring the NASA agency Honor Award the Woods Hole Oceanographic Institute senior leadership prize and in 2018 Heidi became a fellow of the oceanography Society and then in 2019 she became a sustaining fellow of the of as low please join me in welcoming Heidi saucing [Applause] [Music] thank you so much Kristin good morning everyone I feel so incredibly honored to be speaking in this session and I thank all of you for being so generous with your time and attention it's truly overwhelming this is really an exciting time to be a plankton ecologist in the ocean sciences there are people all around this room giving presentations this week that touch on the many reasons why that's true before I dive in my talk into my personal slant on why this is such an exciting era I want to set a bit of historical context and this is because many of our big questions and conceptual foundations are not new at all in fact they've been around for a very long time in the early 1900s when he referred to plankton as this blood of the sea who Victor Henson was already emphasizing the central role that they play in ecological systems and he was pressing for systematic and quantitative study of their distribution and function in those systems but of course the tools that these guys had for that kind of quantitative studies were very limited henson and we today are concerned not only with snapshots of plankton in the ocean that you can get say with a net but also with how they're changing through space and time we think about frameworks like this where their dynamics are depend on a bunch of physics that move them around and the ocean will hear all about that from Eric in the next talk and then of course there are these important biological terms that represent how they grow and die and really these are about I would say equally important and difficult to quantify in nature we know though that it but for many types of plankton including phytoplankton that I'm especially interested in and we'll talk mostly about today these rates of biological change can be fast the time scales can be hours to days and that all while we're interested in the cumulative effects of these dynamics at much larger scales so the range of relevant scales is enormous we still make great use of bottles and nets today but these tools really can't tackle this scale challenge so at this point I think maybe you see where I'm going you can anticipate my excitement today is linked to new approaches that I think can finally crack this nut some of you I know will be familiar with this topic you think about it a lot and you might be thinking at this point ok there she goes again Heidi's a little bit slow to the party because you know since the 1960s 1970s at least for phytoplankton we've had incredible tools for characterizing a huge range of space and time scales things like ocean color radiometry from Earth orbiting satellites fluorometers that we now hold in our hand and we can deploy to get both high resolution and coverage these approaches lump all the phytoplankton together then provide measures of the total chlorophyll this is great because that's the primary pigment they use to capture energy from the Sun and ultimately to photosynthesize the challenge is in that lumping though because phytoplankton are really diverse this is an electron micrograph of one of the smallest phytoplankton Sinica coccus now it's shown in scale with some example nano plankton to flagellate some of the many species of dinoflagellates that are important in the ocean then a single-cell diatom the dark spots in that cellar where the chlorophyll is in the chloroplast and then we'll zoom out to relatively small diatom chain these can be up to millimeter scale do you see the original picot planked er it's up there not even at the pixel resolution on this screen and there are typically thousands even hundreds of thousands of these tiny cells for every diatomic chain in a few drops of seawater these cells of course are diverse not only in their size and shape but also their genetic and biochemical potential their physiology the niches they occupy and ultimately that functions that they play in the ecosystem we love this idea of large diatoms like chain forming species that supporting short food chains that efficiently export production to higher trophic levels and and even to the deep sea while we think about the Pico plankton as part of a much wider web of interactions we call the microbial loop that's thought to be largely recycling in nature my point here is that the different types of organisms matter a lot you know think back to making that big pile of chlorophyll that you might be using to assess an ecosystem and then deciding it doesn't really matter if the piles made up of blades of grass or redwood trees which sounds kind of ridiculous right but that's exactly what we're doing in the ocean only at the microscopic scale so this is where I want to introduce flow cytometry to this story this is a technique where seawater is pumped in a thin stream so thin that the particles are stretched out and are going single file through a focused light source usually a laser beam and each as they go through the beam each particle is measured the amount of light they scatter how much fluorescence they emit this is a very common technique in microbial ecology it's used in labs around the world to study especially small phytoplankton it's ideal for pico plankton and small nano plankton it doesn't work as well when we start talking about big micro plankton with like shapes so my colleagues and I have advanced a solution for that that combines flow cytometry with video imaging in this case just downstream of the laser beam the particles are exposed to a short bright flash right when they're in front of a microscope objective and the exposed frame from a digital camera is stored the results are these kinds of very high-resolution images about a micron resolution of each particle we can see enough detail here to characterize a lot about the cells and often including their taxonomic identity because this approach uses very precise flow control and the laser signals to trigger the imaging we really maximize the capture of images of targets in good focus this is an example replay of an actual seawater sample just a few drops analyze this way the black region is the whole camera field and you see each separate trigger and associated image coming along in the flow this is essentially the raw data so you can see that consistent image quality I've just held the images for a split second here so that you can see them before they go by they're really coming along separately what the replay is done this way so you can see okay so now the fun begins many years ago when I started as a postdoc in Woods Hole I began what would end up being a long-term collaboration with my wonderful colleague Rob Olson Rob has many talents as an ecologist and oceanographer he is also an absolute wizard with flow cytometry and our work together led first to this submersible flow cytometry we call flow side ABAT that targets measuring the small cells pica plankton and then later on we developed the sister instrument optimized for micro plankton that includes the imaging I was just talking about so I've compressed years and lots of work into you know one slide here the takeaway I want you to keep in mind is that these approaches adapted from what we can do in the lab but now I'm working in the ocean allow us to rapidly count size measure other characteristics of cells and it works at the level of individual cells in many cases that we can identify and these technologies were designed specifically for extended and unattended deployments in the ocean so back in 2003 we first deployed Flo Saito bot at the Martha's Vineyard coastal observatory then a fledgling cabled site near Woods Hole and this allowed us to document the dramatic spring bloom of Seneca caucus a Pico cyanobacterium that dominates the small cells in this system this is cell concentration on the y axis on a log scale so they're increasing many orders of magnitude in the springtime in this system and I must emphasize these are automated observations and time series has hourly resolution so this was super exciting at the time but speaking of glossing over a lot this absolutely pales now in comparison to what we have with the where these observations have are ongoing and have produced this incredible multi-decade time series of this organism I need to just pause here for a moment to urge all of you who are not ecologists to think for a moment about to have an inkling of how amazing this kind of data is for us as ecologists there's absolutely no way we could get this kind of taxonomic temporal resolution and extent with our conventional approaches for sampling organisms some of you who have not heard me talk about this before are probably wondering okay well that's really cool but do you really need to measure that organism with hourly resolution for more than a decade we get it you know they're going up and down every spring in her thesis research Kristen hunter severa showed very elegantly that that resolution is extremely powerful with that detail we can extend the flow cytometry results beyond just counting cells and we can begin to pose questions about the regulation of the spring bloom not just know that it exists but why is it happening and why does it happen the way that it does so to do this we capitalize on the cell size measurements that are made at the level of individual cells as they go through the laser beam and we measure their light scattering so for each day in the time series this is an actual day of data we can measure the changes over the day in this distribution of cells within this population you can see that the cells tend to be small at dawn the whole population tends to get larger during the day as they photosynthesize and then they get small again at the end of the day when they divide we in Kristen's work she coupled these data to a size structured matrix population model she used a statistical approach to best fit the model to reproduce the distributions in the data and then with the model we can compute the number of cells that have to divide in order to generate the observed patterns in the community we can apply this approach to each day in the time series and then we add a brand new time series which is entirely independent from the cell concentration so that's cell concentration again shown in the top panel there and now this lower panel is a time series that reflects the physiological regulation of how fast the cells can grow and divide in their natural environment and from this we can learn that division rates in the spring follow a very systematic function of water temperature these results are providing us with pretty direct support for the idea that these tiny cells are physiologically limited by low temperatures in the winter time and that that spring bloom kicks off and is the limitation is slowly released when they start dividing faster as the water warms kristen has also shown that that seasonal cycles is is not as stable as it first appears it's been shifting in the first decade of this time series we observed systematically earlier spring warming which was directly reflected in earlier Seneca caucus blooms these plots show year date crossings for isolines of first temperature and then cell concentration and the blooms and the warming and the bloom were coming about 20 days earlier over that decade and notably now we can we can show not only that the bloom came earlier in warm years but also that that was tied directly to earlier increases in the rate at which they're dividing so again this direct physiological link to temperature these results of course raise questions in our minds about the implications for this ecosystem as warming trends continue in this region will the growing season for Seneca caucus continue to expand and what will be the implications of that for the rest of the ecosystem of course now Seneca caucus are not the only pika plankton at M VCO in that in that system and as part of her early PhD research Bethany Fowler has been showing that we need to consider the other types as well a mixture of species of small eukaryotic phytoplankton are also important though they're much less abundant than the Seneca caucus which you see here in green and those P Co eukaryotes in purple but it turns out that using similar approaches to Kristin hunter severa Bethany has shown that these small eukaryotes are typically dividing two to three times faster than their Seneca caucus partners and as a result these tiny eukaryotes contribute more to primary productivity in this system than we might expect just from their concentration bethany's work is also suggesting that these tiny Pico eukaryotes are preferred by grazers in this system because we have the high resolution cell concentration data and also the independent division rates she's able to quantify group specific loss rates we can't be sure what how much of that's grazing versus other sources of mortality like viral Isis but the rates in total are much higher for the Pico eukaryotes suggesting that they contribute a lot to fluxes through the food web relative to their abundance so with these approaches we can now quantitatively assess these important characteristics of communities and the important differences among the partners in this community among and we these differences we can detect them among what might mean might otherwise consider to be fairly similar we small plankton in this ecosystem ok so there are much more than Pico plankton in the waters the Martha's Vineyard Observatory these examples of plankton imaged in situ emphasize the huge range of taxa that we see in the larger organisms you see their shapes sizes and the detail that we can capture with this kind of automated imaging I'm like just super excited to tell you that this is the tiniest slice of the data that we have working here we've been deploying imaging Flo Saito bot the partner to the flow site about instrument at the observatory since 2006 this record now comprises over a quarter-million samples and over a billion images so this is truly in big data in marine ecology and it has prompted us to invest a lot in data and information systems and I'm really proud to say that you can access and use all of these images and the image products that are generated from our automated work throu flows through the IFC be dashboard I'm be interested to see what happens if a whole bunch of you hit the server at the same time but check it out sometime when you have a lot of time to browse you can also you mean to machine and and download as much of the data as you want without having to use the web interface and I want to here bring attention to my wonderful colleague Joe Future L who has really made this data system his personal mission and he works with the ultimate respect for our scientific take goals with these data I wish you all partnerships with data scientists who are willing to jump up from their computer systems at a moment's notice and go out on deck of the ship in their work vests he's an amazing guy ok so given the sheer number of images we can't possibly look at them all so we've developed automated analysis procedures that now let us produce tacks on specific time series for extended periods with very high resolution so here I'm highlighting just one species the biomass dominant diatom in this system so it's sort of a counterpoint to Seneca caucus being the dominant pico planter this is the dominant micro planter there's a lot of variability here but if you look closely you can see that the biggest blooms occur pretty systematically in winter time so very different from the Pico plankton whose highest concentrations were in this summer once again with this detailed data we can go beyond just documenting these patterns and we can begin to ask why do these diatoms bloom in the winter and I have to say this question really nagged us for a number of years we sort of waved our hands about nutrients and tried to find some physical oceanographers to help us figure out if there were more nutrients and it wasn't really leading us anywhere and then Emily peacock uncovered a really important piece of the puzzle the high-resolution imaging that we're doing made it possible to detect this species specific parasite that we previously had no idea was important in this system and but we now know causes high levels of mortality in this diet um host these parasites are small flageolets that get inside the diatom they feed on the protoplasm they reproduce inside the empty host Russ jewel and then they burst out moving down the chain to infect the next one or moving swimming through the water till they find another host to it to infect so like I said we had no idea that this was important in the system for years but I want to emphasize one of the incredible powers of this kind of data set is that once Emily discovered this phenomenon several years into the art into the time series she was able to go back to the entire through the entire digital image archive and show that these kinds of infections are recurrent this lower panel shows the occurred and a fraction of infection in the population over all of these years and we now believe this is a regular and very important source of mortality in this diatom host we also find that there's a very striking pattern again with temperature this plot shows infection rate observed each day against water temperature on the points on the plot are color coded according to the host abundance on that day so what we find remarkably here is that there's an almost complete absence of infection when the waters are colder than about four degrees these are our times when there's plenty of hosts around to support an infection and in fact more than at many other times of year and we now think that those cold waters provide this diatom a sort of refuge from this big source of mortality associated with the parasites our analyses also show that we can explain a lot of the overall variability in bloom magnitude shown here on the on the y-axis and a measure of the magnitude of each of the individual bloom events and we can explain a lot of the variability according to the prevalence of infection by the parasites on the shown on the x axis so these the biggest blooms are occurring in the cold winters when there's low infection rates our time series is now long enough that we have some anomalous conditions that help to sort of support this level of understanding and a notable example is the winter of 2012 this was the warmest winter on record and water temperatures never got colder than about four degrees C at the observatory parasites were present all winter and the diatom bloom essentially failed so again we have new questions about the as climate change continues to impact this region about what the implications of this will be we may expect that these coldest winter water periods may shorten they may disappear altogether and we now have to wonder if this species that is currently dominating the diatom biomass may not be so in the future there will be some community ships as a final point on this I want to mention an important implication for ecosystem structure and function remember again this conventional paradigm the diatoms are part of these short food chains with efficient export production but we have to now contrast this view with these the role of these nano-sized parasites that I've been talking about they're likely part of the microbial loop so we have to consider that there's an important pathways shunting diatom production right into the heart of the microbial loop okay on the topic of the microbial loop a central component of that are perez Owens and I just want to briefly mention that in her thesis work Emily Brownlee showed how well the ofcb imaging approach works to characterize these really important single-celled grazers they tend to be quite fragile and difficult to study with other approaches and at a Museo we can produce species specific time series for these type of micro grazers just like we can for the phytoplankton we typically think of these organisms because consuming Pico phytoplankton maybe small nano plankton if mouths are big enough but the high-resolution images at NBC Oh also emphasize that many types of small grazers can attack much larger prey things like diatoms they use things like feeding tubes and external sacs that they externally digest large prey in or they can even stretch their soft bodies around large prey to digest them so again like those deadly nano sized parasites I mentioned this adds even more questions to a common view that diatoms are principally consumed by relatively large so plankton like crustaceans you know you know even the basic idea that big things eat littler things may mean that may not be such a such a good bet we are certainly not the first to show these kinds of phenomena but this imaging approach with the time series provides a unique way to learn more about these processes in how important they may be in natural communities harmful algal blooms considering this year's theme for our conference I want to take just a few minutes for a sidebar I've been talking a lot about the important functional roles of different kinds of plankton we know that sometimes the balance shifts to bloom species that can have harmful effects on ecosystems and even on humans through production of toxins that either enter the that can enter the food chain or have other health impacts I want to put out a suggestion of a FCB as a small contribution to science for a resilient planet we developed this technology really for basic research but it has also already proven to have direct applications in hab detection and response the first demonstrations of this were led by Lisa Campbell's group working in Texas waters in 2008 they ofcb time series data made if possible for them to provide an alert about a completely unexpected toxic bloom the first of this diatoms excuse me dinoflagellate species to cause a toxic bloom in this region so the resource managers weren't looking for it this event did ultimately lead to contaminated shellfish that could have made people very sick but but the early warning prevented that in this area I've see bees also been used to show things like when small-scale but very intense patches move into the Port Aransas estuary from offshore origins these patches are so intense that there are small-scale that they're easily missed by intermittent manual sampling so the continuous monitoring that I have CB can do is critical this happens to be the species that causes the famous toxic blooms along the Florida coast and it's increasingly a problem in Texas as well other groups are now extending these kinds of have applications around the world just a couple more examples around the u.s. Mike Brosnahan scroop has been studying the ways that life cycle stages and parasites again impact toxic bloom dynamics of dinoflagellates that are important in new england waters and the work of Alexis Fisher from reef Adela's group highlights toxic diatoms that are commonly a problem in waters off the west coast of the US I should note that in each of these cases ifc b can provide information to detect have events but it's also being used to better understand why and when they occur so improving our understanding of them and perhaps better mitigation strategies will emerge this kind of spread in the use of ifc b emphasizes in in important ways that the mb co time-series is no longer unique we've worked really hard to promote that my CP is now a licensed commercially available product with a growing user group around the world and we continue to invest in hardware improvements as well as software improvements including pushing the envelope for automated classification so that most recently we have deep machine learning models that scale well to over 100 classes 150 now with excellent class specific accuracy we're openly sharing our analysis approaches and code bases and I hope this will continue to stimulate more uses and new ideas so I know that there are some of you in the audience who share my passion for time series in ecology I I'm jealous of those of you with longer time series some of you have heard me talk before about my three biological children and then almost of the same breadth of these time series not really but you get my point so they're kind of digital offspring right they need to be cared for and listened to and then when you least expect it they totally amaze you even the saying it takes a village to raise a child applies here to there's Rob of course Alexi Taylor and Emily I just can't imagine more dedicated technical experts and then a growing parade of people who've really been critical to making this happen and making these data sing and I would be remiss to not mention the array of funding sources brought together whether they knew it or not their contributions have made something bigger than than one project so you know time series Rock right and some of you are like nodding with me and then I can just like feel the vibe some of you are like wanting to jump out of here see and shout hey you know it's a really big ocean out there and half an hour ago you were going on about all these spatial scales and how can you just sit there one spot in the ocean and pretend you're learning important stuff and I feel it and I'm I'm so thrilled to tell you that a new NSF supported long-term ecological research project means that we are not only able to continue the MVC oh time series we're also going to be continuing our show on the road strategy where we're setting up IFC be to sample and also a conventional flow cytometry but to automatically sample from underway seawater systems on research vessels we are focusing on a section cutting from MVC o across the shelf to the edge of the continental shelf where we are able to leverage the ooi pioneer array which is located on the edge of the shelf in this in this region and we are undertaking these surveys seasonally so we have winter spring summer fall in our first year but I just want to come back to focusing your attention on winter now and this these maps are showing the winter time distribution of Minardi adela catch allah first along the transect and then also we're sampling an even larger broad scale within this project by partnering with the National Marine fishery service on their surveys that support ecosystem based management in the region from North Carolina to Maine so this is now spatial maps of that same diatom species that I've been talking about being so important in the MVC Oh time series and we can now begin to see that yes that same species occurs at high levels in many areas throughout the region in winter and going forward I'm really excited that we'll be able to work to evaluate how well we can build on our knowledge from MVC o to scale up to understanding the dynamics of this and other species throughout the region so it's really great when we can extend our existing understanding like that but it's actually even more fun we're already finding some big surprises I mentioned a while ago that the the MBC Oh time series is greater than a billion images you may have noticed every time I've showed this time series that there are red points superimposed on the high-resolution blue time series from the automated analysis those points are validation of from the labor of love led by Emily peacock in my lab emily has inspected four point seven million images every two weeks she randomly chooses an hour of data and she and she annotates every image in that data we're now labeling about 50 types of diatoms that exist in the MV CEO time series and this important one when rd a delicate Ola makes up eighty one thousand one hundred and seventy four of the current annotations I highlighted that species in red there in the center because now I want to draw your attention to this the one right below it in this in this mosaic this is a genus Hemi Alice and for those of you who don't love phytoplankton it looks about like when our deer rides along diatom chain about the same size how many of those do you think we saw in those 4.7 million images that I mean with Emily has looked at just give me a number what do you think 42 oh my god give that guy a prize the answer is 37 37 okay like it's like a joke okay um not a diet time we were paying any attention to it all not important in this system okay that's what we thought then along comes the August 20 19 just a few months ago summer transect for the LCR project and boom these are just some of the images I didn't show them all here you wouldn't be able to see them in 13.9 milliliter so this much water chock-a-block with him--he Ollis the jackpot this is the concentration plot for him y'all us along the transect all those bright yellows they were everywhere except the inner shelf in the upper slope it was just chock-a-block with him yellows this bloom was widespread and really rocking lots of healthy cells evidence of cell division the species was really dominating in waters now when we look more closely at the images some of you who know him yellows will be expecting this it's hard to see in the healthy cells but when they're a little bit damaged we can see that the host diatom cells have these partners there are nitrogen fixing sign of bacterial symbionts that we can see in the images we have to add a new class to our training set then you build the classifier because there's something new and we now are presuming that this partnership has provided this bloom with a completely different nutrient source than the other diatoms that we typically see in this region this is a trick when RDA Delic actually can't play so these highly stratified very warm late summer surface waters maybe just the niche for this kind of Association this is a quick TS plot temperature salinity plot across all the transect cruises showing that this bloom we we encountered occurred in the warmest shelf waters we've sampled today so now we have new questions how often does this occur is it always in summer when the water is super warm what impact does this have on the rest of the ecosystem I want to make a quick shout-out here to samantha Sita many early career scientists participate in this LT TR project so far and Sam made a Herculean effort she volunteered within less than 24 hours notice to join us on this cruise because we had a late-breaking schedule change and then some people couldn't go and it was fantastic to have her along a training experience for the early career scientists but she was the one who knew what these symbols looked like and found them in the images and led us to be thinking about this in the middle of the cruise so kind of great and a partnership there and we love having those students have involved so we've really only scratched the surface of the stories that the MVC o time-series has to tell us and I've just highlighted what I think are a couple of exciting results from a few of the cruises our sampling of the region already looks like this each point here is an ICP sample containing hundreds even thousands of images and the different colored tracks are different cruises through the region multiple times per year since we started this partnership with Fisheries Service in 2013 and the beauty here is that this is just the beginning this kind of sampling is is sustainable and I really hope you'll stay tuned to see what the next decade uncovers as we dig into this huge data set over the coming decades I'm sure there will be more exciting advances in observing tools that we'll be watching for as well we're already hearing about some of them at this meeting in the meantime today is really exciting because we now have the tools that we need to meet the spatial and temporal scale challenge I laid out at the beginning while also providing an aspect of taxonomic resolution that was really previously only possible with manual analysis of discrete samples taken together this is already having societal impacts and it's accelerating the pace of discovery leading us to new understanding new models fueling new hypotheses about how ecosystems function but the links are to climate and so on I I wonder what Viktor Henson would how he would react he might have been kind of a curmudgeon but I hope he would have been amazed and excited at these new insights into his blood of the sea thank you [Applause] [Music] [Applause] anxiety all right you guys we can take some questions so the way we've worked this out there are three microphones creatively numbered 1 2 & 3 here in the center aisle if you would like to ask a question please make your way to one of those microphones and I will I can't see faces or badges so all I mean by number all right you are clearly a god in this field maybe I'm a goddess and you have shown a tremendous ability to perceive and resolve issues on the scale see you're talking about and I myself have Seneca caucus and diatoms and we look at them and we have one issue that you showed a picture of but did not address but I believe that you are the person to lay to rest the problem and that is our peeps are at 30 to 50 meters what do we do with deep elbow balls what do we do with them you mean besides study them Oh surely they're not right all these amazing phenomenon and nature and my have to have some it's all interconnected right and I'm sure they're important ecologically I didn't I didn't have a chance with the time available to show that we're also doing depth of resolved sampling on those LTR transect cruises and we're able to look through the seasons and through multiple years the differences between community structure and biomass of different species in the surface waters and in the deeper waters and that will definitely be problems we'll be exploring more and I'd love to talk to you about your your thoughts about what the right way to to go about that is also say I know there are more questions but I don't feel like a god or a goddess I feel like so blessed to be surrounded by smart motivated people who just sort of make it all happen and make it fun but there is studies about DNA and looking at the ecosystem from a different lens could you maybe say just a few words how I should understand your approach in the context of that so again I'll come back to the being blessed with being surrounded by smart students and early career scientists who are approaching just those strategies in the context of the kind of say image and cytometry based sampling that we've been pushing for so long so I worked with students who have already begun to explore that let's say the space of what you can learn what more you can learn what different things you can learn by bringing together cytometry imaging sequencing studies in the laboratory so I didn't have time to get into it but one example is Seneca caucus I talked about it as if they're all the same it turns out there are you know as many people in this room know there are many different sub genetic types of Seneca caucus and we know at the NBC OH time series from studies that some of my sister hunter severa has started that there's seasonally there are very distinctive shifts in the community structure within the Seneca caucus we can't see that with conventional flow cytometry but when we bring together sampling of the at the genetic level with the high resolution flow cytometry I hope we can take the next step in terms of understanding what parts of the dynamics are regulated by different sub physiologies and Seneca caucus that's just one example within the LTR project we have a whole component that's led by tatiana Rynearson that's focused on genetic characterization of across the plankton so we'll be bringing these things together it's going to be a great next decade ok what didn't work I mean gee so I'm sure some of you saw a few gaps in my time series right so like just one example early in the early days we were we were using syringes that we were terrified to deploy in our instruments in the winter time because the cold waters caused the seals to shrink and the syringes would start leaking inside the instruments and that's not good right so there was a challenge in the early days of developing these instruments to work with the manufacturer of the syringes come up with cold tolerant syringes we have to pay more for them but we also learned over the years which our deployments don't end due to fouling because our instruments keep themselves clean they also run their own internal standards so they thought monitor their own performance but they do end because eventually some mechanical part which just wears out after thousands of hours or going up and down or turning we started installing duplicate pumps so one of the pumps that would routinely fail we now have two so we can switch to the second pump during the same deployment and not have to end it the challenge is going forward oh there's so many there's so many strengths of this set of metric and imaging approaches that I talked about but they also have limitations it takes us many minutes to analyze a sample and get statistical information about the community structure the current depth rating of these flow cytometry 40 or 50 meters and you know the point about deep populations if we really want to get more in situ observations we need to push the envelope on getting the Saitama ters deeper we want to bring them together with other kinds of imaging strategies that let us look at both smaller and larger organisms in the community so an example in the LTR project we're now on the transect cruises using shadowgraph imaging to look at the zooplankton community of similar scales that we can characterize the phytoplankton community we won't always want the sensors to be smaller lower power easier to deploy there's a lot of work to be done bring it on engineers sorry long-winded you for that I'm not a biologist either bit like that so you showed the equation the beginning and you talked about the growth and death rates of the various classes have you've got enough information this moment out of that data set to actually estimate those growth and death rates as a function of all the other things from that data set to the government that's a pretty deep calculations so if I understand your question I think you're referring to the ways that the growth and death rates depend on other factors that drive them like temperature nutrients light something like that yeah so I showed some examples for specific groups of actual estimates that we're producing from the cytometry we've also in collaborations other estimated division rates for the larger organisms based on the image data so some of those vital rates were getting directly from deep this sort of deeper analysis of the cytometry not just cell counting so I I'm not sure if that's answering your question we can try one more time and then maybe we can okay yeah yeah so the challenge I think is that you know I'm at I presented results at the level of individual taxa because I think ecologically that's where we have to be focused in order to understand the underlying dynamics when we start aggregating everything and measuring you know sort of emergent growth rates of the whole population it becomes very difficult to understand because there's so many different facets that are contributing to those net results so the the challenge going forward in terms of I think what you're suggesting are models that we can use to pencast or forecast particularly to predict the responses to changing conditions for instance is going as you know many people in this room are working on this challenge of how much detail do those models need to represent in terms of say functional types or taxa is it sufficient to have you know small cells and large cells depending on your question maybe not because you know some of the large cells have nitrogen fixing buddies and some of them don't some of small cells are growing three times faster than the others and I don't pretend to have the answers about how we sort of thread that needle in terms of bringing together the level of biological detail I talked about today and you know global models of biogeochemical cycles where we're representing plankton functional types but that's another big area that the next decade is going to continue to an understanding of natural history will shape what we do with machine learning algorithms like is that what is that kind of where you're going [Music] yeah I'm you know I'm not sure I have an answer to your question I can just say that I mean I think that's really one of the most fertile and exciting grounds here I kind of like to think about these approaches that we're taking in some ways it's we start it's like Natural History on steroids right it's and we're exploring things about the natural history of organisms in new ways that I are going to uncover things that I think that the traditional you know just looking occasionally through a microscope kind of natural history makes very challenging again you know how we bring that forward to larger understanding of the ways that that level of detail can be let's all for lack of a better word I'll say parameterised to reflect our understand understanding of larger function of the system the sort of emergent characteristics like productivity or you know export to higher trophic levels like that's one of the grand challenges I think we're going to still continue to grapple with for some years we're fortunate to have a lot of smart students that thinking about things like that and I'm looking forward to hearing from them well please join me in thinking [Applause] [Music] [Applause] don't want to forget my old lady glasses here all right so now joining us is Erik van Sabeel Erik has worked in the US Australia and the UK before returning to the Netherlands now a physical oceanographer at Utrecht University Erik studies the pathways and time scales on which ocean currents transport water nutrients planktonic organisms and even pollution such as plastic in 2016 he received a European Research Council starting grant of 1.5 million euros it's a nice way to start it off to investigate how plastic moves in the ocean and he leads a team creating a 3d map of marine plastic pollution Eric has a passion for science communication he's done more than 300 interviews about plastic pollution and advised UK Parliament and the European Commission on the problems scale in 2019 Eric was eroded the Utrecht University public prize and recognition of his engagement of the public in his research Eric was admitted to the young Academy of the Royal Netherlands Academy of Arts and Sciences in 2018 joining a fellowship of top-level early career scientists were visionaries in science and science policy he was recently named a 2019 James B McIlwain medallist by aju an award given to early career scientists based on their depth of breadth of research impact and creativity as well as service outreach and diversity and he was also awarded the outstanding young scientist award from the European geosciences Union's ocean division so he's received these top honours from both the European and American Geophysical Union so please join me in welcoming Eric van Sabeel [Applause] [Music] [Applause] yes thank you okay I just need to turn this off well thank you Kristen for for that fantastic words thank you all for being here you're with so many this is awesome Wow okay this is the ocean this is the southern ocean as you see it and this is a spaghetti it's a spaghetti of virtual particles that have been moving around with the ocean flow and they've been going around in the Antarctic circumpolar current as you see there but on top of that on top of the general patterns that you see they have also been moving and much more fine scale patterns almost turbulence now it's these kind of patterns that is an ocean on the firm I'm interested in I'm interested to figure out why the ocean moves stuff around how the ocean moves stuff around and what that means to the global skill transport of heat nutrients plankton and plastic now this is going to be all about ocean models and about virtual oceans but of course as Heidi so eloquently said we really also need the observations so I think that here as a modeler I stand on the shoulder of all these observation lists that have ground truth everything I said and only because of that coming now are we in the age where we can actually do things with models that we trust enough to make predictions of how our ocean is going to be in the future but let's go back let's go back 20 30 years ago it was a time of the first global large-scale ocean circulation climate models and and it was a team in Europe with Christopher dos Sebring drive out bruno blanca sabrina spied bob mars many others and they started to inquisitors global 3d ocean models to figure out how what our parcels move around them because i wanted to trace out the conveyor belt circulation so this is a fantastic animation that was made in 1995 it's really gone long time I mean I ever saw in high school at this time when these people started to probe their ocean models to figure out how the ocean actually moves stuff around and this is one single particle that I put there the white dot just off the coast of Chile and as it moves around it first crosses the entire Pacific Ocean from West bit of wrecked reflection into the tropics and then very quickly already goes through the in an Asian through flow into the Indian Ocean circulating around the thousand Indian Ocean awhile then into the tropical Indian Ocean northern Indian Ocean back into the southern Indian Ocean again and then at some point getting into the southern ocean into the Antarctic circumpolar current and there does this loop and it loops around and around and around the color scale is the depth of this particle it doesn't have a color bar so I'm still don't know really what depths it is but there's some some information that do it very quickly goes through the South Atlantic and then into the North Atlantic where does one final loop of the subtropical gyre and the North Atlantic before finally reaching the UK coastline there now this is a 3-degree climate model this is really really old-school this is as diffusive as tarmac in some ways but still the lagrangian view of this is is elucidating it is telling us something about how the ocean moves all this water arounds right so even back in the days people really had a use for understanding ocean circulation not only in the what we call the ole Aryan framework we essentially look at one location and you see the flow passed by you bit like what was done in Martha's Vineyard so for observatory but here we're going with the flow we call that Lagrangian and I will come back throughout the rest of this talk now fast-forward 25 years and the type of simulations that we have now they're 1/12 of a degree so they're almost 50 times higher resolution than that previous one and this is a simulation that we did where we just put virtual particles just at the surface of the ocean it's not in 3d here on purpose we put them we fix them at the surface we started them everywhere uniformly in the ocean and then this goes something like this see that over time the tropics very quickly clear out the virtual particles move away from the tropics they also move away from the Southern Ocean and they move into these areas in the subtropical gyre those are called the whoa they are the scepter of God's iers and you may recognize that those are also the areas that are now sometimes called the garbage patches the accumulation zones of plastic and that's exactly why we did this experiment because we wanted to know how plastic accumulates at the surface of the ocean and why the amount of plastic on the surface of the ocean is not uniform over space now you see that there's these garbage patches that form at 30 north and 30 housewifely and it's not only in the model these garbage patches have actually been observed in real world too so this is a map from a paper by but carol affinor law and colleagues who went out with a ship and they told a plankton net behind the ship like in the photo here on the right and this plankton net after they trolled it for or a now or so they filled out the contents they removed all of the biological material and they ended up with plastic and then some poor and the graduate student had to count all these pieces of plastic and that is this map that you see here something like 4,000 or so of those samples is in this map you see the west coast of the US and Mexico there and blue means that there's almost no plastic floating on the surface of the ocean so fortunately most of the tropical Pacific Ocean is still rather devoid of plastic and so is the high latitudes but you also very clearly see there this bullseye area going up to reds and even purple more than 500,000 pieces of plastic per square kilometer now this is the Garbage Patch this is the accumulation area between Hawaii and California just of the coast of where we are right now that people sometimes have called the islands of plastic you don't want to know how often I've been asked whether I've ever stutes on the islands of plastic as if you can go there and plant a flag right it's nothing like that though and I can't blame people that they think that because very many of us would have mental images of these garbage patches to look something like this but this is not a garbage patch this is called a ghost net it's an abandoned fishing nets it's extremely detrimental it is very very bad for marine life because it constricts fish but this is even though it floats around in the ocean this is not consumer plastic this is not the reason why we take recyclable cups to the coffee place since these days this is not the reason why we stopped using straws there are no cups and straws in this figure so if you want to have a better feeling for what's the accumulation zone the Garbage Patch what it actually looks like in a real ocean then I think that this is better photo this comes from a paper by Charles Moore who went out into the Pacific accumulation zone between Hawaii and California and indeed he did this thing where he trolled a man that row for one nautical mile through the ocean empty debts removes all biological material and ended up with this a petri dish full of tiny pieces of plastic some of these pieces you can still recognize there's a bottle cap ring there quite clearly below that in pink is probably a piece of straw but most of the pieces of plastic are completely unrecognizable they're fragmented they're small we can't really know where what they are what we know the material but not the item that it used to be we have no idea of its origin we didn't know know where it comes from we don't even really know it's H of all these pieces of plastic the only thing that we can really do with this is counter and indeed if you count a number of pieces of plastic in this petri dish and you know that the trawl has been trawling through a mouth of ocean as a width of roughly 60 centimeters or so then come convert is to number of pieces per square kilometer and if you do that then in this case you indeed get to almost a million pieces of plastic per square kilometer and it sounds like a lot until you realize of course that there's a million square meters in a square kilometer so here in the middle of the Garbage Patch in the middle of the accumulation zone in the North Pacific this island of trash we're talking about one piece of plastic per square meter I would argue that this conference center is actually more polluted if we all go on our hands and feet here and look at the ground we will find more plastic here probably than in the middle of the Pacific Ocean now people sometimes call the plastic soup out there I'm really trying to get a new phrase in for it I think we should start calling it a plastic boo Yong because it is really like a very very thin mist tiny tiny pieces of plastic floating around in his enormous ocean so it's not only distro it's not only the four thousand or so that I showed on the map before a few years ago we teamed up with a group of international colleagues and we came up with a an inventory we found as many of those trawl samples as we could from across the literature and in total we found eleven thousand of those trawl data points as always in physical geography or an oceanography in general I guess it's the Pacific and the Atlantic that get all the love the rest of the ocean is fairly forgotten but we do have some data there and there are fortunately still people going out and measuring the other oceans that matter to now once we have this data we could combine it with models we could combine it with flow models and did some fancy regression and machine learning if you would bother I mean we didn't call that but essentially it is this and with that we came up with this this is the map of where the floating plastic floats at the surface of the ocean right now this is probably your best estimate of where all this small plastic I'm is small I mean anything that fits in a manta trawl where that is you see in blue very low concentrations fortunately still around Antarctica also fairly low concentration is around the equator where there's divergence so the flows away from it and high concentrations indeed in each of the five sir protocol gyres and especially in the North Pacific but you also see very high concentrations around Southeast Asia closer to the sources of a lot of this plastic and shockingly highest concentrations in the Mediterranean the number of pieces of plastic in the entire Mediterranean in his analysis is just as large as a number of pieces of plastic in the entire North Pacific there's an enormous large number of plastic there now when we have a map like this then it's fairly easy to just sum this all up to integrate it and to ask ourselves how much plastic is floating on the surface of the ocean right now when we did us we got to this number the total number is something like fifteen to fifty one trillion particles weighing 93 to 236 thousand metric tons and it's a shocking number especially last one to weight it is shocking because it is so extremely low well why is it low well let's do a bit of a budget analysis from this analysis and also from other published studies we know that there's not really much more than a few hundred thousands metric tons of plastic floating at the surface of your right now that's a plastic that we've mapped that we know roughly where it is but there's other estimates let's say that there's at least five million metric tons entering the ocean in a single year in 2010 alone so in that year twenty times more plastic entered the ocean then it's floating at the surface of the ocean right now and that's going on year after year after year after year I would say that really only 1% or selves all the plastic that is in the ocean we've actually mapped we know where it is at this moment 99% of our plastic is missing you know astronomers they talk about dark energy in the ocean we have dark plastic except for its not really dark and it's not like the astronomers who really have no idea where it is our problem is actually that every time we go in look for plastic we find it colleagues of mine you go to the ocean floor and sample the sediments and look for plastic typically find plastic in the sediment we now also well we recently sampled the the South Atlantic gyre at 3,000 meter depths we find pieces of plastic we all here in this room if we've ever gone to the beach and looked very carefully we will have seen plastic there's now more and more evidence there's actually plastic that is so small that it can't be captured by those Manta trolls we start calling that nano plastic these days and then there's the thing that should really worry your soul that's the plastic that is in biota fortunately we think it's not very much yet but this is of course a reason that we care about the plastic if the ocean was devoid of life if it was just a bathtub then would we all be making such a fuss about all this plastic in the ocean so we know when we've documented that there is plastic in each of those reservoirs the key point is that we have absolutely no idea how much is where there really is no one in the world that can tell you with any good fate whether there's more plastic on the ocean floor or more plastic in the coastlines we really have no idea these are big question marks and if we don't know where all this plastic is how can we ever start thinking about doing something against it about cleaning it up how can we clean up things where we have ninety nine of it is missing and more importantly if you don't know where the plastic is how can we ever measure its harm how can we ever measure where the plastic does harm to marine life again marine life is not uniform in the ocean plastic is not uniform in the ocean so really what we should want to know is where the overlap is between the plastic and a marine life and in order to do that we need censuses of marine life where organisms live but we also need maps of the three-dimensional distribution of all this plastic and that's exactly what I'm doing or what we are doing in this project and this coincidentally was figure number one in my grand proposal so I promise European Union that I would put numbers on those question marks yeah I get shocked through every time you see it but we're making good headway so what we're doing is we're we're we're developing these virtual simulations of plastic moving around in the ocean and what we do is just like the animations that I started with of particles moving around on the ocean and now we're doing it in 3d but this is not just as if particles the particles they beach they fragment they sink they ingest they get bio fouls all that is part of this three-dimensional simulation of virtually polluting the ocean essentially and then we're combining that with as many observations there's many measurements of plastic concentrations in all of those of the different reservoirs to essentially to train the model to make the model better and to make it as close to the observations as possible and once we've done that and hopefully we have some kind of idea of where all this plastic is so the plastic plastic in the ocean is an atrocity I think we should be ashamed as society that we've let it gone so far that our ocean is now full of plastic but there's an oceanographer I think there's also a silver lining to that plastic because the plastic is also an opportunity it's an opportunity to learn more about how the ocean works it's not opportunity to hone our our knowledge and to improve our knowledge of the interaction of flows and the the movement of stuff around the ocean plastic is a unique tracer there's different properties from any other tracer that we know it is different sources from any other tracer that we know and it is with that ID that we maybe can learn something off the ocean by looking at a plastic that we started to score a working group a few years ago and just yesterday a paper came out with a very long list of authors and many of here are in the room here where we make exactly that points the plastic is unique and a fantastic tracer to study the interaction of the very very small scale with a very very large scale in the ocean on one hand it is the desire circulation the gigantic thousand kilometer skill circulation but then on top of that is the very very small scale from individual waves and the mixing in Langner circulation and in wind rows and how all that combines and really hopefully we will have plastic in the ocean long enough but not much longer than we need to solve this question to solve the question of how scales interacts in our ocean as an example so this is a paper that that came out two years ago where where it was a fringe group and they took a ship into the North Atlantic subtropical gyre such as Matt that you see in the top left corner there and as they move the ship at each of those dots they trolled again for plastic with a man tetra which is a standards that's kind of the default measuring technique that we have now the key thing what they did there is that they they they measured and then combined it with the sea surface height from altimetry from satellites and what they found so blue is low sea sea sea level high so cyclonic Eddie's low-pressure areas red is high sea level height so anticyclonic Eddie's and the amount of plastic in the Nets varied by almost an order of magnitudes between nets or samples that we're taking at high sea level height compared to sur La Silla for Heights so even though all these were in the subtropical gyre row in the accumulation zone it was an order of magnitude different between the the different stations just depending on the sea level height now this is a NS one study and I was a co-author also on this I'm still surprised that they actually got through review right we had one cyclone one anticyclone and it was it if the review are here thank you very much for that but it does show the heterogeneity and it does show and it does point it does point a su away in which we can hopefully learn something more about how accumulation works at the surface in cyclones versus anticyclones I mean I think really we should be expanding this and I'm sure the people in the room here some of you are thinking about doing this now for all the cyclones and all the anticyclones in the world so let me take a step back then and and and make the points that it's this Lagrangian tracking stuff around the ocean is a very very powerful way of understanding ocean circulation it's not only the plastic but it's many many other applications and I'm at the moment writing an undergraduate textbook with Bob Marsh from from the University of Southampton there's gonna be my first textbook there's a first for everything right about the ocean a physical geography but really from this Lagrangian few points from the way of how ocean currents move stuff around how ocean currents move marine plastic how ocean currents move planktonic organisms or actually really non planktonic organisms to how they interconnect changes of nutrients how they transport heat into the tropics and and in other places how they control north atlantic water mass formation and how the water in the north atlantic and a convection how that that overturning circulation is it can also be fuse in a Lagrangian framework how ice transport is a lagrangian phenomena by itself it is the movement of stuff by the currents how River runoff is can be viewed Lagrangian interation transports so here for example between the Indian Ocean and the Atlantic Ocean and the connection between different ocean basins and finally really the global three-dimensional transport of the ocean how all of this can be viewed in a Lagrangian framework and I'm not saying that it should only be the Lagrangian framework but I think that this is a nice augmentation to the Alerian framework and it really when we start combining them that we can can can learn more from the ocean now this is one example that I wanted to highlight it was a bit hard to pick which example I want to highlight but I think that this one is quite nice because it shows a lot of features this was a paper that I did out of my my fellowship in Australia with quite a many in the room here the names are at the bottom there and we use a high resolution ocean simulation of the flows around Australia and and through the Indonesian passages to figure out well what controls how water moves from the Pacific Ocean into the Atlantic Ocean and what we did was in this high resolution simulation from the the gara Marin Institute's we put virtual particles like the particles that I started with that travelled the ocean but here we've color-coded them so the particles have started on the Northern Hemisphere and then and go through the Indonesia through flow we call them we made him read the particles that started on the southern hemisphere and go through the Indonesian through flow are blue and then finally the particles that go around the South the Tasman leakage are green and the key thing is we we started many many many particles on these different sections but we only selected those that actually ended up on the Indian Ocean and this is the idea of conditional pathways we can simulate bill about hundreds of millions of particles and only select those that actually follow a condition say they start in the Pacific Ocean they and in the Atlantic Ocean and for the green ones are the ones that only that go around the south of Australia now when we started the simulation you see indeed that they move all nicely through the Indonesian through flow they the green ones move around the south you see some of them are carried in Eddie's you see beautiful instability topical instability waves in the in the India tropical Indian Ocean for example and this is just a nice animation to look at but you can do things for example like look at the connectivity the connectivity in the individual passages over the Indonesians who flow so this is an example that shows in in is further up so in million cubic meters per second how water goes from each of the three straits at the top the Karen Mata stratum a caster straight and a Malacca strat and how then goes through the four straits at the bottom and this of course clearly shows how the different flows are connected we even that is in in in in ENSO in La Nina and El Nino conditions off that we compared so this is about the connectivity between upstream and downstream flow but these were 3d particles and we know in a model we know the temperature we know the salinity of the water so the other thing that we can do is probe what the different water masses are like upstream at 180 degrees east at the Dateline so here you see in temperature salinity space in rats all the particles that are north of the equator and go through the ITF or the blue hour south of the equator and go to ITF and the green is attachment leakage you see that's the the southern equatorial is just a little bit saltier than a northern hemisphere equatorial and then we can also do the downstream at 95 feast and see that they've mixed the blue and the red are not different and more they're completely overlapping so this shows that all of these connections in to flow all these different straits all this mix it really mixes the two water masses into one undistinguishable water mass but because we have the particle trajectories we can still identify that so this is from Fiske oceanography and this is what I was trained to do I'm a physical geography by oceanographer by training but I think that the real power of LaGrange in oceanography is when it applies to other fields when it applies for example to paleo oceanography so this is a I was once invited to workshop on paleo sonography and especially then about sedimentology so Bailey oceanographers looking at sediment cores and looking at the shells of form an affray in this case from nephrite there aren't so many I mean Heidi didn't even mention for many from the ocean but then but they're important because they have a shell that stays preserved in the sediments so we're looking at this shell and I'm particularly by looking at the isotopic signatures of whatever this shell is made up in the sediments Bailey oceanographers can say something about past climates past climates on skills of hundreds of thousands to even millions of years past the Bailey ocean or is only have one problem namely that if they drill work or somewhere in the deep ocean at four kilometres deep or so that they have to assume that whatever they found on the ocean floor is actually representative of that location but of course it's not true because there's Fuhrman ephra they are at the mercy of the currents their planktonic they move around and that is what we can do with Lagrangian oceanography we can track them back so in this simulation the black dot there that stays solid that's the location of the core and you're looking at the the tip of southern Africa here so just off Cape Town and all these dots are the individual virtual from nefra that end up on that exact location the coloring is the the temperature that I've seen until that this there there there well is their size their age essentially if Sina sometimes they come from really cold from the Southern Ocean they come up north sometimes they come from the Agulhas current and they're much warmer and all of this ends up in exactly the same location in the ocean so as a as a paleo shemagh refer you will need to take this into account you will need to take into account this lateral advection by the currents into everything that you find in your sediment core now we've dead we've done it for this location but we could also do it for the entire globe so this is the for every location on the entire globe the average drift distance in kilometers between the location where foraminifera ends up on the seafloor and the location where it was born still no biologic oceanographers ever called me out against a foreigner for being born so I keep saying that and then really Sherriff's the right word but what else um and you see that well in the subtropical gyre where things are kind of like slowly moving around those distances are 30 to maybe 100 kilometers or so but as you go to the southern ocean to the extensions of the westermani Current and especially to the tropics this can be more than a thousand kilometers those distances and it's more important it's not just the distance that they've traveled the the really important metric to paly oceanographer of course is whether the temperature recorded in the shell as that Foreman if removes the longest pathway how much different that is from the local temperature right above the location of the core on the ocean floor and that's this map the good news is in most of the ocean is pretty negligible less than half a degree or so but as soon as you go specially to the equator and the extensions of the western boundary currents which just happened to be the locations where Paley oceanographers are most interested in unfortunately those biases can be more than a degree right which is bigger than the error of the method the isotope method itself so this is something that needs to be taken into account and this is an also the point where my talk really nicely fits into heidi's before because of course if you take a sample in the ocean if you go out with a bucket of water or with a fancy flow site about the imaging flow site about and you measure what is happening right there then the water that you're measuring is not from actually that or what the waters from that location but the organisms that are there I've actually adapted up to a location upstream they've been washed down with the currents right so thinking about this intergenerationally yourself I'm skills and this work and this works especially for microbes that have a very quick turnover time that ever dividing time of a day or so if we assume that over five hundred generations or so they can adapt to new environments then that means that whatever you find somewhere in the ocean as actually being adapted to the last five hundred days of its trajectory you need to move this stuff back that's exactly what we did in a paper with Martina Dublin in PNAS a few years ago and we calculated what the difference is between the local temperature at any point and actually the temperature over a 500 day back trajectory and that's this in most of the ocean and especially near subtropical gyre is that is five six maybe seven degrees of difference so if you go out into the Gulf Stream and you measure something that is there the microbes that are there when they have adapted to temperatures that were probably seven degrees warmer than the local temperature that you find they're just because they are at the mercy of the currents so this is for passive organisms this is for organisms that just float and clumb do much about where they are but I would argue that even actively swimming organisms that organisms that can move around in an open ocean in the pelagic environment where there's not many cues of around exactly where you are even they are to some extent at the mercy of the currents and because they are I think that you can actually take that and and and use a Lagrangian framework also to model to simulate virtual fish the way that it works is essentially well you've got your ocean and you've got a flow on the ocean the ocean currents and the fish or the larvae or whatever you want is just moving with that current and on top of that it's swimming but if the ocean would be homogeneous if it would be the same in every direction then the swimming will just be Brownian motion around well there's no preferred direction anymore if it's isotropic the point of course is that the ocean is not isotropic that there are gradients whether it's temperature whether its food whether it's oxygen whether it's whatever you want it to be there's one place that is a better habitat and there's another place that there's a less good habitat and I don't really know how organisms and sends this gradient but they do and that means that instead of just random isotropic Brownian motion that these organisms tend to prefer going up to their better habitat but this is a process that is really easy to tackle into mathematical equations so we can actually simulate this in our model itself this goes back long years and a really nice example of this came out of the University of Miami they didn't do group of player Paris together with Ericka Ottoman and unit Helders where they simulated how reef fish larvae move from the dry tortugas there so as you're looking at the Florida Keys here how they gar swept along with the Gulf Stream passed all the all the Florida Keys and only very very few the blue dots only very few of them actually end up on the reefs in the keys but if you included just a little bit of swimming maybe 1 or 2 centimeters per second or so but nearly as much to overcome the entire go stream but just a little bit of swimming and directionality towards the reef then many more reef fish larvae actually ended up on the reefs so this was a very very efficient way it was shown for connectivity between the reefs to be established for the fish to actually end up on the reefs and to spawn new ecosystems there now this we can do for reef fish larvae we can also do it for tuna with a postdoc of mine Joe Scott Phillips we've actually made a full tuna model Lagrangian tuna model where they move around in the ocean so we do that and we did that and we could make this tuna model because we've got a new a new framework a new coat that really allows rapid development of Lagrangian models lagrangian tools it's called Parcells it sounds for probably a really computationally efficient Lagrangian simulator the probably I still need to stress a lot but we're getting there is getting a more efficient and it's not just a model it's it's more framework it's a set of Python classes a method for building your own Lagrangian particle model if you ever wanted to simulate the movement of whatever it is of your favorite organism of your favorite water mass you can quite easily do that in in parcels in the way it works is that it's kernel driven so kernel is a particular action on a particle a particle can be affected by the currents it can diffuse due to random motion and on top of that it can do things it can sink particles can swim particles can be fragmented in terms of say the plastic and all of these Rhian code in a kernel you can ride them yourselves they're typically a few lines of code and then concatenate them and then you put that into the into the framework and it just runs and it creates this particle trajectory for you so that's all their own ocean parcels of ork we're actively developing this we have on github 98 stars and I thought well if there's 3000 people in this room I'm sure that we can get above 100 after after it is after a lunch time yeah and this is really still active development for five years or five years already and we're doing that because we need a computationally efficient Lagrangian simulator the title is really what it says we need this because we as oceanographers especially as numerical oceanographers computational geographers we're going into an age of extremely big data the beta skill age of data just to give you a bit of a feeling for where we're heading remember the very first animation I started out with the particle moving around the lonely particle throughout all of the oceans right from the 1990s that was on a three degree horizontal resolution you need probably 30 day temporal resolution and if you want a 50 year simulation of that and you want to store that on a computer drive it's a few gigabytes of data or so then let's you up the horizontal resolution at some point you also need to up the temporal the temporal regular resolution because the eddies are going to be more energetic and more very so you need to save the data more often we're now at the stage where we have regular one tenth of degree or so simulations five-day resolution typical simulations for 50 years of data is a few and a few tens of terabytes but people are already planning simulations at 50 years and even at a hundreds degree global simulation and if you still 150 year of data and that's important because only on 50 year can we really understand connectivity on a global scale if you still want that then we get to petabytes simulation so very very soon we assertion our oceanographic community we will need to start thinking about how to deal with the petabyte age how do we make sure how our tools and infrastructure are ready for this well fortunately there's a group of very very smart people thinking and worrying about this for you so that you don't have to do it or with you if you want to think with this it's called Pangea project it's a community that really is very active in making sure that we are ready for this petascale age that we have the tools to deal with this so that's the how do we do it in terms of just the codes in the computation but I think there's another thing how do we make sure that whatever we're going to do on these models that it is shareable and that is reproducible and that I think is a much harder problem how do we make sure that whatever we do is reproduce Balazs verifiable is a kind that we are accountable essentially for what we're doing and for that I think we need a radical rethink I think we need to go towards a radically open science so many of you hopefully already practice open science and open science for most of us starts with open science of analysis that is sharing code that is sharing data sharing notebooks it's maybe even pre-registration probably some of you are already also doing open writing on platforms like overleaf for example and creating notebooks about to to to open up the way you do your analysis the many of you of course have heard of open access so open publication but there's not only open access it's also open peer review and sharing preprints to make sure that we are open in that then there's outreach so the communication via social media that we're doing sharing the posters this conference is also supporting that where we really share whatever we're doing and there's open assessments about alternative evaluations things like altmetric and these kind of things so that hopefully most of you are doing already but I think we can there's also on the other side there's something that we can do more there's the open search where we share and we comment on each other's papers openly where we share each other's library and then there's a last step and this is the most scary one this is the one that I am not even really yet ready to do I think we all do it but it is scary to actually do it and that's the open proposals you know in an ideal world if I write a proposal and I submit it and it doesn't get funded because apparently I am NOT the right person to do it then shouldn't I just make that proposal open and hope that somebody else actually takes it up and does it shouldn't there be somebody probably there is somebody better out there one of you can do the things better than I can right so why should a proposal be mine why should I be I have so much ownership and feel so much ownership of my own proposals right aren't we all here in the same game aren't we all doing science because we want to advance science is in science far too egocentric so I would love the day where it is completely normal to share our proposals to work together on our proposals to be completely open by that and not having to worry about our own careers so that is a radically open science where we plan our research through co-creation where we conduct a research through transparency include inclusivity where we communicate with peers in the public and importantly where we get recognized and rewarded in an unbiased way and that last thing that's the trickiest because that's not in our hands that's in the hands of our university administrators it's in the hand of our funders they need to make a change into how we get recognized and rewarded for what we do as academics and I'm really really happy that at least in the Netherlands there's now very strong push for changing this it's good room for everyone's talents and it is really about how to keep saying and healthy in academia because there's far too much over over over effort there's far too much stress among each other there's far too much burnout in our community we need to do something about that and the way that in Ellen's we're thinking about this is that we are actually we have four pillars education research impacts and leadership and the idea is you don't have to be excellent in all nobody's excellent in everything we are not training sheep with five legs so everyone can pick some things that they are better in and some things that are worse in or less good in right and we need to tell that story together then on top of that we need to think more in teams so we need to really achieve a balance between the individual and academic assessment shouldn't be about individual persons it should be about the teams that they're part of like any normal company would do it shouldn't be about numbers so much we are far far far too focused on things like impact factors age scores citation metrics all the things that we can measure if we can measure it we think that it is appropriate and then it's correct but there are enormous biases in these measurements so we need to go to a system where it's much more about the narrative of our research but why we do the research that we do and why we think it is important that we're doing that's the way that we should start thinking about the rewarding and the recognition and finally we really need to for everyone and on every single level think about stimulating academic leadership this is not something for the big professors for the dinosaurs everyone should take leadership it should stand up after that little rent and I hope you're okay with that let's go back to physical oceanography the ocean is no bathtub it's in constant motion and full of small-scale Eddie's which have a crucial role in the transport of heat nutrients plastic and plankton I've shown you that most of the plastic in the ocean is missing and that mapping this plastic is an exciting challenge for oceanographers because plastic is unique tracer and I've talked about Lagrangian ocean and Anderson general as a way to really understand ocean connectivity and conditional pathways and how everything in the ocean is connected because in the end we only have one ocean but to cope with all this we need to reward radically open science thank you very much and thank you to the team thank sir okay we have time for a couple of questions before y'all head out to lunch so again we're still we got our one twos and threes up here and I'd particularly like to encourage students early career anybody thanks for an amazing talk interdisciplinary and while it's very clear that we need to learn more about the transport of plastic in the ocean we also know a lot about the inflow of plastic and so in the meantime we need to work on shutting off the tap so as somebody who has clearly thought a lot about this if you could choose one sort of change or one legislation or one shift in society that would have the greatest reduction in our outflow of plastic to the ocean yeah what would that be and why yeah good question so now I'm really stepping beyond my remedy as an official version of core of course but I talk to they're two too many plastic people a lot I think in the end so we have plastic in the ocean because our waste management system is broken it's this clear is that right there's bad waste management and therefore plastic and sup nobody goes out there and tries to put plastic in the ocean just for the fun of it so why is our waste management system broken well there's many many reasons of that but if you think about what is the easiest way to fix it I think start with product design I think that I hope there are not too many people who are product designers in his audience but a lot of the blame is on their shoulders right why does every single soft drink bottle need to be different why does it have to be a different color why does it have to be non recyclable why why does some plastic need to be black most of the recycling that we do is done on infrared on spectral information black plastic doesn't reflect so we can't actually recycle it through automated processes and still fancy things are packaged in black plastic so that will be the place to start I think legislation wise easier plastic okay great we're gonna go to Mike - for the next question alright well thank you for that talk and I really appreciated your focus on open science at the end I have a few technical questions about your Lagrangian particle tracking so first of all how do you interpolate velocities within the model and then how do you validate the model tracks if you yeah good questions both so the interpolation we can choose we have different interpolation schemes my postdoc Philippe the lawn mater wrote a very complicated paper in GMD about exactly how we do the interpolation it depends a bit also on the great weather it's a great be great secrets and even here I've already had many talks with many people who say that our inspirations are still wrong so open question I don't know in terms of the validation while the gold standard is still buoyed trajectories for the surface at least drifting buoys Stokes drifters had really sit on the surface of the ocean we're doing more and more of these in 3d that is difficult it's difficult to really validate these but in the end I think the the bigger errors from the ocean hydrodynamic model then from the actual particle trajectories I mean in the end it's just an RK for integration right interpolation and multiplication it's not much more than that all right well thank you yeah hi I'm Peter kelmer's from JPL thanks for the talk and thanks for the rant the radically open science I think it's good to step outside of our discipline sometimes and think about how we organize so this is kind of a question or comment on that which is I think we probably the majority of us in this room would agree that the planet is somewhat in peril right now and you know how can we also change assessment and the reward structure to encourage more scientists to kind of raise that alarm and get the public to kind of support seize that we all know that we need to start slowing this down and then fixing well that is exactly my point thank you for for for raising this so well I think that in our old reward and and recognition structure where it's just about impact factors just about H scores it doesn't actually recognize if we do something meaningful if we if we put our efforts into actually changing this earth and this this planet that we live on so I think that exactly for that reason we need to just change the system and reward impacts more ask people at their annual performance review not how many papers they've published but what their papers have meant to policymakers to change makers to stakeholders those are the important questions to ask ok last question Eric a great talk as always so I thought one of the goalposts or something like we could do together in the next 10 years that also this vertical open science could enable is I think you had the beginnings of what I'm calling a digital twin ocean it's sort of the digital analog of the real ocean and I think it has all the elements that you showed us because if you can track what moves through that digital ocean you can learn something about it if you can image what's there was flow cytometry in other ways we can explore the ocean but are we not really working to that one big goal to try to take our real environment into the digital space so we can dial it back and for some time we can zoom in in space and we can also dial in issues like where's the plastic where the fish something that inspires you that's exactly the point this digital ocean and we've talked about this D before Martin and there was a fantastic tutorial yesterday that I attended about a package called spy ocean that comes out of the pen geo stack that does exactly that it is it is a ocean-going software without actually having to go into the ocean you can put your moorings into a virtual ocean and this digital twin that we can manipulate that you can test high post that we can investigate further it's antacid that is what we need to build and the Pangea people are certainly building that but they need help they need more people in it especially they need more money great thank you please join me in thanking our speakers alright I hope you guys have a good afternoon and I hope to see you at the jam session tonight and the fun run walk tomorrow morning extra bragging rights to those of you who do both have a good meeting [Music] [Music] you [Music]
Up Next

52:41
Microplastics in Aquatic Ecosystems: Sources, Impacts & Research
@4ISTC
1.7K views•2017-03-22

12:54
Triumph of Orthodoxy Icon: Byzantine Art & History Explained
@BenCallan
2.1K views•2024-08-06

9:49
FastAPI vs Flask vs Django: Choosing the Right Python Web Framework
@TechWithTim
302.5K views•2024-05-26

1:42
Game of Thrones Opening Credits: A Cinematic Analysis
@gameofthrones
46.3M views•2011-04-18
Related Study Plans & Knowledge Roadmaps
Structured learning paths in General & Interdisciplinary Studies
general-studies
Elevator Engineering: History, Physics & Cities
01From Hoists to Safety Brakes: The Dawn of Vertical Lift
02Hydraulic vs. Traction: The Engineering Physics of Elevators
03Modern Speed, Safety, and Algorithms
+ 2 more learning modules
12h5 modules
Explore Roadmap
general-studies
Rubber: Material Science, History & Geopolitics
01Origins of Natural Rubber & Mesoamerican History
02The Chemistry of Natural Rubber & Vulcanization
03The Geopolitics of the Rubber Boom & Colonization
+ 2 more learning modules
12h5 modules
Explore Roadmap
general-studies
Containerization: Evolution, Logistics & Trade
01Ancient Trade & Bulk Cargo: Amphorae to Barrels
02The Industrial Revolution & Cardboard Packaging
03The Containerization Revolution: Malcom McLean
+ 2 more learning modules
12h5 modules
Explore Roadmap
general-studies
Textile Tech: Evolution, Labor & Global Impact
01Pre-Industrial Textiles: Handloom & Cottage Industry
02Mechanization: The Spinning Jenny to the Power Loom
03The Factory System & Global Labor Transformation
+ 2 more learning modules
10h5 modules
Explore Roadmap