









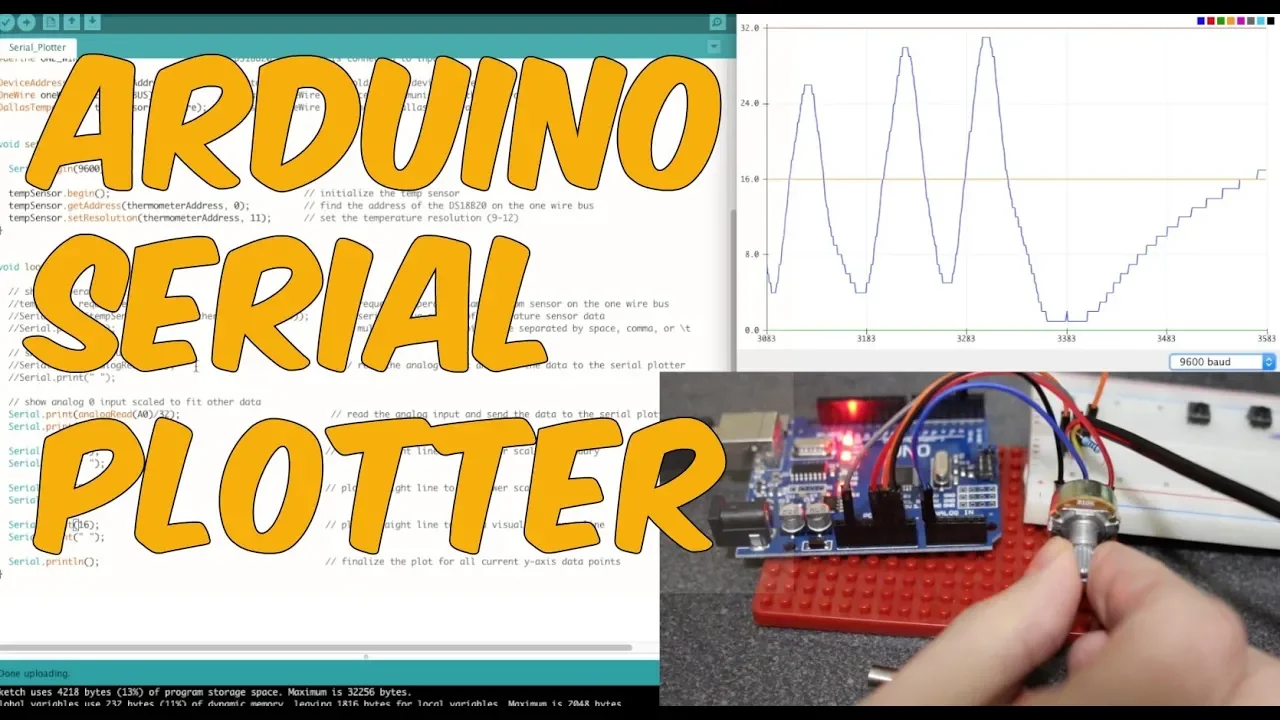

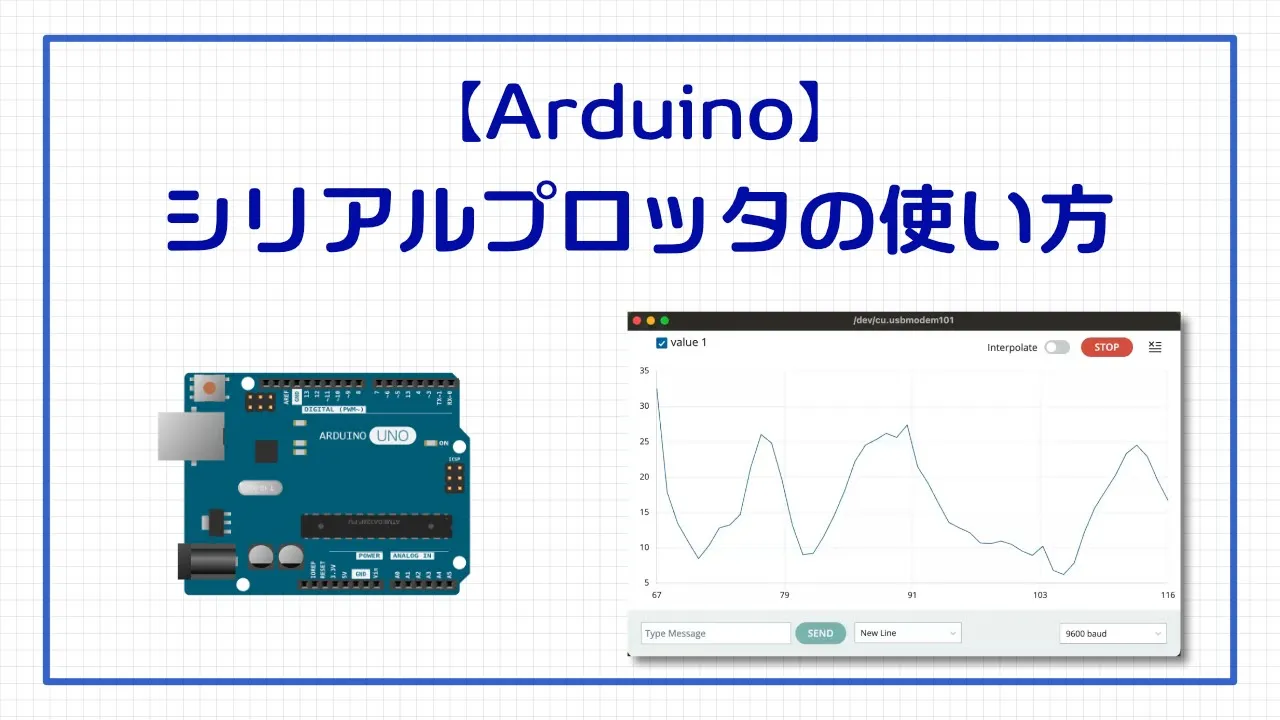








The Arduino Serial Plotter is a graphical visualization tool introduced in Arduino IDE version 1.6.6 that displays numeric data from serial output as a scrolling graph with 500 data points, automatically adjusting the Y-axis to fit the current data range, and can be used for visualizing waveforms, monitoring digital inputs, and rough code profiling.
Arduino Serial Plotter: A Visual Guide to Data Graphing
Added:Basic Arduino programming fundamentals, including the structure of a sketch (setup and loop functions) and variable types.
Concepts of serial communication, specifically how the Arduino transmits data to a computer using Serial.print() and Serial.println() functions.
Understanding how to interface analog and digital sensors with Arduino and read their values (e.g., using analogRead()).
A basic grasp of electronic signals, such as voltage variation, and how physical phenomena (like temperature or light) map to numerical data.
Formatting serial output to plot multiple data streams simultaneously on a single graph (using delimiters like commas or spaces).
Exporting real-time serial data to external programs (like Excel, MATLAB, or Python) for advanced data logging, storage, and statistical analysis.
Implementing software-based digital signal filtering techniques (such as moving average filters) to smooth out noisy sensor data on the plotter.
Building custom graphical user interfaces (GUIs) for data visualization using platforms like Processing, Node-RED, or Python's Matplotlib.
102.2K views427likes6:55Original Release: 2015-11-04
hello and welcome back to my channel as you may have heard uino have just released their 1.6.6 version of the IDE and with it several new tools and improvements including serial plotter shown here which is a graphical companion for the regular uh serial monitor which we already know what this thing does is it looks at the serial output from the uino and tries to to find numbers which are uh human readable if you can read it off the serial monitor say is a number within its own line be it a negative number or decimal point or whatever then this can read it too and it will put it as a data point here on this graph uh this has the capacity for 500 points and uh when new numbers arrives as you see the graph Scrolls and you can't go back and even if you stretch it it's always 500 points just visually changes but uh the data stays the same and the y- AIS is adjusted automatically to the range of values that are currently um available within those 500 points and we'll see how this affects U the results later you can also the only thing actually that you can select here is the um B rate just as you would in the serial monitor the program that is running here right now is this it's a sawo generator very very uh simple it takes a bite which is zero at the beginning it sets the serial object for uh 9,600 B and um print lens uh b++ so it goes up to 255 which is the top value for a bite and goes back to zero so you can also see that the dots are connected in this graph this is Sawtooth now let's have a more um visually pleasing sine wave a copy paste from uh from the side here this is a uh not very efficient but it will do the the job of creating a time wave and notice that as I uh as I run this you'll see the um the plot uh the y- axis of the plot adjusts at real time whenever I um open the serial monitor there see whenever I open the serial plotter I'm sorry um they are doing resets just like in the serial monitor so here's our sun wave now you'll so notice that the line is continuous if you want it to be more visually pleasing you can do a little trick and add a um a Return To Zero after each uh after each data point print line again because this uh this uh only needs the number to be human readable you can print it as text it doesn't matter as long as it's uh it finally eventually appears as a number so let's run this one and see what we get there you have the sound wve almost filled now because um the additional number stretches the the wave two times its original size um the range of values changes uh within within a cycle so the y- axis jumps up and down as you can see here if you want to avoid this you'll have to change the um the wave here I'll just double it so it's double the frequency see and then the um the 500 data points will contain the entire the entire cycle so it won't Jump Around let's see this just at the beginning and then it's very stable a nice sine wave now let's have another example uh in this example I'm uh I'm using the uh serial plotter to to display um the input on uh on pin two upd do you know it defines as input pull up pull up and I show it as a negative logic one minus digital read which is actually zero or one so it will show me because it's on a loop it will show me on the time axis the value on the on the pin actually I'm not using even I'm not even using a real uh button here just um short the pin2 to ground on and off here like that on and off the problem is get short as short as I can the problem is that if I leave it um a single value too long you see the the y- axis Auto adjusts again to whatever value it feels like and that can be a bit a little confusing so you have to watch out for that now another um uh potential use for this serial plotter is for some sort of U primitive code profiling here's a little program that I wrote it has three functions my fun one two and three each one um print lenss its own number as a sort of an indication to to it being run and in the main loop I uh as a function of a random uh value I either run my fun 3 which is which should be the rarest just uh one out of out of 20 occurrences my fun 2 will run uh two times for each 20 in average and the default is my funk one I also add a delay so it won't Brown out of sight too fast let's compile it and see what we get and here you can see value is jumping around so you'll see um the value one two and three so you see that um function one runs uh the most function two much less and function three is the rarest now keep in mind this is not a Time axis so you can't do a real profiling and see really what functions take the most uh processing time or uh resources but this can be a rough can help you as a rough estimate to to see if you even get into some function or uh which ones run to what order so this is the serial plotter very nice tool and um if you find uh some new uses for it or uh want to read more uh use the comments below I'll put a link to the blog post that I wrote in English and in Hebrew about this um about this uh new tool thank you for watching I'll see you next time
Up Next

17:10
Rust Option and Result: 10 Common Patterns in Practice
@codetothemoon
158.7K views•2022-10-22

87:26
Introduction to Secure Multiparty Computation with Yehuda Lindell
@fhe_org
7.7K views•2021-02-04

4:55
HTTP Requests Explained: GET, POST, PUT, DELETE
@codecademy
103.1K views•2021-10-07

19:25
Enigma Machine Mechanics: WWII Encryption Explained
@JaredOwen
13.2M views•2021-12-11
Related Study Plans & Knowledge Roadmaps
Structured learning paths in Computer Science
computer-science
Container Runtimes: Namespaces, Cgroups & Go
01Linux Systems & Go Programming Foundations
02The Core of Isolation: Chroot and Filesystems
03Linux Namespaces: Process Isolation
+ 3 more learning modules
32h6 modules
Explore Roadmap
computer-science
Building a CHIP-8 Emulator: Rust & CPU Basics
01Computer Architecture Foundations (Bits & Bytes)
02Rust Programming for Systems Development
03CHIP-8 Virtual Hardware Specifications
+ 2 more learning modules
32h5 modules
Explore Roadmap
computer-science
Building BitTorrent: Go, P2P & Concurrency
01Go Fundamentals & Concurrency
02Networking Foundations & P2P Architecture
03Bencode Parsing & Torrent Metadata
+ 3 more learning modules
26h6 modules
Explore Roadmap
computer-science
Actor Models (C++ Concurrency & Lock-Free)
01C++ Multi-Threading Foundations
02Thread Pools and Task Scheduling
03Atomics and Lock-Free Queue Design
+ 3 more learning modules
45h6 modules
Explore Roadmap