





















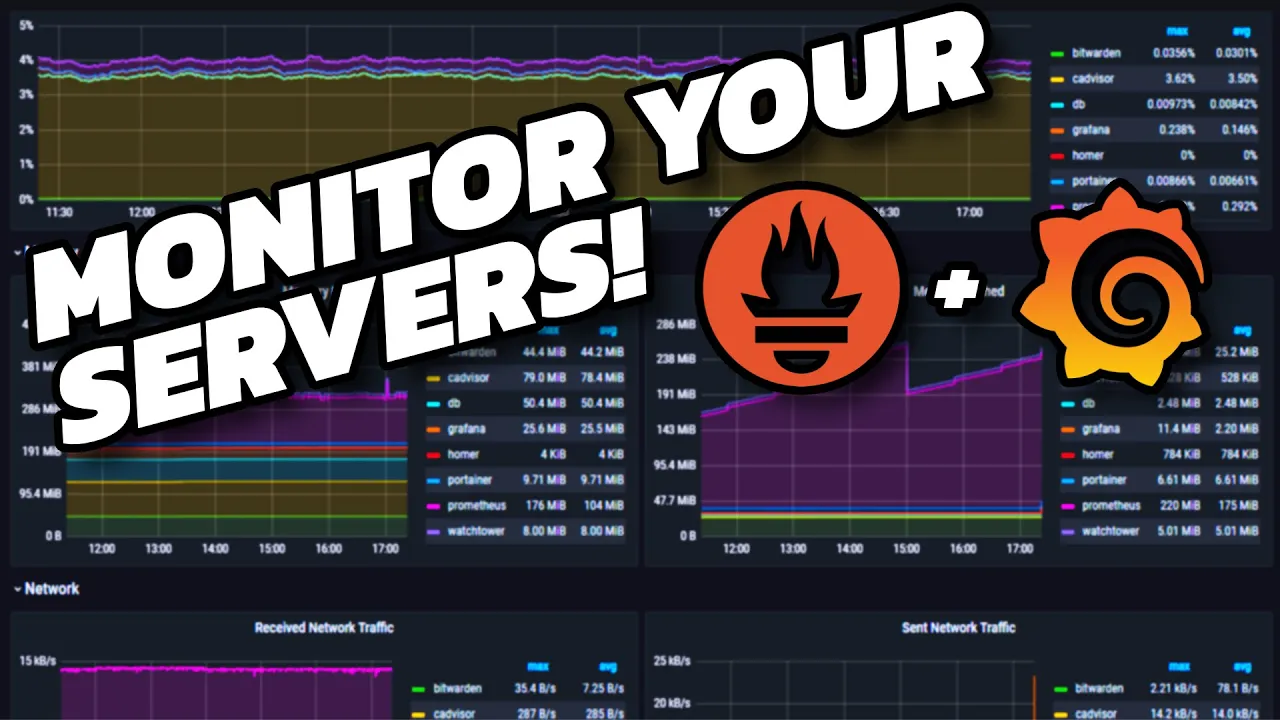












Prometheus is a pull-based monitoring system designed for containerized environments like Kubernetes, consisting of a Prometheus Server (with time series database, data retrieval worker, and web API), targets (servers, services, or applications being monitored), and metrics (time-series data points like CPU usage, memory, or request counts); it collects metrics by scraping HTTP endpoints at /metrics, using exporters for non-native services, and employs a declarative YAML configuration file for defining scrape targets, alert rules, and evaluation intervals, with Alertmanager handling alert notifications and PromQL enabling powerful querying of collected metrics.
Prometheus Monitoring Architecture: A Technical Guide
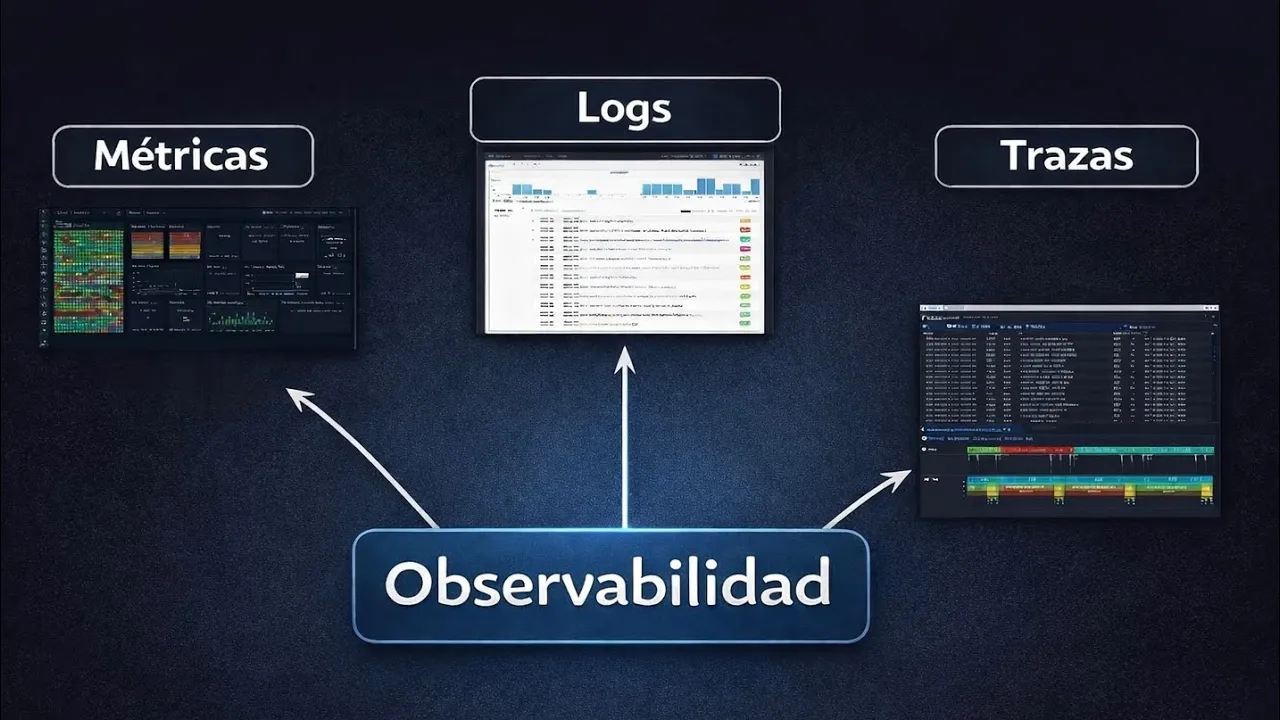
Added:Basic understanding of system monitoring concepts, specifically the difference between metrics, logs, and traces.
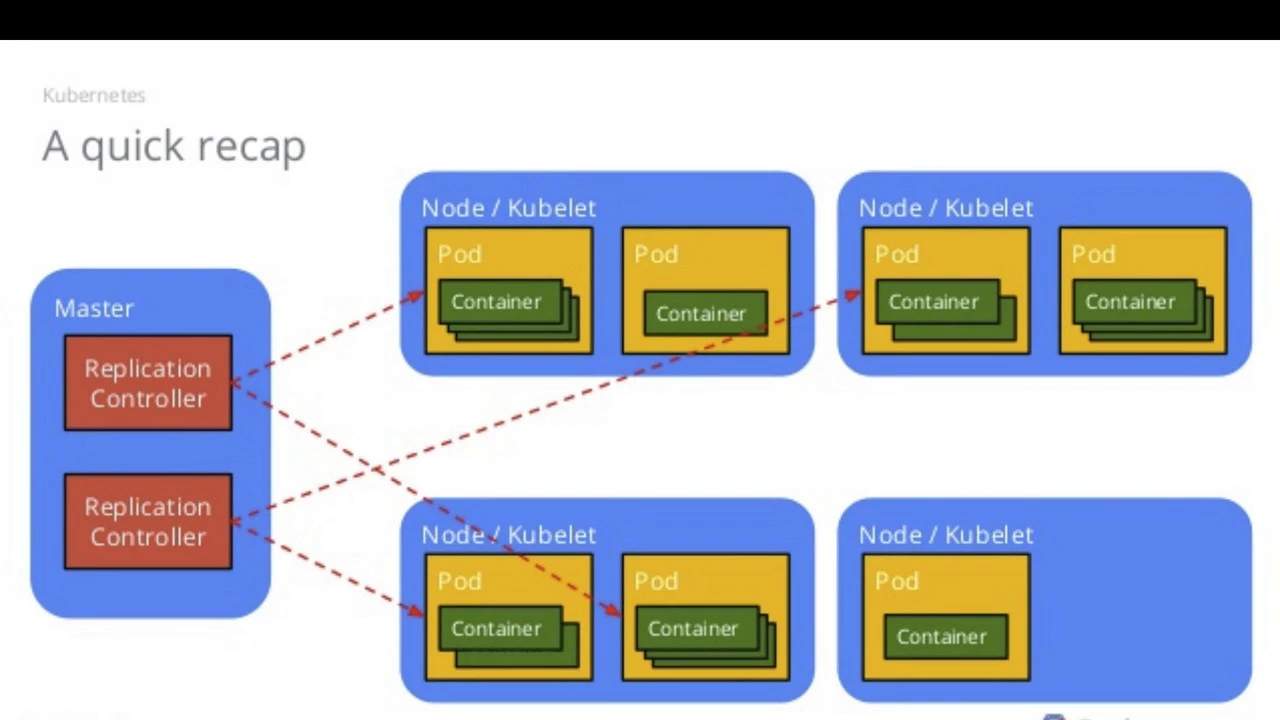
Familiarity with containerization and orchestration concepts, particularly Docker and Kubernetes, in dynamic environments.
Fundamental knowledge of client-server architecture and how HTTP-based pull/push mechanisms function.
An understanding of time-series data structures, where data points are indexed and measured over time.
Mastery of PromQL (Prometheus Query Language) to write complex queries, aggregate metric data, and build custom charts.
Integrating Prometheus with visualization suites, primarily Grafana, to design operational dashboards.
Configuring Alertmanager to handle alerts, group notifications, and silence or route them to external services like Slack or PagerDuty.
Scaling Prometheus for enterprise-grade deployments using Thanos, Cortex, or Prometheus Federation for high availability and long-term storage.
Instrumenting custom applications with Prometheus client libraries in languages like Go, Python, or Java to expose custom business metrics.
1.2M views21.7Klikes21:30Original Release: 2020-04-24
in this video we're going to talk about prometheus so first i'm going to explain to you what prometheus is and what are different use cases where prometheus is used and why is it such an important tool in modern infrastructure we're going to go through prometheus architecture so different components that it contains we're going to see an example configuration and also some of these key characteristics why it became so widely accepted and popular especially in containerized environments prometheus was created to monitor highly dynamic container environments like kubernetes docker swarm etc however it can also be used in a traditional non-container infrastructure where you have just bare servers with applications deployed directly on it so over the past years prometheus has become the mainstream monitoring tool of choice in container and micro service world so let's see why prometheus is so important in such infrastructure and what are some of its use cases modern devops is becoming more and more complex to handle manually and therefore needs more automation so typically you have multiple servers that run containerized applications and there are hundreds of different processes running on that infrastructure and things are interconnected so maintaining such setup to run smoothly and without application down times is very challenging imagine having such a complex infrastructure with loads of servers distributed over many locations and you have no insight of what is happening on hardware level or on application level like errors response latency hardware down or overloaded maybe running out of resources etc in such complex infrastructure there are more things that can go wrong when you have tons of services and applications deployed any one of them can crash and cause failure of other services and only have so many moving pieces and suddenly application becomes unavailable to users you must quickly identify what exactly out of this hundred different things went wrong and that could be difficult and time-consuming when debugging the system manually so let's take a specific example say one specific server ran out of memory and kicked off a running container that was responsible for providing database sync between two database pods in a kubernetes cluster that in turn caused those two database parts to fail that database was used by an authentication service that also stopped working because the database became unavailable and then application that depended on that authentication service couldn't authenticate users in the ui anymore but from a user perspective all you see is error in the ui can't login so how do you know what actually went wrong when you don't have any insight of what's going on inside the cluster you don't see that red line of the chain of events as displayed here you just see the error so now you start working backwards from there to find the cause and fix it so you check is the application back and running does it show an exception is the authentication service running did it crash why did it crash in all the way to the initial container failure but what will make this searching the problem process more efficient would be to have a tool that constantly monitors whether services are running and alerts the maintainers as soon as one service crashes so you know exactly what happened or even better it identifies problems before they even occur and alerts the system administrators responsible for that infrastructure to prevent that issue so for example in this case it would check regularly the status of memory usage on each server and when on one of the servers it spikes over for example 70 percent for over an hour or keeps increasing notify about the risk that the memory on that server might soon run out or let's consider another scenario where suddenly you stop seeing logs for your application because elasticsearch doesn't accept any new logs because the server ran out of disk space or elasticsearch reached the storage limit that was allocated for it again the monitoring tool would check continuously the storage space and compare with the elastic search consumption of space of storage and it will see the risk and notify maintainers of the possible storage issue and you can tell the monitoring tool what that critical point is when the alert should be triggered for example if you have a very important application that absolutely can have any log data loss you may be very strict and want to take measures as soon as 50 or 60 percent capacity is reached or maybe you know adding more storage space will take long because it's a bureaucratic process in your organization where you need approval of some it department and several other people then maybe you also want to be notified earlier about the possible storage issue so that you have more time to fix it or a third scenario where application suddenly becomes too slow because one service breaks down and starts sending hundreds of error messages in a loop across the network that creates high network traffic and slows down other services too having a tool that detects such spikes in network load plus tells you which service is responsible for causing it can give you timely alert to fix the issue and such automated monitoring and alerting is exactly what prometheus offers as a part of a modern devops workflow so how does prometheus actually work or how does it architecture actually looks like at its core prometheus has the main component called prometheus server that does the actual monitoring work and is made up of three parts it has a time series database that stores all the metrics data like current cpu usage or number of exceptions in an application second it has a data retrieval worker that is responsible for getting or pulling those metrics from applications services servers and other target resources and storing them or pushing them into that database and third it has a web server or server api that accepts queries for that stored data and that web server component or the server api is used to display the data in a dashboard or ui either through prometheus dashboard or some other data visualization tool like grafana so the prometheus server monitors a particular thing and that thing could be anything it could be an entire linux server or windows server it could be a standalone apache server a single application or service like a database and those things that prometheus monitors are called targets and each target has units of monitoring for linux server target it could be a current cpu status its memory usage disk space usage etc for an application for example it could be number of exceptions number of requests or request duration and that unit that you would like to monitor for a specific target is called a metric and metrics are what gets saved into prometheus database component prometheus defines human readable text-based format for this metrics metrics entries or data has type and help attributes to increase its readability so help is basically a description that just describe what the metrics is about and type is one of three metrics types for metrics about how many times something happened like number of exceptions that application had or number of requests it has received there is a counter type metric that can go both up and down is represented by a gauche example what is the current value of cpu usage now or what is the current capacity of disk space now or what is the number of concurrent requests at that given moment and for tracking how long something took or how big for example the size of a request was there is a histogram type so now the interesting question is how does prometheus actually collect those metrics from the targets prometheus pulls metrics data from the targets from an http endpoint which by default is host address slash metrics and for that to work one targets must expose that slash metrics endpoint and two data available at slash matrix endpoint must be in the format that prometheus understands and we saw that example metrics before some servers are already exposing prometheus endpoints so you don't need extra work to gather metrics from them but many services don't have native prometheus endpoints so extra component is required to do that and this component is exporter so exporter is basically a script or service that fetches metrics from your target and converts them in format prometheus understands and exposes this converted data at its own slash metrics endpoint where prometheus can scrape them and prometheus has a list of exporters for different services like mysql elasticsearch linux server build tools cloud platforms and so on i will put the link to prometheus official documentation and export the list as well as its repository in the description so for example if you want to monitor a linux server you can download a node exporter tar file from prometheus repository you can untar and execute it and it will start converting the metrics of the server and making them scrapable at its own slash matrix endpoint and then you can go and configure prometheus to scrape that endpoint and these exporters are also available as docker images so for example if you want to monitor your mysql container in kubernetes cluster you can deploy a sidecar container of mysql exporter that will run inside the pod with mysql container connect to it and start translating mysql metrics for prometheus and making them available at its own slash metrics endpoint and again once you add mysql exporter endpoint to prometheus configuration prometheus will start collecting those metrics and saving them in its database what about monitoring your own applications let's say you want to see how many requests your application is getting at different times or how many exceptions are occurring how many server resources your application is using etc for this use case there are prometheus client libraries for different languages like node.js java etc using these libraries you can expose the slash metrics scraping endpoint in your application and provide different metrics that are relevant for you on that endpoint and this is a pretty convenient way for the infrastructure team to tell developers emit metrics that are relevant to you and will collect and monitor them in our infrastructure and i will also link the list of client libraries prometheus supports where you can see the documentation of how to use them so i mentioned that prometheus pulls this data from endpoints and that's actually an important characteristic of prometheus let's see why most monitoring systems like amazon cloud watch or new relief etc use a push system meaning applications and servers are responsible for pushing their metric data to a centralized collection platform of that monitoring tool so when you're working with many microservices and you have each service pushing their metrics to the monitoring system it creates a high load of traffic within your infrastructure and your monitoring can actually become your bottleneck so you have monitoring which is great but you pay the price of overloading your infrastructure with constant push requests from all the services and thus flooding the network plus you also have to install daemons on each of these targets to push the metrics to monitoring server while prometheus requires just a scraping endpoint and this way metrics can also be pulled by multiple prometheus instances and another advantage of that is using paul prometheus can easily detect whether service is up and running for example when he doesn't respond on the pull or when the endpoint isn't available while with push if the service doesn't push any data or send its health status it might have many reasons other than the service isn't running it could be that network isn't working the package got lost on the way or some other problem so you don't really have an insight of what happened but there are limited number of cases where a target that needs to be monitored runs only for a short time so they aren't around long enough to be scraped example could be a batch job or scheduled job that say cleans up some old data or does backups etc for such jobs prometheus offers push gateway component so that these services can push their metrics directly to prometheus database but obviously using pushgateway to gather metrics in prometheus should be an exception because of the reasons i mentioned earlier so how does prometheus know what to scrape and when all that is configured in prometheus.yaml configuration file so you define which targets prometheus should scrape and at what interval prometheus then uses a service discovery mechanism to find those target endpoints when you first download and install prometheus you will see the sample config file with some default values in it here is an example we have global config that defines scrape interval or how often prometheus will scrape its targets and you can override these for individual targets the rule files block specifies the location of any rules we want prometheus server to load and the rules are basically either for aggregating matrix values or creating alerts when some condition is met like cpu usage reached 80 percent for example so prometheus uses rules to create new time series entries and to generate alerts and the evaluation interval option in global config defines how often prometheus will evaluate these rules in the last block scrape configs controls what resources prometheus monitors this is where you define the targets since prometheus has its own metrics endpoint to expose its own data it can monitor its own health so in this default configuration there is a single job called prometheus which scrapes the metrics exposed by the prometheus server so it has a single target at localhost 1990 and prometheus expects metrics to be available on a target on a path of slash metrics which is a default path that is configured for that endpoint and here you can also define other endpoints to scrape through jobs so you can create another job and for example override the scrape interval from the global configuration and and define the target host address so a couple of important points here so the first one is how does prometheus actually trigger the alerts that are defined by rules and who receives them prometheus has a component called alert manager that is responsible for firing alerts via different channels it could be email it could be a slack channel or some other notification client so prometheus server will read the alert rules and if the condition in the rules is met an alert gets fired through that configured channel and the second one is prometheus data storage where does prometheus store all this data that it collects and then aggregates and how can other systems access this data prometheus stores the metrics data on disk so it includes a local on disk time series database but also optionally integrates with remote storage system and the data is stored in a custom time series format and because of that you can't write prometheus data directly into a relational database for example so once you've collected the metrics prometheus also lets you query the metrics data on targets through its server api using promptql query language you can use prometheus dashboard ui to ask the prometheus server via promql to for example show the status of a particular target right now or you can use more powerful data visualization tools like grafana to display the data which under the hood also uses promql to get the data out of prometheus and this is an example of a promql query which this one here basically queries all http status codes except the ones in 400 range and this one basically does some sub query on that for a period of 30 minutes and this is just to give you an example of how is query language look like but with grafana instead of writing promptq queries directly into the prometheus server um you basically have grafina ui where you can create dashboards that can then in the background use prom ql to query the data that you want to display now concerning promql the prometheus configuration in grafana ui i have to say from my personal experience that configuring prometheus yml file to scrape different targets and then creating all those dashboards to display meaningful data out of the script metrics can actually be pretty complex and it's also not very well documented so there is some steep learning curve to learning how to correctly configure prometheus and how to then query the collected metrics data to create dashboards so i will make a separate video where i configure prometheus to monitor kubernetes services to show some of the practical examples and the final point is an important characteristic of prometheus that it is designed to be reliable even when other systems have an outage so that you can diagnose the problems and fix them so each prometheus server is standalone and self-containing meaning it doesn't depend on network storage or other remote services it's meant to work when other parts of the infrastructure are broken and you don't need to set up extensive infrastructure to use it which of course is a great thing however it also has disadvantage that prometheus can be difficult to scale so when you have hundreds of servers you might want to have multiple prometheus servers that somewhere aggregate all this metrics data and configuring that and scaling prometheus in that way can actually be very difficult because of this characteristic so while using a single node is less complex and you can get started very easily it puts a limit on the number of metrics that can be monitored by prometheus so to work around that you either increase the capacity of the prometheus server so it can store more metrics data or you limit the number of metrics that prometheus collects from the applications to keep it down to only the relevant ones and finally in terms of prometheus with docker and kubernetes as i mentioned throughout the video with different examples prometheus is fully compatible with both and prometheus components are available as docker images and therefore can easily be deployed in kubernetes or other container environments and it integrates great with kubernetes infrastructure providing cluster node resource monitoring out of the box which means once it's deployed on kubernetes it starts gathering matrix data on each kubernetes node server without any extra configuration and i will make a separate video on how to deploy and configure prometheus to monitor your kubernetes cluster so subscribe to my channel click that notification bell and you will be notified when the new video is out
Up Next

14:38
Circle of Thirds Explained: Essential Music Theory for Guitarists
@rickysguitar
336.2K views•2021-11-30

12:54
Triumph of Orthodoxy Icon: Byzantine Art & History Explained
@BenCallan
2.1K views•2024-08-06

94:55
Learn Go Programming by Building a TodoList App | Full Golang Crash Course
@TechWorldwithNana
202.2K views•2024-10-14

1:42
Game of Thrones Opening Credits: A Cinematic Analysis
@gameofthrones
46.3M views•2011-04-18
Related Study Plans & Knowledge Roadmaps
Structured learning paths in General & Interdisciplinary Studies
general-studies
Elevator Engineering: History, Physics & Cities
01From Hoists to Safety Brakes: The Dawn of Vertical Lift
02Hydraulic vs. Traction: The Engineering Physics of Elevators
03Modern Speed, Safety, and Algorithms
+ 2 more learning modules
12h5 modules
Explore Roadmap
general-studies
Rubber: Material Science, History & Geopolitics
01Origins of Natural Rubber & Mesoamerican History
02The Chemistry of Natural Rubber & Vulcanization
03The Geopolitics of the Rubber Boom & Colonization
+ 2 more learning modules
12h5 modules
Explore Roadmap
general-studies
Containerization: Evolution, Logistics & Trade
01Ancient Trade & Bulk Cargo: Amphorae to Barrels
02The Industrial Revolution & Cardboard Packaging
03The Containerization Revolution: Malcom McLean
+ 2 more learning modules
12h5 modules
Explore Roadmap
general-studies
Textile Tech: Evolution, Labor & Global Impact
01Pre-Industrial Textiles: Handloom & Cottage Industry
02Mechanization: The Spinning Jenny to the Power Loom
03The Factory System & Global Labor Transformation
+ 2 more learning modules
10h5 modules
Explore Roadmap