
























DNA quantitation is essential for forensic DNA analysis because commercial amplification kits require a narrow DNA input range (0.5-2.0 nanograms), and both insufficient and excessive DNA can cause artifacts such as high stutter (off-scale data causing misidentification of peaks), pull-up (spectral overlap between dyes), and minus A peaks (incomplete adenine tail addition), while human-specific assays are necessary to exclude non-human DNA from crime scenes, and Y-specific assays help detect male DNA when female DNA dominates the sample.
qPCR Essentials: DNA Quantitation Methods & Workflow
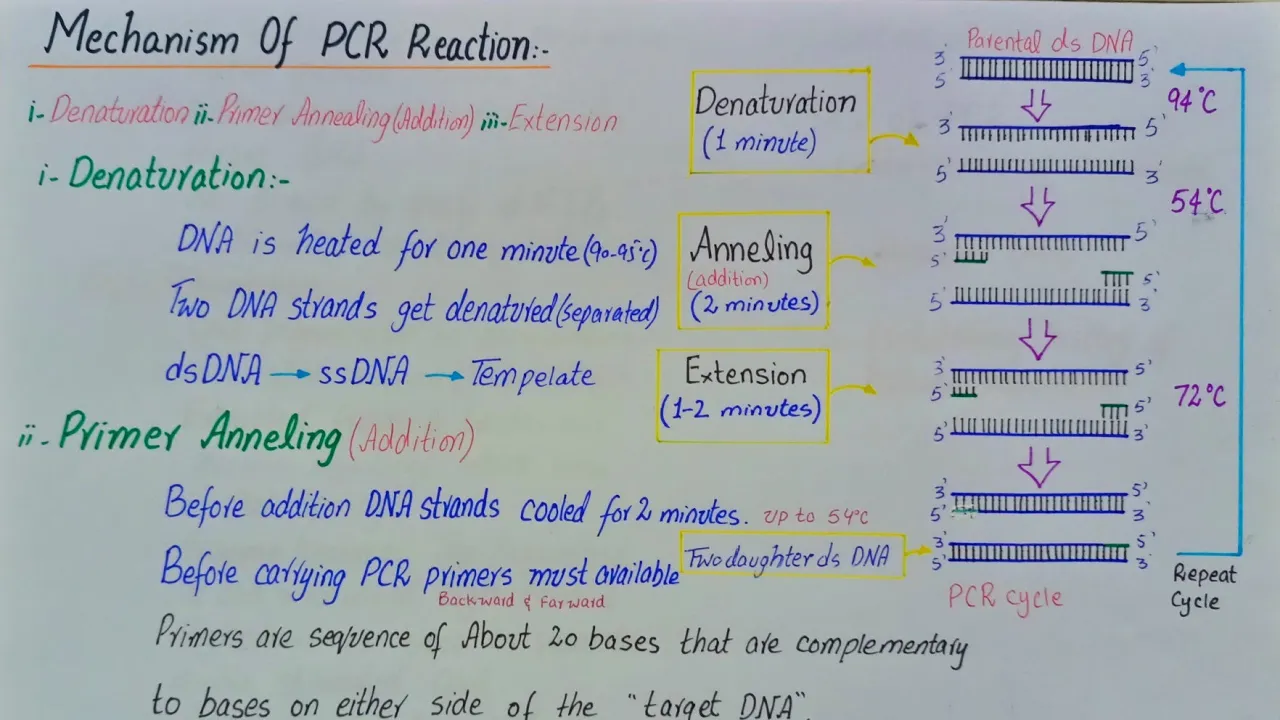
Added:The fundamental mechanism of standard Polymerase Chain Reaction (PCR), including its three main phases: denaturation, annealing, and extension.
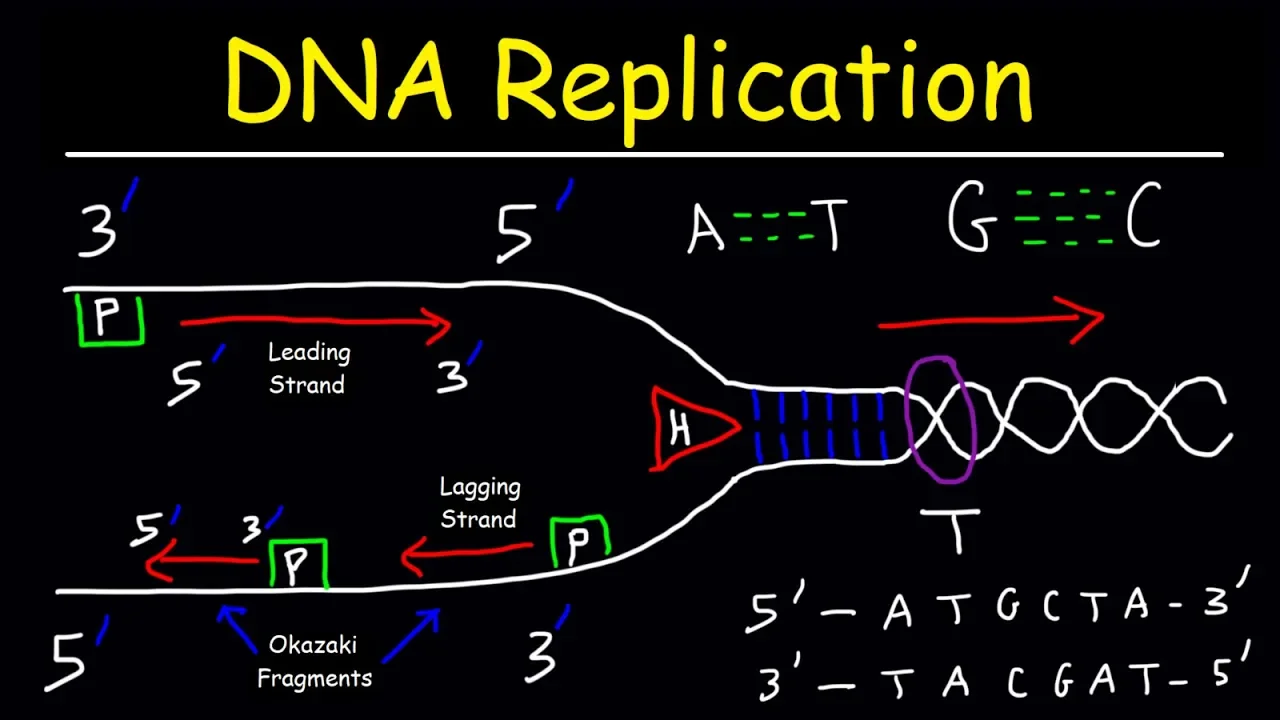
Basic concepts of molecular biology, specifically DNA structure, complementary base pairing, and the role of primers and DNA polymerases.
An understanding of fluorescence and optical detection principles, as qPCR relies on fluorescent dyes or probes to monitor amplification in real-time.
The basic steps of a forensic DNA workflow, specifically biological sample collection and DNA extraction techniques.
Downstream forensic applications, specifically Short Tandem Repeat (STR) typing and capillary electrophoresis for human identification.
Advanced multiplex qPCR assay design used to simultaneously assess DNA quantity, degradation index, and the presence of PCR inhibitors.
In-depth analysis of qPCR data, including calculating amplification efficiency, threshold cycle (Ct/Cq) values, and absolute vs. relative quantification methods.
The role of DNA quantitation in preparing libraries for forensic Next-Generation Sequencing (NGS) workflows.
1.1K views8likes19:15Original Release: 2012-10-02
hi my name is Rob and this is the quantitative PCR lecture the lecture will be broken down into four separate sessions the first session session one is Introduction to quantitation methods the four sessions that will make up the quantitative PCR lecture are one introduction to quantitation methods two an overview of qpcr three instrumentation and software and for plate preparation and data analysis in the first session introduction to quantitation methods we will be going over the following topics why quantitate DNA why use human specific assays the benefits of using both autosomal and Y specific assays PCR nomenclature other quantitation methods and a very brief history of qpcr let's start off with why quantitate DNA quantitation shows how much DNA is available for amplification commonly DNA that results from extraction may have to be concentrated or diluted before amplification can take place also quantitation can assist in the troubleshooting during the analysis process commercial amplification kits are designed to give best results within a narrow DNA quantity range typically between 0.5 to 2.0 nanograms the kit components are optimized for a certain amount of input DNA too much or too little input DNA will adversely affect data interpretation we will briefly go over some of the common problems associated with too much input DNA these are high stutter pull-up and split Peaks from minus a these will be gone into in more detail later in your training High stutter High stutter is caused by off-scale data off-scale data occurs when the quantity of DNA present is more than the highest level that the CCD camera of the instrument can detect first let's go into what is stutter stutter is a small Peak that is four base pairs less than the main Peak this is a known artifact and it is seen in data from the diagram at the side you can see where the two stutter Peaks those small peaks in blue are labeled and they correspond to their main Peaks which are also in the same color blue Dy the peak height of stutter varies but it is approximately 15% of the main Peak the software knows the percentage of the stutter Peak and determines if the small Peak is a stutter Peak or if it is not if it is a stutter Peak it is fil out and not assigned an a call if dat is off scale the true height of the main Peak is not known therefore the software cannot accurately calculate the stutter peak's percentage of the main Peak and in situations like this the stutter Peak may be labeled as a true Peak for example if the stud at the Locust D3 S1 358 is 10% then any Peak four base pairs before the main Peak with a height of 10% or less than the main Peak is determined to be stutter and therefore is not assigned and a little call when dealing with off-scale data for example a peak that is rarely 10,000 rfus high but the highest peak height the software can detect is 8,000 rfus the stutter Peak which is 10% of the true Peak height will be at 1,000 rfus the software looks at the stutter Peak and determines that it is more than 10% of the main Peak this is because the software thinks the main Peak is only 8,000 r fuse because that is the highest level it can detect as a result it will assign the start a peak and a little call in mixture inter interpretations this can cause problems when trying to sort out contributors now let's go into pullup pull-up is when a peak of one color is seen under a peak of another color the dieses used in the kits have wavelengths of fluorescence that overlap and this is known as spectral overlap the software is able to correct for the spectral overlap between the dieses from the graph the areas that are in common to the dyes are the areas where spectral overlap would occur the closer the dieses are to their wavelengths to each other the more spectral overlap occurs between those dieses the calculation of expected spectral overlap is based on regular Peak Heights the spectral overlap that is not corrected for is visible in analyzed data and is called pull-up the diagram shows a small peak in blue which is pull-up that resulted from the Green Peak and also a small peak in green that was pull up that resulted from the yellow Peak with off-scale data the spectral overlap is greater than the values calculated by the software therefore the software subtracts out the expected amount of spectral overlap but some of it remains and it is seen as a small Peak under a main Peak and it can be assigned an a Leal call this diagram shows pullup in the yellow D from the off-scale peak in the green D it is important to note that the pull up Peak which is much smaller is lined up directly under the main Peak that is causing it to be pulled up now let's talk about minus a reagents in PCR have a tendency to add a three prime nuclei tail at the end of Amplified DNA this is the adenine nucleotide that is added on the whole time which is at the end of the PCR is to ensure that all of the Amplified DNA is given time for the addition of the poly A3 Prime tail by the re agents this ensures that all Peak Heights are uniform all Peak Heights are now considered to be plus a because there is the addition of the adenine tail if there is too much input DNA then there is not enough time for the addition of the adenine nucleotide to all of the Amplified DNA this may result in a peak showing up in the data that is one base pair shorter than the main Peak DNA without the adony nucleotide tail is one base pair shorter than the main Peak and is referred refer to as minus a because it is lacking the a nucleotide this can appear as either shoulder Peak as shown in the diagram two separate Peaks or a split Peak here we have a diagram where the minus a is causing there to be two separate Peaks notice that the both Peaks are only one base pair apart minus a can also pair as a split Peak where basically the top of the peak instead of having one point will have two points at the other end of the scale there are common problems associated with too little DNA you can end up with no data lowlevel data lack of amplification of some Losi Locus imbalance and a lelic Dropout no data simply means there's not enough DNA input into the PCR reaction and therefore you get a negative result lowlevel data means that Peaks are seen but not enough DNA was present for the Peaks to cross the minimum threshold and be assigned on a little call lack of amplification of some loai occurs with small amounts of DNA smaller loai are Amplified and larger loai may not be Amplified this can result in a partial profile or the profile May erroneously appear to be from degraded DNA the diagram shows that the peit of the smaller lowside which come off first are much higher than the peits of the larger Loi which come off later Locus imbalance occurs when the there's unbalanced amplification of two alals at a Locus this is caused when there is too little input DNA and there are stochastic fluctuations in the rati of the two different Al alic drop out occurs when an entire Al is missing from a profile this can result in a Tero zygote showing up as a homozygote this diagram shows the same profile the top part of the diagram is with the correct amount of input DNA and the bottom part of the diagram is what occurs when too little DNA was input into the system here you can see that a LC Dropout occurred at the VW Locus and there was a Locus imbalance that occurred at the D21 Locus problems caused by too little or too much DNA are not realized until date interpretation this causes a waste of time and resources to repeat the process if an Evidence sample was consumed in the first attempt then the process cannot be repeated other uses of quantitation it may determine if other amplification methods are appropriate for the testing example LCN low copy number or minis SDR testing these can be employed if the DNA quantity is too small quantitation can be used to troubleshoot data it can be used to check the optimal amount of DNA for new essays and some quantitation methods can Target specific types of DNA y or mitochondrial testing DNA quantitation can also be used for troubleshooting a problem with DNA analysis is generally not seen until the profile is developed in the last stage of the DNA process it must then be determined at what point the problem occurred in the analysis process problems can occur at several points and troubleshooting the entire process is very timec consuming an accurate and reliable means of quantitation will reduce the time for troubleshooting because that will indicate that all processes performed before the quantitation which are the screening and extraction processes were done properly why use human specific assays crime scenes are not clean pristine areas DNA from non-human sources are usually present example bacterial or animal DNA human specific assays will only target human DNA so other DNA does not affect your results in the DNA audit document it requires Laboratories to determine the quantity of human DNA this is outlined in the dab standard 9.3 benefits of using both autosomal and Y specific assays when amplifying total human DNA if there is too much of one person's DNA then it is possible for that person's DNA to mass the presence of the DNA from the other individual this is commonly seen with vaginal swabs where the female DNA DNA will overpower the male DNA if there are only a few cells from the male present this can result in a single Source profile or the profile from the other person being too low to be of any use benefits of using both autosomal and Y specific assays this is beneficial in most crimes involving a male and a female evident samples taken directly from the body of a female will typically have a lot of female cells if the female DNA is in a much greater quantity than the male then during total human amplification there may be little or no amplification of the male DNA this can lead to a false negative result why specific assays can Target only male DNA regardless of how much female DNA is present this is beneficial in the following scenarios a sexual salt where semen is present but little or no sperm cells are present especially on vaginal swabs a mixture of male and female blood at the scene or on the female where the female bled a lot more than the male the transfer of saliva from male onto a female when swapping the skin of a female it is possible to remove a lot of female epithelial cells in the process and also with fingernail scrapings in these cases amplification with a yst strr kit may be more beneficial to the case depending on the ratio of quantities of total human to Y DNA why quantitation is usually done along with total human quantitation because when deciding how much DNA is needed for amplification the quantity of total human DNA is used If the ratio of human to male is too high then conventional amplification may not be sufficient to bring up the male profile using Y quantif as a screening tool there are typically a high number of sexual assault cases the screening process is lengthy there is presumptive testing which is Then followed by confirmatory tests some Laboratories do a quick extraction of a small amount of evidence samples and then quantitate them with total human and Y kits if male DNA is present then the evidence is put through the full screening process if there is no male DNA then no more work on that piece of evidence is needed now let's go over some PCR nomenclature qpcr is known as quantitative PCR this usually implies using PCR for DNA quantitation in real time not endpoint rtpcr stands for Real Time PCR but in other fields it can stand for reverse transcript's PCR and often it is used in conjunction with real-time PCR appon is the product of PCR calibrant DNA is the DNA of a known concentration that is serially diluted to prepare a standard curve this can also be called standard DNA Baseline is a linear function subtracted from the data to eliminate background signal the threshold is a value selected when the PCR is in the exponential phase of growth CT the cycle threshold this is the cycle number at which the amplification curve crosses the selected threshold value and E stands for efficiency and this is a measure relating to the rate of PCR amplification we will now go over some other quantitation methods that is UV yield gels alquan Quan blot P Green fluorescence cyber green which is a form of real-time PCR quantitation let us begin with the UV method the UV method uses a spectr photometer equipped with a UV lamp the absorbance readings are performed at 260 nanom where DNA absorbs light most strongly from the number generated the amount of DNA can be estimated this is because one o which is optical density which is the absorbance value for the DNA is equal to 50.0 nanog per milliliter of double stranded DNA some of the problems with the UV method it is not very sensitive it consumes a lot of fic specimen absorbance measurements are not specific for human DNA it can also be influenced by by contaminating proteins and phenol which is left over from extraction procedures like organic extractions can give falsely High signals with the yield gel method the DNA is loaded onto a gel the gel is then stained with etherium bromide athenium bromide intercalates in the DNA molecule and fluoresence on the UV light then this fluoresence of the sample is compared to fluoresence given off from DNA samples of known concentrations the problems with using eel gel once again it is also not very sensitive it consumed a lot of sample and it was not specific to human DNA the ALU Quant quantitation method is an asset that probes ALU repeats that are in high abundance in the human genome probe Target hybridization initiates a series of entic reactions that end in the production of ATP and the oxidation of luciferin resulting in the production of light the light intensity is then read by luminometer and is proportional to the amount of DNA sample quantities are determined by comparison to a standard curve problems that occurred with the alquan system was that it was not able to detect the presence of Inhibitors and it did not give accurate results for degraded samples the Quant blot also known as the slot blot procedure uses a probe that is complementary to a primate specific Alpha satellite DNA sequence called d17 Z1 which is located on chromosome 17 it can either use a chemiluminescent or a colorometric detection with tmb the DNA is immobilized to a nylon membrane then complimentary sequences bind the biotinated Probe on the probe is strepavidin horseradish peroxidase conjugate streptavidin horseradish peroxidase conjugate either oxidizes a luminal based reagent and that's going to give you chemoluminescent detection and that emits photons or it oxidizes tetramethyl benzine to produce a blue color and this is your colorometric detection the quantity of DNA is then determined by visual comparison between samples and a series of Standards run along with samples the diagram below shows the point at which the probe attaches to the membrane and also it shows where the reaction takes place to give off your Cham luminescent detection problems with the Quant blot system was that results were subjective because you were visually comparing intensity of color from sample to standards and people may vary on their interpretation of the results in some cases a r was used to reduce the subjectivity of the testing also the method was extremely timec consuming and labor intensive process and it was not able to detect any PCR Inhibitors the Pico green fluoresence method uses Pico green which is a fluorescent intercalating D whose fluoresence is is greatly enhanced when bound to double stranded DNA the quantitation is then done by comparison to a standard curve which was constructed from standards the problems with this is that it was not specific for human DNA cyberg green real-time PCR quantitation the cyberg green system works by the detection of fluorescence given off by the cyberg green diey as it binds with double stranded DNA the method uses human specific paraments for ALU sequences the more double stranded DNA that builds up from PCR the more fluorescence that is given off the only real problem with the cyberg green system is that it binds to double stranded DNA and some extraction methods leave DNA in a single stranded form now let's go over a brief history of qpcr qpcr is a recently developed technique it was developed by hugi in 1993 he used a modified thermal cycler with a UV detector and a CCD camera ethidium Pride was used as an inating reported die and as the concentration of doubl stranded DNA increased so did the fluoresence on this slide is the reference information for the first paper on qpcr this is the end of Session One
Up Next

62:40
Murdaugh Trial Forensic Blood & DNA Analysis | SLED Scientist Testimony
@TheTrialChannel_
420 views•2025-10-23

12:54
Triumph of Orthodoxy Icon: Byzantine Art & History Explained
@BenCallan
2.1K views•2024-08-06

4:39
Forensic DNA Analysis Updates and Training | January 2017
@FIUForensics
217 views•2017-01-19

1:42
Game of Thrones Opening Credits: A Cinematic Analysis
@gameofthrones
46.3M views•2011-04-18
Related Study Plans & Knowledge Roadmaps
Structured learning paths in General & Interdisciplinary Studies
general-studies
Elevator Engineering: History, Physics & Cities
01From Hoists to Safety Brakes: The Dawn of Vertical Lift
02Hydraulic vs. Traction: The Engineering Physics of Elevators
03Modern Speed, Safety, and Algorithms
+ 2 more learning modules
12h5 modules
Explore Roadmap
general-studies
Rubber: Material Science, History & Geopolitics
01Origins of Natural Rubber & Mesoamerican History
02The Chemistry of Natural Rubber & Vulcanization
03The Geopolitics of the Rubber Boom & Colonization
+ 2 more learning modules
12h5 modules
Explore Roadmap
general-studies
Containerization: Evolution, Logistics & Trade
01Ancient Trade & Bulk Cargo: Amphorae to Barrels
02The Industrial Revolution & Cardboard Packaging
03The Containerization Revolution: Malcom McLean
+ 2 more learning modules
12h5 modules
Explore Roadmap
general-studies
Textile Tech: Evolution, Labor & Global Impact
01Pre-Industrial Textiles: Handloom & Cottage Industry
02Mechanization: The Spinning Jenny to the Power Loom
03The Factory System & Global Labor Transformation
+ 2 more learning modules
10h5 modules
Explore Roadmap