


























The Cournot oligopoly model, developed by 19th-century French mathematician Augustin Cournot, demonstrates that in markets with few suppliers (oligopolies), firms compete on nonprice variables such as sales volume rather than just price, and this competition leads to welfare outcomes that fall between monopoly and perfect competition; specifically, with linear demand and constant marginal costs, the output under Cournot equilibrium is 2/3 of the perfectly competitive level for two firms, increasing to 4/5 for four firms and approaching the competitive level as more firms enter the market, showing that even a small number of competing firms can significantly reduce welfare losses compared to monopoly conditions.
Cournot Oligopoly: Equilibrium vs Monopoly & Perfect Competition
Added:Understanding of perfect competition and monopoly market structures, including how they determine equilibrium price and quantity.
Familiarity with basic game theory concepts, specifically the definition and application of a Nash Equilibrium.
Knowledge of microeconomic profit maximization, particularly how firms set marginal revenue equal to marginal cost.
Ability to interpret and manipulate linear inverse demand functions and marginal cost curves mathematically.
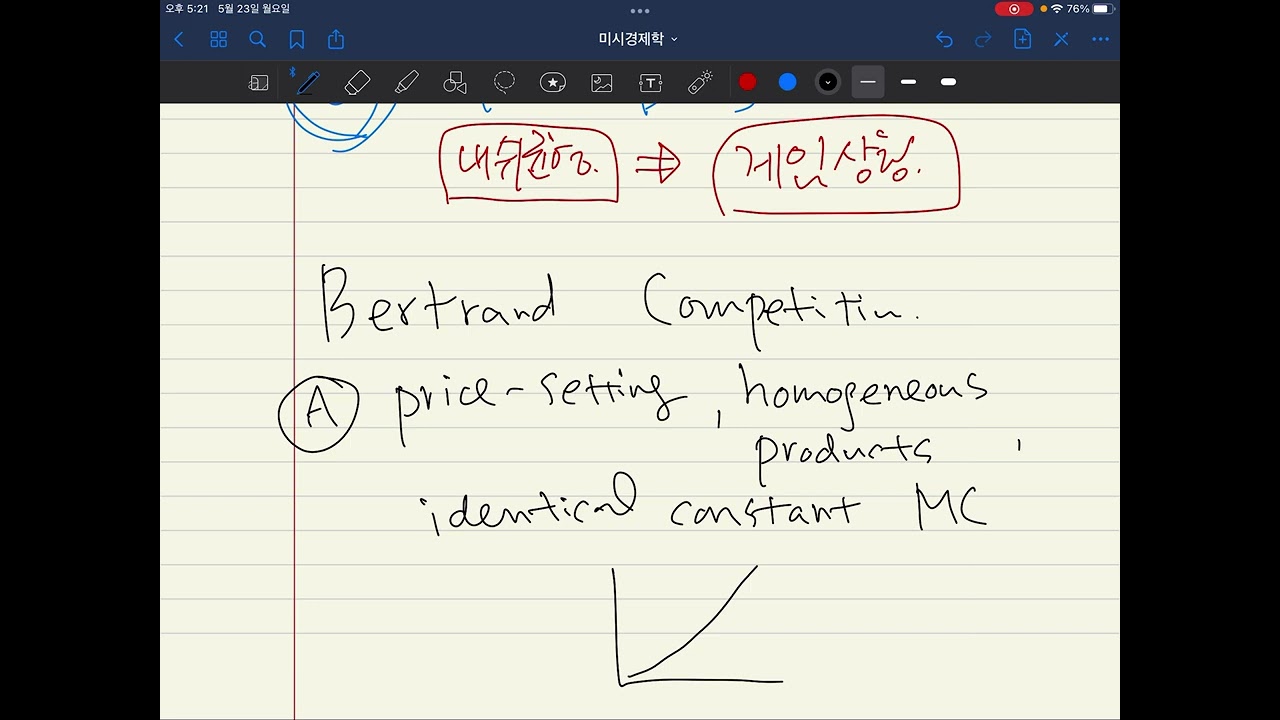
The Bertrand Duopoly Model, which explores the dynamics and outcomes when firms compete on price rather than quantity.
The Stackelberg Model, analyzing sequential-move games where one firm acts as a market leader and the other as a follower.
Collusion and cartel stability, examining how cooperative agreements form and why firms have a game-theoretic incentive to cheat.
Applications of oligopoly theory to real-world antitrust policy, merger regulation, and measures of market concentration like the Herfindahl-Hirschman Index (HHI).
143.3K views495likes18:01Original Release: 2011-11-15
hello my name is Kevin Hind and this presentation concerns Corno oligopoly olop refers to a situation where there are only a few suppliers in the industry in some instances there may only be two suppliers and in that case we call uh the market structure a duopoly there are examples of duopoly in the UK for example the sugar market and and also the salt Market here there are two very dominant providers of salt and sugar respectively and the the amount of production from Elsewhere for example Imports is actually quite low the other part of this particular presentation refers to the work of Austine Corno a 19th century French mathematician who showed that firms can compete on nonprice variables in particular sales volume and this is particularly relevant for an understanding of modern-day um market economies firms don't always just compete on price they compete on variables such as um design uh differentiation in terms of marketing Etc so the point about the Corno model is that it recognizes that in a market firms are interdependent in other words what that means is that a firm will react to another firm's decisions uh for example if a firm changes its design of its particular product then competitors will react by looking at its design and changing the the design accordingly um more specifically in the case of the Corno model each firm is trying to maximize its profits given what it believes the other firm will produce so the firm is producing or competing using nonprice techniques in this instance um the firms are competing based on sales volume quantity and of course that isn't too difficult to imagine many internet providers look to use look to uh get sales based on number of users so they're trying to sell packages to individual users uh so sales volume is very important in in the modern business world the simplest model that we can look at is a duopoly and as I mentioned earlier a duopoly is a situation where there are only two sellers in the market so we're assuming there are two sellers in the market in the example that we're going to use and that the barriers to entry are very high so there's no potential competition so we're going to look at actual competition in the marketplace initially using two firms the best way of understanding how um Corno operates is to provide a numerical example so uh in this particular case we're going to say that the market demand is of a particular type that the inverse market demand function is p P = to 30 minus Q where Q is the output and P is the price and we're going to assume that the output in the market is made up of the um two of the output of two firms firm one and firm two denoted q1 and Q2 respectively we're also going to assume that both firms have equal outputs so the output of firm one equals the output of firm two and we're also going to assume that average cost and marginal cost are equal uh to each other and that they equal to some value we'll call it 12 that means in this instance that there are zero fixed costs so I'm making a lot of assumptions about uh what the market demand is it's a linear demand curve P equal 30 minus q and that the average cost equals the marginal cost uh that it's a constant amount of 12 and that fixed cost are zero but as you'll see this is quite helpful when we want to compare the welfare outcomes of a Corno oligopoly with that of Monopoly and perfect competition I suppose we really ought to get an idea of how uh we might interpret this particular situation diagrammatically and that's the purpose of this slide um here I've drawn a traditional Monopoly diagram um and it's based upon How firm might firm one might actually interpret the situation that it's given uh using that traditional Monopoly diagram and so imagine your firm one and you're faced with a demand curve of of um price equal to 30 minus Q so on the vertical axis um we have price at 30 when output is zero and and when price is zero the output is 30 um marginal cost is 12 so um where the demand equates with the marginal cost where price equals marginal cost which is a competitive situation then uh we get um output of 18 so that would be the market demand if for the for the whole Market uh however let's assume that firm one believes that firm two will produce that entire market demand in other words it will produce the whole 18 units in this market so if firm one believes that firm 2 will produce 18 units it won't have any of the market left for it so it will produce zero on the other hand if the firm one conjectures that firm two will produce zero okay so what that means is that it's going to act like a it can has the opportunity to act like a monopolist and it will produce nine units which is half the um half the market output um and that's where it will maximize its profits so what we've done there is we've conjectured about as firm one we've said what would how can we maximize our profits given what we think firm 2 is doing in the first instance we assume that firm 2 is going to produce the whole Market provide the whole market so that would leave nothing for firm one on the other hand if firm one believed that firm 2 wasn't going to produce anything then it would produce a monopoly output in this case equal to 9 units and it would maximize its profits in doing so now as I mentioned we need to express um the Corno equilibrium in terms of reaction curves and that's done on this this particular slide and it just might take a moment to uh to say something about this let's go if you remember from our diagram our earlier diagram where we had we were looking at firm one's uh reactions we said that if firm one believed that firm 2 was going to produce the entire market then it would produce nothing and you can see this on the um line called firm 1's reaction curve which we've said was q1 is equal to 9us a half Q2 um because there when Q2 when firm one believes that Q2 is going to be 18 it will produce zero on the other hand if firm um firm one believes that firm two won't produce anything then it it will believe it will produce a profit maximizing output of nine units so clearly on firm one's reaction curve we've got the two extremes uh on the q1 axis we've got nine when firm one is effectively a monopolist and um on where where Q2 is 18 firm one is producing nothing so we've got perfect competition so clearly at an output of nine firm one is producing its most profit because it's got in a monopoly situation whereas it when it's producing zero and firm 2 is it believes firm 2 is producing the whole Market of 18 it's like a perfectly competitive equilibrium and it from profits economic profits are zero well we can do the same for uh firm 2's reaction curve um and that's also mapped on here so here we've got firm 2's reaction curve which is Q2 is equal to 9 minus a half of q1 and there was firm two's out profit maximizing output depends upon what it believes firm one's uh output decisions will be and that's the the functional relationship expressed here in in some form of uh equation and the equilibrium is where q1 is 6 and Q2 is six so that's known as the Corno equilibrium and in a previous um a previous slide we've shown how that Corno equilibrium comes about and we can put um these particular data points on the um on the reaction curve diagram um we've said that under collusion under Monopoly if you like um that the both firms will produce 4.5 uh units of output each and under competition both firms produce nine units of output each so that means that under competition more output is being produced than under Coro and of course more output is being produced under Coro than under Monopoly and we've said something also about prices so what we need to do is maybe show that on a monopoly diagram in this diagram we are showing the Coro equilibrium um using the traditional Monopoly approach we've got a monopoly diagram in effect here and if you remember from our um equations where price was equal to 30 minus q and marginal cost was equal to 12 when we looked at the numbers we showed that under perfect competition price would equal 12 and quantity would equal 18 so if firms um operated under perfectly competitive um in a perfectly competitive way then we would be at Point like B where demand was equal to uh Supply market supply marginal cost is equal to the price and we would be producing 18 units at a price of 12 um under Monopoly though if both firms colluded then we'd be producing an output of nine both firms of producing 4.5 units each and the price would be 21 uh in the market now under a two firm Corno oligopoly a duopoly then we found that the output was 12 and the price was 18 and what we can also see here I hope is that when we compare Monopoly with perfect competition and when we compare um the cor ooly with perfect competition and Monopoly um we get some quite interesting results so when we look at the welfare loss from Monopoly it's a b c okay prices are greater than marginal cost and outputs are lower under Monopoly they are than they are under perfect competition but under a two firm Corno the welfare loss is small smaller it's area efb so under Corno under Corno assumptions where firms are competing on nonprice terms that is on sales volume in this case the welfare loss Falls and it it just so happens because of the way that I've drawn the demand curve it's a linear demand curve and I've assumed that marginal cost is constant at 12 and they zero fixed cost it just so happens that um when we have two firms competing against each other they produce an output of 2/3 of the perfectly competitive level words 12 is 23 of 18 and if we'd increased the number of firms then let's say by one to three firms and had a triopoly then uh we would find that the um output under the triopoly would be 34 of um the perfectly competitive level okay so um that's 75% of the competitive level it was 23 which is 67% 66.6% uh of the competitive level it moves to 75% of the um competitive level in other words an additional thir firm lowers the welfare loss under oligopoly and if we have four firms given again given my assumptions then we get to a situation where the output level for the four firms would be 4 fifths of the uh competitive level it would be 80% of the uh competitive output level of 18 in this in this case to make that point um I've shown a situation when if we had five firms operating under our Corno assumptions so five firms would produce five six of the competitive output level and uh that's 15 units of output 15 is 56 of the um competitive output level of 18 and what you then see is that the welfare loss Falls from efb to GHB uh so we're we're now at around about 84% of the competitive level so it doesn't take too many firms acting under Corno assumptions in the marketplace acting under Corno assumption in the marketplace to reduce the welfare and I think that's important there are important implications of the Coro model because even with nonprice competition in the marketplace only a few firms are required for output to be close to the perfectly competitive level they can't actually touch the perfectly competitive level you know even if you have 100 firms you uh still have a you're still a little bit away from uh the perfectly competitive uh level um but it's uh very important to recognize how small the welfare loss would be based upon uh the fact that there are just a few firms competing in the market we've shown a situation where there are five firms um would bring about five six of the competitive level in terms of the output so that they would the five firms competing under Corno assumptions would bring 84% of the output levels that would be available under competition perfect competition and that's just actual competition in the industry you know if it's fairly easy for firms to enter the industry then prices could be forced down even further okay then price of course becomes more explicit in the equation in our Corno model price is not as explicit it it's the fact that firms try to maximize their profits given what they anticipate the other is producing okay so um but if we had potential competition that then that would have some big uh implications for price in the um in the market and we would get welfare losses down even further and that so we're emphasizing the point that the existence of Market power per se is not the problem it doesn't take too many firms to reduce the the welfare losses and it so it's rather it's the the abuse of Market power or the conduct of firms that matter in the marketplace and that's that is a a story for another time
Up Next
8:49
Bertrand Duopoly: Price Competition & Equilibrium Outcomes
@MattBirch
88.7K views•2018-11-16

5:07
Impact of Yuan in Indo-Russian Trade Amid Sanctions
@WION
261.9K views•2022-07-01
10:33
Behavioral Economics Explained: Rationality, Nudges, and Risk
@crashcourse
1.1M views•2016-03-12

113:18
The Age of Easy Money: Fed & Inflation | Full Documentary
@frontline
21.2M views•2023-03-15
Related Study Plans & Knowledge Roadmaps
Structured learning paths in Economics
economics
Sovereign Debt: Defaults, IMF & Restructuring
01Introduction to Sovereign Debt & Government Bonds
02Debt Sustainability & Credit Ratings
03Anatomy and History of Debt Crises
+ 2 more learning modules
12h5 modules
Explore Roadmap
economics
Market Design: Matching Theory & Gale-Shapley
01Introduction to Market Design and Price-Free Markets
02Two-Sided Matching & The Gale-Shapley Algorithm
03School Choice Systems and Mechanism Design
+ 2 more learning modules
10h5 modules
Explore Roadmap
economics
Impossible Trinity: Forex, Capital & Policy
01Introduction to Monetary Policy and Central Banking
02Exchange Rates and International Capital Flows
03The Mundell-Fleming Model
+ 2 more learning modules
8h5 modules
Explore Roadmap
economics
Healthcare Economics: Market Failures & Systems
01Introduction to Healthcare Markets and Market Failure
02Asymmetric Information and Adverse Selection
03Moral Hazard and Insurance Design
+ 2 more learning modules
12h5 modules
Explore Roadmap