















![Explained: Supercritical Airfoil [Airplanes]](https://i.ytimg.com/vi/HfW5YTjnp8k/maxresdefault.jpg)

![High lift devices [Aerodynamic Design of Aircraft (Kuchemann) book review Ch4 Ep3]](https://i.ytimg.com/vi/sVbko4B_woA/sddefault.jpg)
![Oblique shocks and expansion fans [Aerodynamics #19]](https://i.ytimg.com/vi/XW2FH8Yn9yE/maxresdefault.jpg)



Wave drag (also called transonic or compressibility drag) is the primary reason aircraft like the F-86 Sabre cannot efficiently fly supersonic at level flight; it occurs when shockwaves form on the aircraft's surfaces as it approaches the critical Mach number (around Mach 0.85 for the F-86), causing drag to increase dramatically—reaching approximately 75% of total drag at Mach 0.9—making level supersonic flight extremely inefficient and requiring aircraft to dive to achieve supersonic speeds.
F-86 Sabre Wave Drag: Transonic Aerodynamics Explained
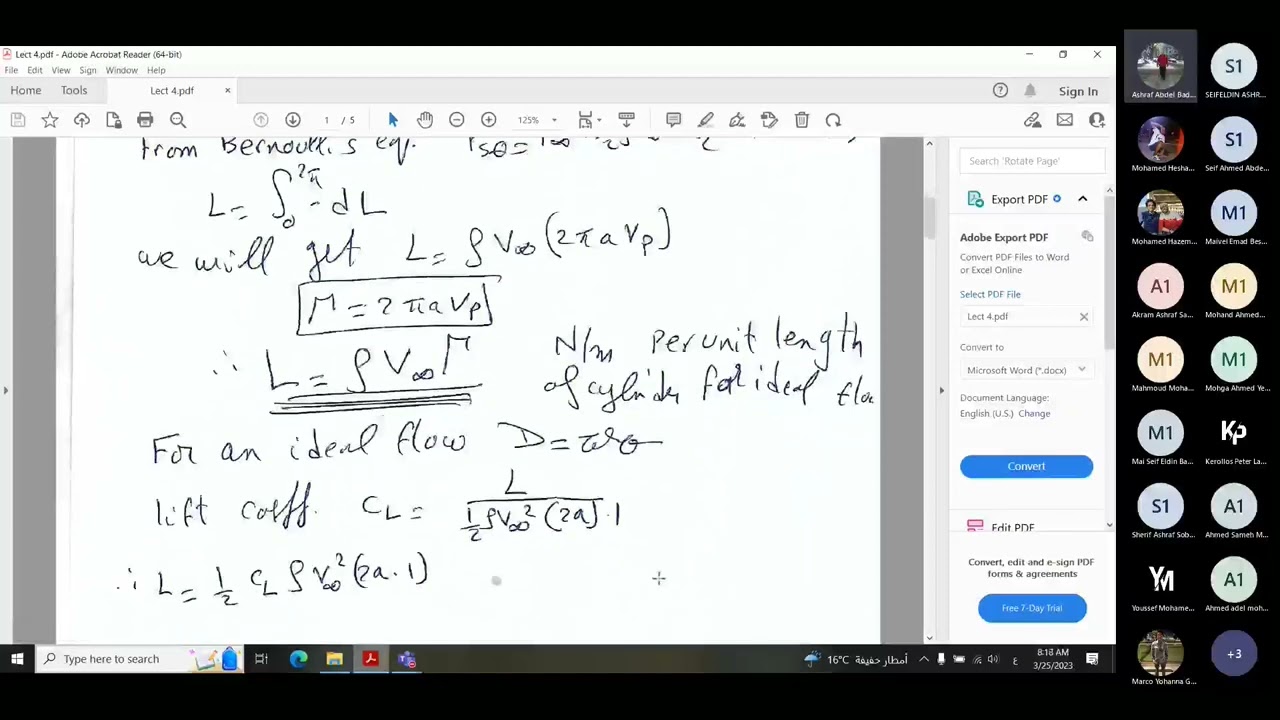
Added:Fundamental concepts of fluid dynamics, specifically the definitions of aerodynamic lift, drag, and the dimensionless drag coefficient (Cd).
The definition of Mach number and the distinction between subsonic, transonic, and supersonic flow regimes.
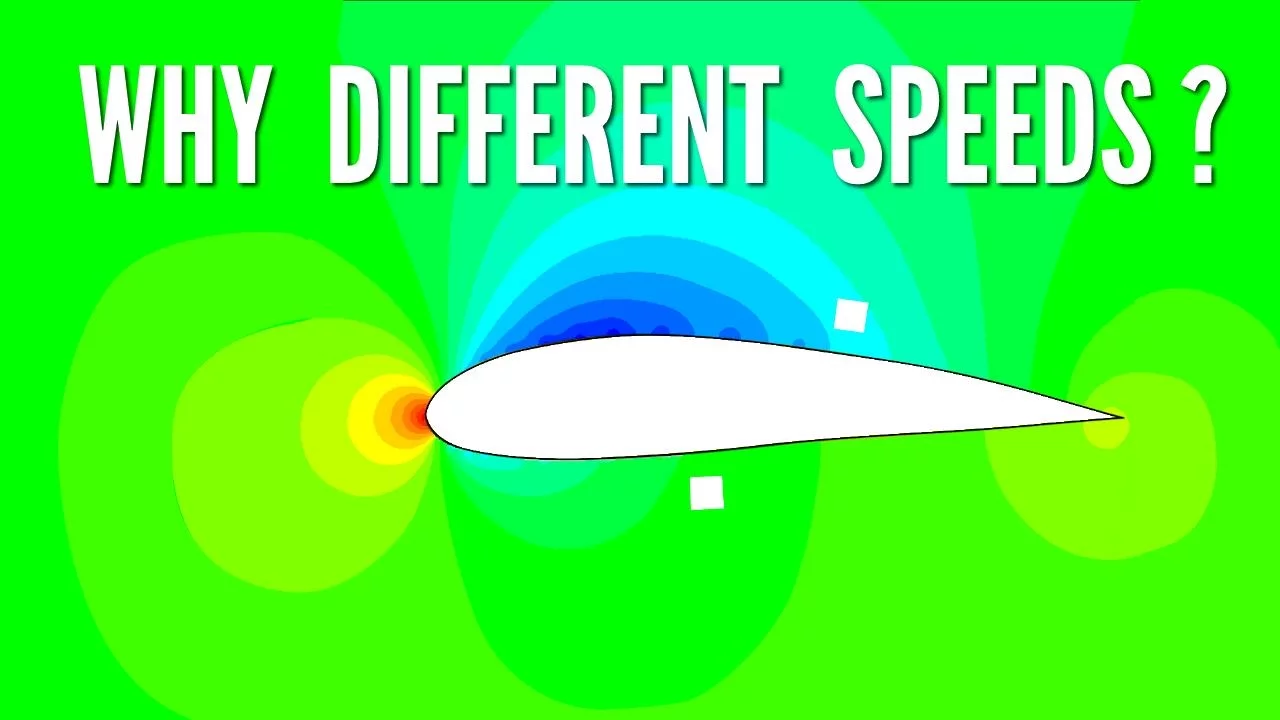
The behavior of airflow over a standard subsonic airfoil, including how local flow velocity increases over curved surfaces.
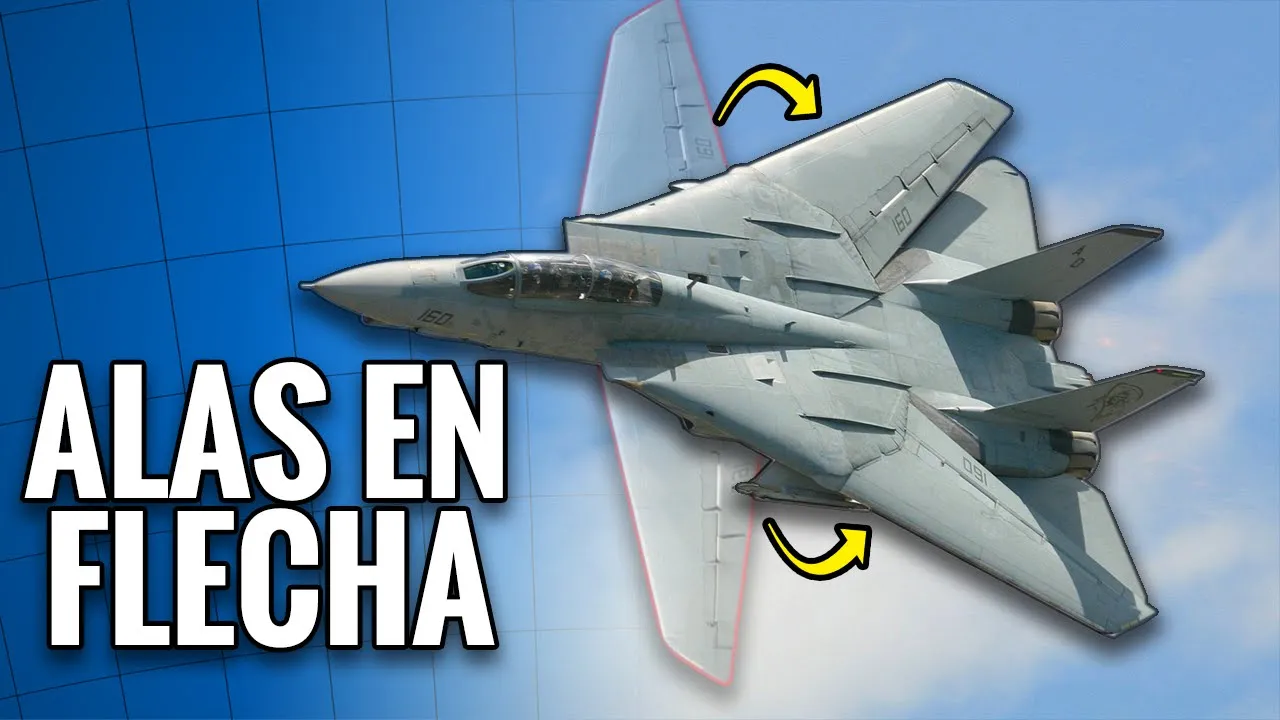
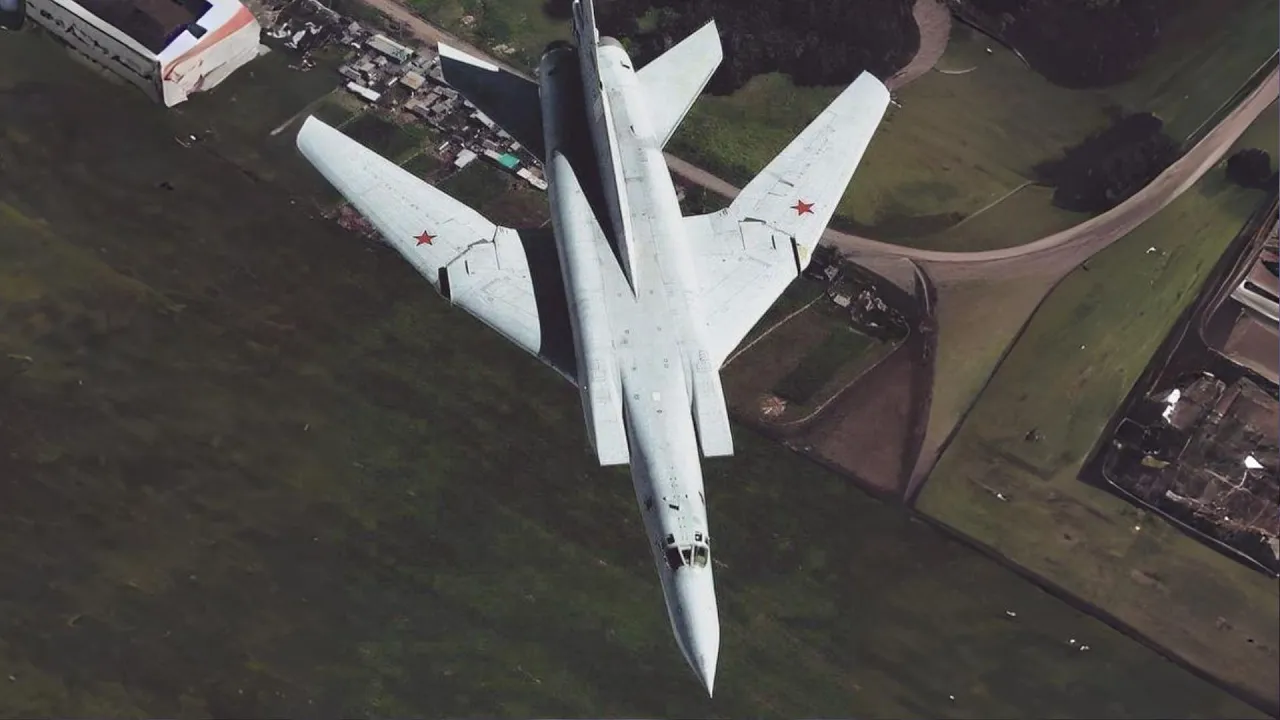
The aerodynamic principles behind swept wing design and how it is used to delay the onset of wave drag.
The Whitcomb Area Rule (or 'coke-bottle' design) and its application in reducing transonic wave drag for fuselage design.
The development and mechanics of supercritical airfoils used in modern commercial aircraft to cruise efficiently in the transonic regime.
Fully supersonic aerodynamics, including the formation of oblique shock waves and expansion fans.
31.2K views1.6Klikes7:05Original Release: 2019-08-23
hey guys item 5.4 here with another technical video in this video we shall explore the mysteries of drag on aircraft as always I'll explain step by step what's going on without going too deep into the details of the physics and aerodynamics involved I hope you find it educational let's start with our first graph this is a graph of the drag is a function of speed for the p-51d 30 which is built with the aircraft coefficients from the warthunder flight model data files the red curve represents the zero live drag which means all the drag that does not come from lift fuselage tail antennas gears pylons all interact with the air flow and create zero lift drag the yellow curve represents the lift-induced drag which is the drag due to the generation of lift the more you need to point your nose up at the stain level fight the more induced drag is generated that's why the yellow curve begins at high drag and reduces when the speed increases as you need a lower angle of attack to stay in level flight the blue curve is simply the sum of the red and yellow curves the speed where the red and yellow curves intersect is the minimum drag speed which is the best glide speed for the aircraft for propeller driven aircraft it is also very close to the optimal climb speed for that aircraft so let's test our graph to do that we'll see what thrust the d30 generates at its top speed of around 620 commerce per hour at sea level and then we'll see if that thrust corresponds to the drag of the d30 on the graph the d30 generates 691 kilograms of thrust which is 6.9 kilonewtons a thrust and thrust equals drag at top speed well draw a horizontal line from 6.9 kilonewtons of drag until it meets the blue curve and then we'll go down vertically to see the corresponding speed it corresponds to run 620 cars per hour the graph works now that we have understood the basics let's draw the same graph for the f-86 the f-86 generates nearly 27 kilonewtons of thrust at its top speed let's see what speed that corresponds to it corresponds to nearly 1400 kilometers per hour faster than the Mitsubishi t2 and definitely supersonic something interesting is going on here let's investigate further with our next graph to make this graph I flew the f-86 and test flight at different throttle settings starting at 40% and ending at 100% and recorded the top speed and thrust for each thorough setting which gives the seven purple stars on the graph as you can see the first three stars follow the blue curve very closely starting at the fourth star there's a sharp increase in drag that diverges from the blue curve at a hundred percent throttle the top speed is correct at a thousand one hundred and five kilometers per hour what's going on here did I make a mistake in the graph nah they'd gaging artificially increase the drag of the f-86 so that it has the right top speed find out with their next graph this is a graph of the drag coefficient CD as a function of Mach number for the seven test flight stars don't be afraid of this coefficient it's simple simply put the influence of speed is removed in the drag equation and what's left as the drag coefficient which should give a straight line at high speed if nothing shady is going on you can see that the first three stars form a straight line but the drag coefficient starts to increase abruptly at the fourth star at around Mach 0.85 this is the effect of wave drag also called transonic drag or compressibility drag at its top speed of mach 0.9 around one third of the f-86 drag is wave drag simply put wave drag comes from the creation of shockwaves when the speed of sound is exceeded so how come shockwaves are created when the aircraft is subsonic and Mach point 85 taking the wing on it as an example it generates lift thanks to the higher speed of the air over the top of the wing compared to the bottom of the wing this means that the air accelerates when he reaches the wing and that's how chakras are created when the aircraft is still subsonic the speed at which the aircraft begins the experience shock waves and wave drag is called the critical Mach number the critical Mach number depends on wing thickness and wing sweep angle among other things the p38 with it's very thick wing has a very low critical Mach number while the mixer 19 achieved significantly higher speeds over the mig-15 with the same engine just by sweeping the links to 45 degrees instead of 35 degrees did gauge in model the wave drag at the f-86 correctly let's find out on the left is the same graph as before and on the right is the same type of graph but with a bunch of other aircraft including the f-86 to compare the graphs you need to look at the beginning of the highlighted f-86 curve between Mach point 85 and Mach point 9 you can see that the curves look very similar good job gauging on the graph on the right you can see how the subsonic planes saw a massive increase in drag as they neared at Mach 1 and so I was known as the sound barrier next let's see if the f-86 can go supersonic in a dive in a dive the f-86 has six tons of mass to add to its two tonnes of thrust to counter drag will that be enough to go supersonic the f-86 barely manages to go supersonic in a dive this dive and another dive with the engine turned off gives us two more stars to add to our collection near Mach 1 the drag coefficient is four times higher than the drag coefficient without wave drag that means that 75% of the drag is wave drag the following applies to every aircraft including SuperSonics don't climb near Mach 1 it's not efficient I think this is my most technical video yet I hope you followed and understood most of my explanations and I hope my graphs made it easier to understand what I was saying even though this video was time-consuming to make I enjoyed making it and learning more about the fascinating subject at the same time thanks for watching
Up Next

1:52
Critical Mach Number Explained: Key Concepts for Aviation Enthusiasts
@flightclubonline
90.6K views•2021-09-15

12:53
21cm Hyperfine Transition in Neutral Hydrogen: Radio Astronomy Basics
@AaronRobertParsons
12.4K views•2011-10-13

32:32
NMR Spin Physics I: Zeeman Effect, Resonance Condition & Larmor Frequency
@nptel-indianinstituteofsci8064
2.3K views•2024-01-17

27:14
Entropy and the Second Law of Thermodynamics Explained
@veritasium
27.5M views•2023-07-01
Related Study Plans & Knowledge Roadmaps
Structured learning paths in Physics
physics
Nuclear Physics (Decay, Fission & Reactors)
01Atomic Structure and the Binding Force
02Radioactive Decay and Half-Life
03Nuclear Fission Mechanics and Chain Reactions
+ 2 more learning modules
12h5 modules
Explore Roadmap
physics
Soft Matter (Polymers, Colloids & Rheology)
01Foundations of Soft Matter & Thermal Forces
02Polymer Physics and Macromolecules
03Colloids, Surfactants, and Self-Assembly
+ 2 more learning modules
38h5 modules
Explore Roadmap
physics
Analytical Mechanics: Lagrangian & Hamiltonian
01Mathematical Foundations: Calculus of Variations
02From Newtonian Mechanics to Constraint Dynamics
03The Principle of Least Action & Lagrangian Mechanics
+ 3 more learning modules
28h6 modules
Explore Roadmap
physics
General Relativity (Spacetime & Cosmology)
01Foundations of Relativity: Special Relativity
02The Geometry of Spacetime: Equivalence Principle & Curvature
03Einstein's Field Equations: The Mathematics of Gravity
+ 2 more learning modules
55h5 modules
Explore Roadmap