![Como Aprender Excel do ZERO [GUIA ATUALIZADO]](https://i.ytimg.com/vi/QQhXangMDNA/maxresdefault.jpg)
















Excel's Forecast Sheet feature enables users to predict future sales or revenue by analyzing historical data patterns, providing a forecast line with upper and lower confidence bounds that indicate the predicted range of values based on past trends, while offering customization options for confidence intervals, seasonality detection, and handling of missing or duplicate data points.
Excel Sales Forecasting: Revenue Projection Tutorial
Added:Basic proficiency in Microsoft Excel, including data entry, creating tables, and navigating worksheets.
Understanding the structure of time-series data, specifically how chronological dates pair with corresponding sales or revenue values.
Fundamental business concepts of revenue, sales volume, and historical performance tracking.
Basic statistical concepts such as historical trends, seasonality, and data variance.
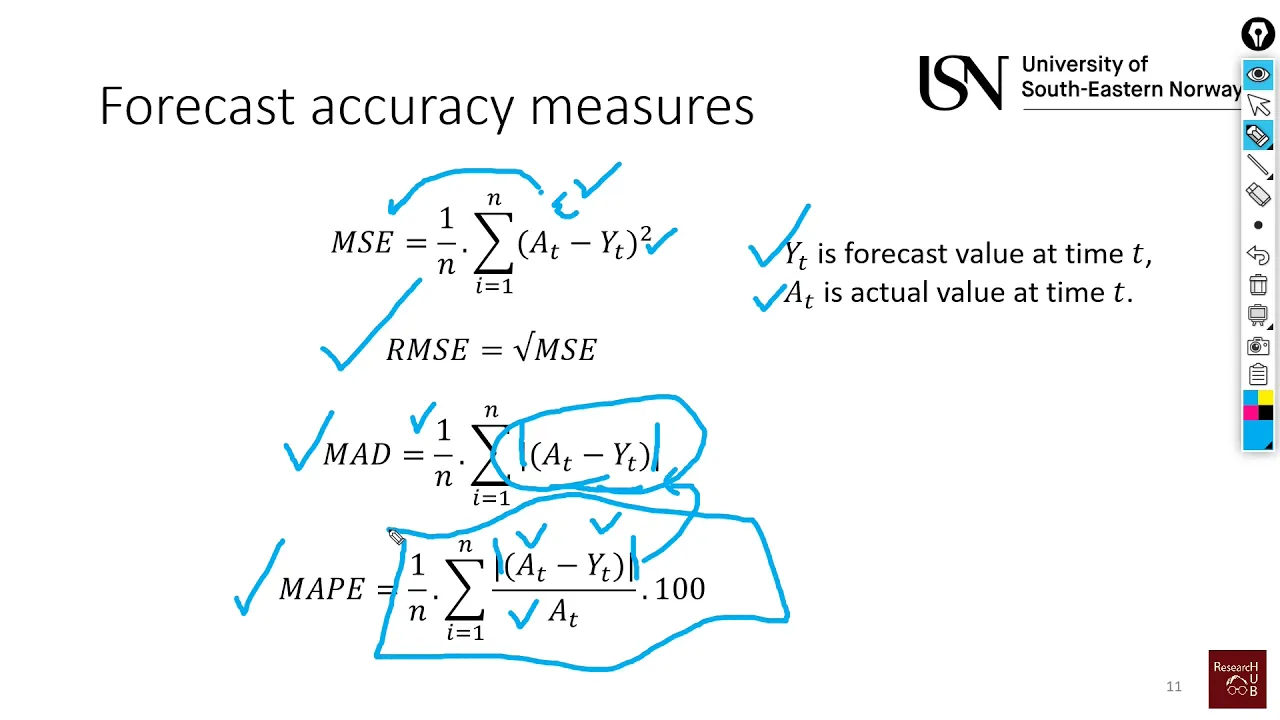
Evaluating forecast accuracy using statistical metrics such as Mean Absolute Percentage Error (MAPE) and Root Mean Squared Error (RMSE).
Advanced regression analysis and exponential smoothing techniques using the Excel Analysis ToolPak.
Scenario planning and sensitivity analysis using Excel tools like Goal Seek, Scenario Manager, and Data Tables.
Integrating sales forecasts into comprehensive financial models, such as pro forma income statements and cash flow projections.
8.6K views66likes9:07Original Release: 2021-03-13
hey everybody this is melissa if you've been here before welcome back if this is your first time welcome and if you haven't done so already i would really appreciate it if you take just a quick moment and click on the subscribe button and that way you'll be the first to know when i upload a new tutorial i'm really excited you're all here so let's go ahead and get started so today i'm going to show you how to use the forecast sheet in excel and what this allows us to do is take say sales data and predict what it might look like into the future based on data from the past so what i have here is i have data that is sales by month going back to january of 2019 and then starting in january of 2021 to december of 2021 it's blank so what i want excel to do is to take this data from 2019 and 2020 and predict what my cells are going to be through 2021. so how we're going to do that is we're going to highlight our month sales and the data that we want to include in the forecasting which is the data that we have entered so from our data tab we want to go over to forecast sheet and this box pops up so as you see it took data from january 2019 and it plugged the numbers in and it gave us a forecast and i'll explain what that means here in just a second you could do a column chart but i think it's more confusing than a line chart so i tend to stick to the line charts when i'm doing any kind of forecasting so what we have here is we have forecast sales which is this line here then we have our lower confidence bound which is this line here and we have our upper confidence bound which is this line here now let me explain what that all means if we go to options here we get more options besides just forecast end our forecast end date we're going to change because if you remember we want to forecast all the way through december of 2021 so we're going to make this 12-1 of 2021 and as you can see it extends it out the reason i'm not using 12 31 of 2021 is because we're doing this by month so if we use 12 1 it'll capture that entire month our forecast start date we want to use the last date within our data set so in this case it is 12 1 of 2020 because that is the last data set that we have here and what that will do is it will then go back as you see and pull everything from the beginning to that date our confidence interval is set at 95 and that's what it defaults to i generally leave this at 95 because what this does between the lower bound and the upper bound and then the forecast 95 of our sales it predicts will fall in to this area which is what about 5300 to about maybe 32 300 so that's what this confidence interval is the prediction of where our sales will fall over the next year our seasonality i let it detect it automatically there may be some times that it can't and you may have to set it but what this means is if you're doing like we are a yearly forecast it's going to detect it based on seeing january through december january through december and it's going to automatically set this to 12 because we're doing it each month for the year our include forecast statistics unless you're going to be doing some heavy duty statistical analysis you don't need to check this it's going to show you smoothing coefficients like alpha beta gamma it's going to show you air matrix like m-a-s-e r-m-s-e and things like that and that's not anything with regular forecasting you're going to be doing so i would recommend just leaving that unchecked our timeline range is actually what we have highlighted in column a our values range is what we highlighted in column b now fill missing points using so excel defaults to interpolation and what that does is it tells it how to handle missing points so let's just say we've got january through december of 2019 but we don't have january of 2020 and we skip over to february of 2020.
so what interpolation tells excel to do is say january's missing and we go from december of 2019 to february 2020.
so it's going to tell excel to do a weighted average for whatever's before it so say november december 2019 and whatever's after it february march or whatever and it's going to populate that now we do have the ability to tell it zeros and then it won't take those into account at all but i tend to let it do the interpolation now aggregate duplicates using and i had to say that slow because i cannot say it fast and what that does is if we have data that has the same date and time then excel will average those so let's say we don't have months let's say that we have products here and let's just say we have fruit but we have the dates are you know you have apples oranges and watermelon and they all have the same date of uh january 1st okay if we just want to do the sales based on that day and do a forecast it's going to average them so i hope that makes sense for that so now that we have filled all of this in and we kind of understand what this means let's click on create i'm going to blow this up a little bit okay so put our chart over here and i'm going to move this up just a little and as you can see on december 20th which is where we told it to start our forecast it does 4 000 straight across the board so now we have three columns we have forecast sales lower confidence bounds and upper confidence bound which is basically this spelled out so it shows you in january it believes your sales are going to be around 4085 however they could be between 33 14 and 48 56 that's your 95 percent confidence interval february 41 13 48 89.
now if you're going into a meeting you may just want to take the chart or you may want to show this that'll be up to you but some of the things that we can do is chart style we can change it if we want to change that we can change the color of the trend lines and we can filter it let's just say that we want to pull off the lower and upper confidence level until it apply and then it's just going to show the the trend line or the forecast line going up let's put that back let's say that we want to just show to june of 2021 and then it's going to pull everything down to show just june now let me caution you the one thing that you cannot do when you're working with a forecast sheet is you cannot go back and change it i mean you cannot go back over here change this and this automatically update you will have to recreate it and trust me that's normal before i did this tutorial i had to recreate this one twice so that's completely normal to forget something but just keep that in mind it's not real hard to do but that is one thing that i wish microsoft would change is that we could just click a few buttons and update our forecast sheet but for now that's not how it works and that's how you can forecast future data or future sales using forecast sheet in excel if you found this video helpful please be sure to like it subscribe to my channel and get notified and i'll be back tomorrow with another tutorial thanks so much for watching
Up Next

43:13
Goods-to-Person Picking Systems for Modern Warehouse Operations
@alpinesupplychainsolutions8500
135 views•2024-10-16

12:54
Triumph of Orthodoxy Icon: Byzantine Art & History Explained
@BenCallan
2.1K views•2024-08-06

9:49
FastAPI vs Flask vs Django: Choosing the Right Python Web Framework
@TechWithTim
302.5K views•2024-05-26

1:42
Game of Thrones Opening Credits: A Cinematic Analysis
@gameofthrones
46.3M views•2011-04-18
Related Study Plans & Knowledge Roadmaps
Structured learning paths in General & Interdisciplinary Studies
general-studies
Elevator Engineering: History, Physics & Cities
01From Hoists to Safety Brakes: The Dawn of Vertical Lift
02Hydraulic vs. Traction: The Engineering Physics of Elevators
03Modern Speed, Safety, and Algorithms
+ 2 more learning modules
12h5 modules
Explore Roadmap
general-studies
Rubber: Material Science, History & Geopolitics
01Origins of Natural Rubber & Mesoamerican History
02The Chemistry of Natural Rubber & Vulcanization
03The Geopolitics of the Rubber Boom & Colonization
+ 2 more learning modules
12h5 modules
Explore Roadmap
general-studies
Containerization: Evolution, Logistics & Trade
01Ancient Trade & Bulk Cargo: Amphorae to Barrels
02The Industrial Revolution & Cardboard Packaging
03The Containerization Revolution: Malcom McLean
+ 2 more learning modules
12h5 modules
Explore Roadmap
general-studies
Textile Tech: Evolution, Labor & Global Impact
01Pre-Industrial Textiles: Handloom & Cottage Industry
02Mechanization: The Spinning Jenny to the Power Loom
03The Factory System & Global Labor Transformation
+ 2 more learning modules
10h5 modules
Explore Roadmap