
















![Demographic & Epidemiological Transition Model [AP Human Geography Unit 2 Topic 5] (2.5)](https://i.ytimg.com/vi/5hWRFwQ_pE4/maxresdefault.jpg)












The Demographic Transition Model (DTM) is a framework that describes how countries' birth rates, death rates, and natural increase rates change as they develop economically, progressing through four main stages: Stage 1 (high birth and death rates with low growth), Stage 2 (death rate drops rapidly while birth rate stays high causing population boom), Stage 3 (both rates decline leading to slow growth), and Stage 4 (birth rate matches death rate achieving zero population growth). Population pyramids are graphic tools that display age and gender distribution, helping analysts determine a country's current population structure and developmental stage by examining the shape of the pyramid—wide bases indicate high birth rates, narrow tops suggest high death rates or aging populations, and overall shape reveals whether a country is experiencing growth or decline.
Demographic Transition Model & Population Pyramids | Geography
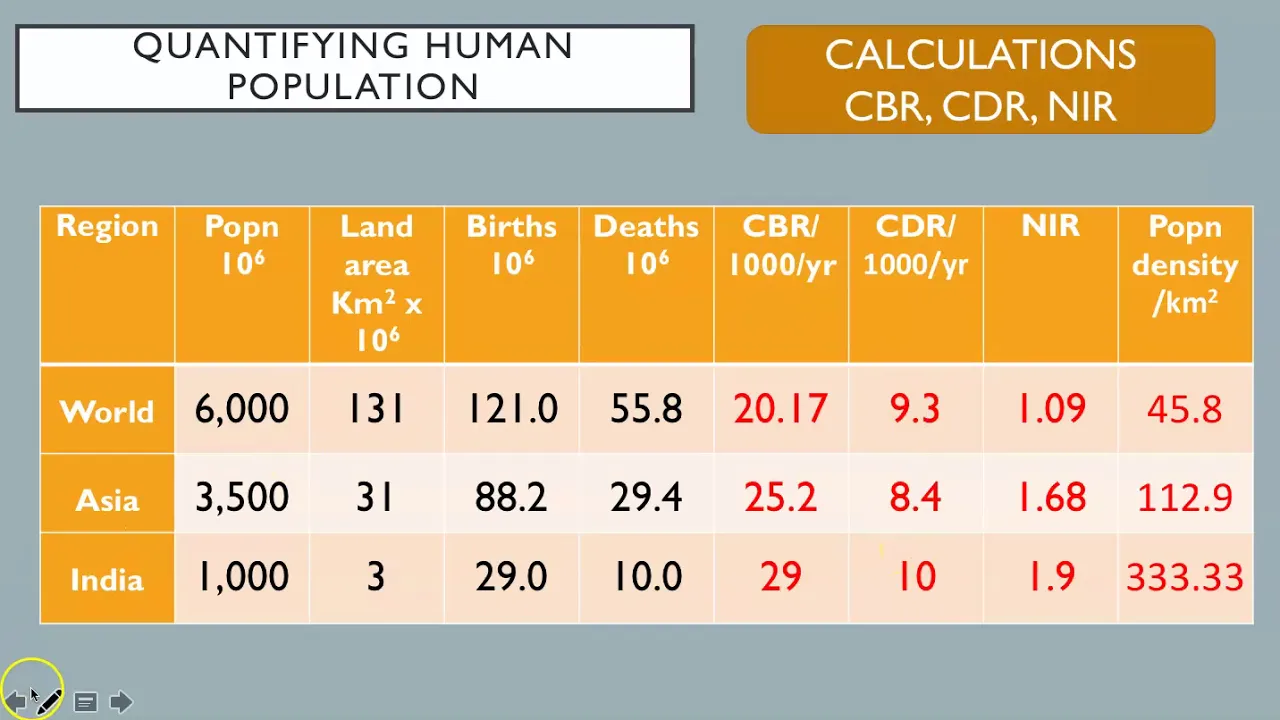
Added:hello in the video you're about to watch we're going to look at the relationship between population Trends and development we're also going to look at two graphic devices that geographers can use to analyze a population a rapidly growing population can have a profound impact on a country it might lead to starvation economic depression or even political instability as the government struggles to handle all the new Mals it has to feed on the other hand a rapidly shrinking population is a problem as well population will begin to age and lack the youth needed to continue to support the country whether a country's population is growing or shrinking has a huge effect on the country and its development so if population has such a big effect can we predict changes in population growth in order to prepare for them all countries tend to experience similar changes to their population over time and as they develop while not all countries follow the pattern exactly the demographic transition model model is a useful tool for analyzing a country's population and development the demographic transition model shows the interaction between three variables over time birth rate death rate and the rate of natural increase birth rate is the number of births per 1,000 people a country has per year it is not a percentage and it is not a total number of births if a country's birth rate is 66 that means for every 1,000 people in a country 66 babies are born in a particular year death rate is a similar statistic it is the number of deaths per 1,000 people in a year when you combine birth rate and death rate you get the country's rate of natural increase if a country has a birth rate of 66 and a death rate of 25 then its rate of natural increase would be 41 we can convert that to a percentage by moving the decimal place to the left by one that would give the country a natural increased percentage of 4.1% whoa that's a lot of growth to compare the world's current rate of natural increase is approximately 1.2% this is lower than our rate of natural increase in the mid 1900s when it reached 2.2% in 1963 so now that you know what it's measuring let's look at the DTM the demographic transition splits societies into four stages as well as a possible fifth stage in the first stage of the DTM we see the kind of society that has typified much of human history going back thousands of years this Society has a very high birth rate and a very high death rate while the birth and death rates vary the end result is a rate of natural increase that is very low as the two tend to cancel each other out a moderate amount of growth might take place in stage one but overall natural increase is low when a country moves into stage two of the DTM it experiences an extremely rapid drop in the death rate this could be due to improvements in Sanitation ation health care or food and water supplies the birth rate remains High and the end result is a huge population boom as the country continues to develop it moves into stage three during stage three the birth rate begins to decline along with the death rate the result is a slow growth rate overall people's standard of living tends to increase they live longer and children are no longer seen as the necessity finally when a country reaches the highest levels of development it enters stage four of the demographic transition model birth rate drops to match the death rate the rate of natural increase approaches zero which is referred to quite obviously as zero population growth there are no longer enough children born to replace adults as they die and a country's population may actually begin to shrink this shrinking population stage is sometimes referred to as stage five on the DTM few if any countries are actually in stage five however so for now it is merely a possible stage instead of one that we've observed in history the DTM is in some ways a cycle the rate of natural increase in stage one looks a lot like the rate of natural increase in stage 4 however the birth rate and death rate in stage four is much lower and the overall population of the country in stage 4 is higher than it was in stage one so how can we tell what stage of the the demographic transition model a country is in one very useful tool for analyzing a country's population is a population pyramid population pyramid is a graphic device that demonstrates the structure of a country's population it does so by displaying age and gender groups on a two-sided bar graph one side of the bar graph shows female population the other shows male population each bar displays an age group starting with the youngest at the bottom some population pyramids show this number as a percentage others show total population at each age group either way the shape of the population pyramid shows us a lot about that country's population to analyze a population pyramid always start at the bottom if the bottom of the pyramid is wider than everything else then the country has a very high birth rate if the size of each bar shrinks rapidly and ends in a very sharp point then the country also has a very high death rate if on the other hand the decrease is slight or the bottom is actually smaller than the middle then the country has a lower birth rate and its birth rate might even be lower than its death rate as you look up to the older ages on the population pyramid you can also tell relatively how long people live the thicker the top of the pyramid the higher the life expectancy so to wrap it up the amount of population growth the country has really affects conditions for people living there two tools for predicting and analyzing country's population growth are the demographic transition model and population pyramids as you study population geography around the world these two tools will be handy population pyramids tell us about a country's current and historic population and the DTM allows us to use those population pyramids to figure out how developed the country might be
Up Next

The Silver Tsunami: America's Aging Workforce Explained
@lifenoggin
337.8K views•2018-11-15

Triumph of Orthodoxy Icon: Byzantine Art & History Explained
@BenCallan
2.1K views•2024-08-06

FastAPI vs Flask vs Django: Choosing the Right Python Web Framework
@TechWithTim
302.5K views•2024-05-26

Game of Thrones Opening Credits: A Cinematic Analysis
@gameofthrones
46.3M views•2011-04-18
Related Study Plans & Knowledge Roadmaps
Structured learning paths in General & Interdisciplinary Studies