

















Probability represents the area under a fixed distribution curve for a given range of outcomes, calculated as P(data | distribution), while likelihood represents the y-axis value at a specific data point with distributions that can be moved or modified, calculated as L(distribution | data); in probability, the distribution parameters are fixed and we calculate areas for different data ranges, whereas in likelihood, the observed data is fixed and we evaluate how well different distributions explain that data.
Probability vs Likelihood: Key Differences in Statistics
Added:Basic probability theory, including the concept of a random variable and the scale of probability (from 0 to 1).
An understanding of probability distributions (such as the Normal or Binomial distribution) and how parameters like mean and standard deviation shape them.
The conceptual distinction between data (observed outcomes) and parameters (underlying constants of a population model).
Familiarity with conditional probability notation, specifically understanding how to interpret expression models like P(X | theta).
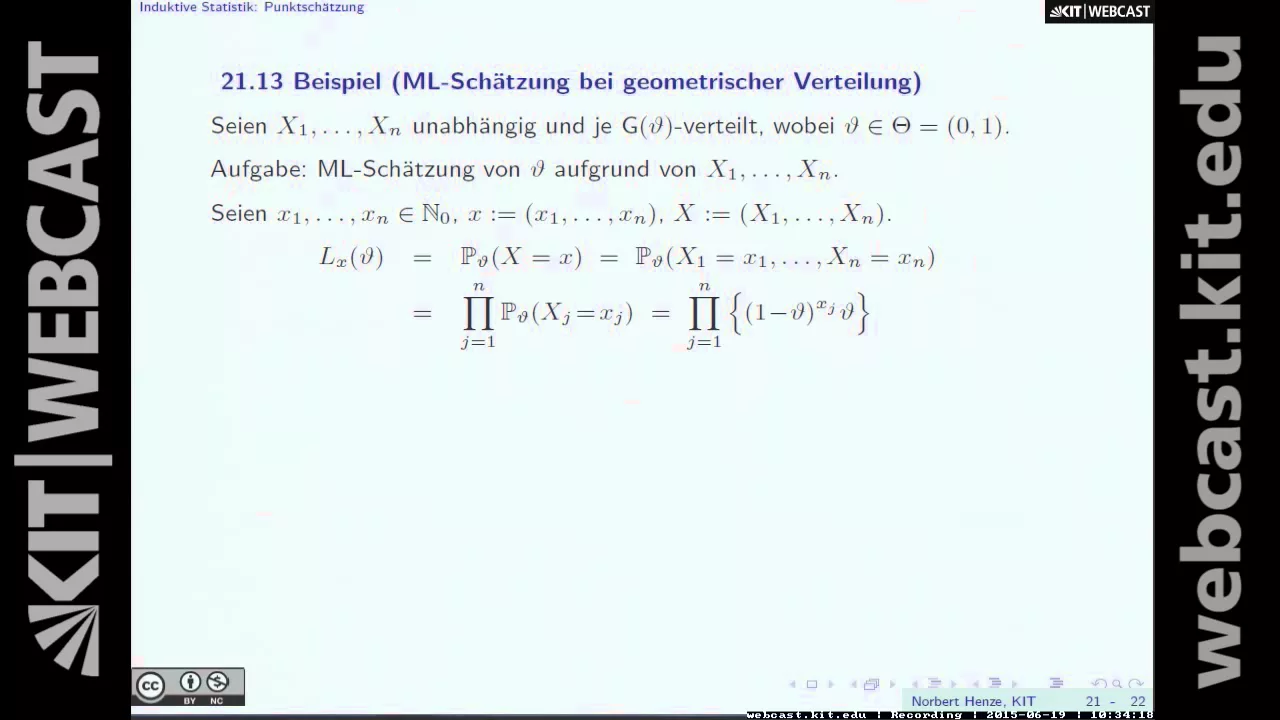
Maximum Likelihood Estimation (MLE), learning how to find the parameter values that maximize the likelihood of observing the collected data.
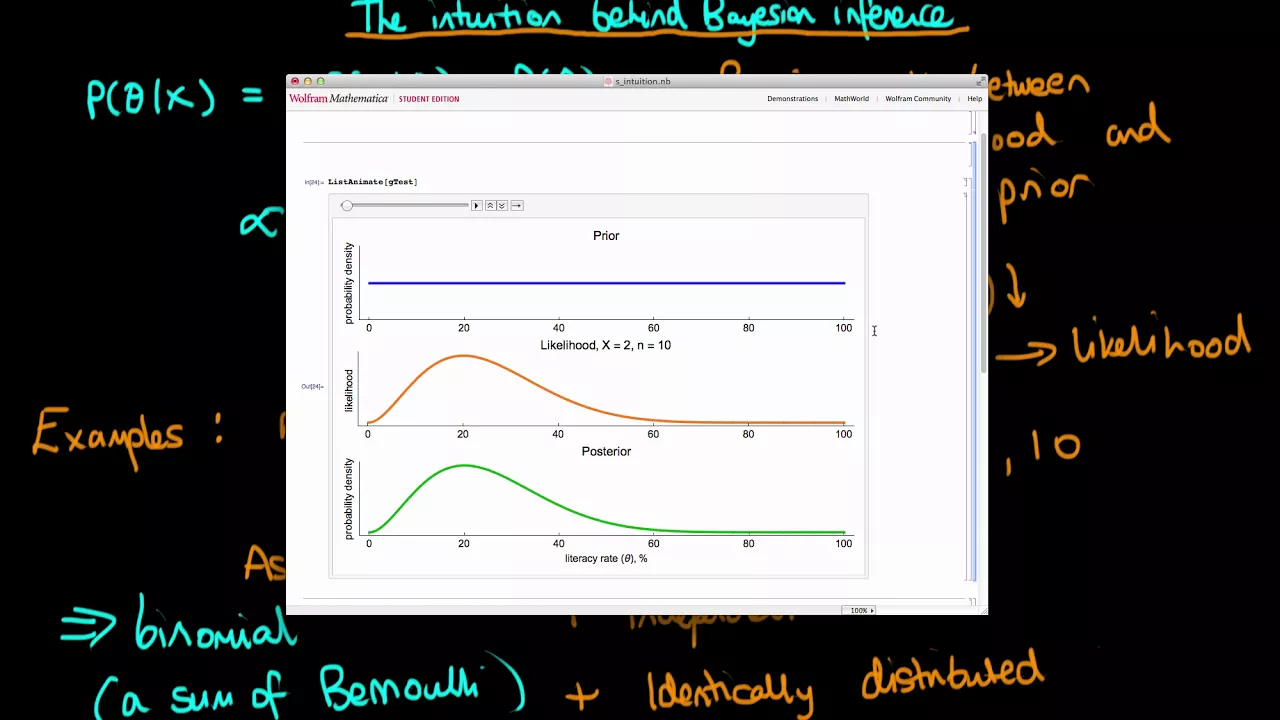
Bayesian Inference, exploring how likelihood functions are combined with prior probabilities to determine posterior probabilities.
Likelihood Ratio Tests, which are used to compare the goodness-of-fit of two competing statistical models.
Log-likelihood functions, understanding why the logarithm of the likelihood is practically used in mathematical optimization and machine learning.
1.5M views41.7Klikes5:01Original Release: 2018-03-09
stet quest makes me feel so happy so very very very very very very very happy stat quest hello I'm Josh Dahmer and welcome to stat quest today we're gonna be talking about the difference between probability and likelihood these are two closely related concepts that are very easy to get confused even I mix them up from time to time so enough of this jibber-jabber let's get down to it for me the easiest way to understand the difference between probability and likelihood is to just see it in pictures so let's start by looking at probability with respect to a normal distribution keeping in mind that this concept applies to all continuous distributions in this case let's imagine that this is a distribution of Mouse weights it has a mean of 32 grams and a standard deviation of 2.5 on the low end we have 24 grams and on the high end we have 40 grams the probability that we will weigh a randomly selected Mouse between 32 and 34 grams is the area under the curve between 32 and 34 grams in this case the area under the curve equals zero point 2 9 meaning there's a 29% chance a randomly selected Mouse will weigh between 32 and 34 grams mathematically we say this with the following notation the probability of weighing a mouse between 32 and 34 grams given the mean of the distribution is 32 and the standard deviation is 2.5 and all this equals zero point two nine this is the part of the equation we change if we are interested in different Mouse weights for example if we wanted to know the probability of a mouse weighing more than 34 grams we would change the bit on the left side to reflect this the right side which defines the shape and location of the distribution stays the same so when we talk about probabilities we are talking about a distribution that's described by the right side of this equation and the area under the curve that is described on the left side using the same distribution we can change the left side to get a new probability BAM now that we have probability worked out let's talk about likelihood to talk about likelihood you assume that you have already weighed your mouse or mice if you have weighed more than one so here's our mouse it weighs 34 grams the likelihood of weighing a 34 gram Mouse is this point on the curve and that value is 0.12 mathematically we say this with the following notation the likelihood of a distribution with mean equals 32 and the standard deviation equals 2.5 given we weighed a 34 gram Mouse and all that equals 0.12 if we shifted the distribution over so that the mean was 34 grams the new likelihood would be zero point two one so with likelihoods the measurements on the right side are fixed and we modify the shape and location of the distribution with the left side double bam in summary probabilities are the areas under a fixed distribution and mathematically we have the probability of data given a distribution likelihoods are the y-axis values for fixed data points with distributions that can be moved mathematically this is written as the likelihood of a distribution given data if you want to see the actual equations check out the stat quest that derives the maximum likelihood estimator for the exponential distribution hooray we've made it to the end of another exciting stat quest if you like this stat quest and want to see more of them please subscribe and if you want to support stat quest well consider buying one or two of my original songs the link to my Bandcamp page is down below in the comments all right until next time quest arm
Up Next
16:26
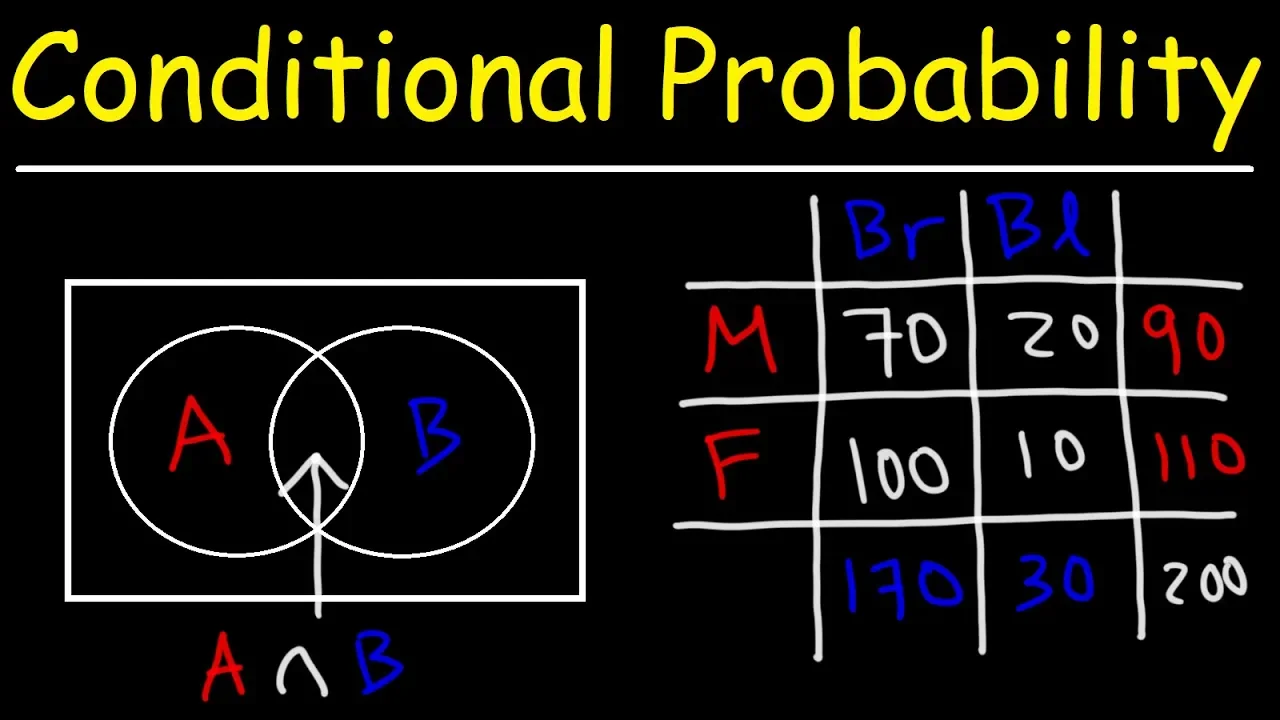
Conditional Probability Using Venn Diagrams & Contingency Tables
@TheOrganicChemistryTutor
1.4M views•2019-03-25

4:43
Elliptic Curve Cryptography Explained: ECC, ECDSA, ECDH
@PracticalNetworking
28.5K views•2024-10-21

16:14
Mutual Information Explained: A Clear Step-by-Step Guide
@statquest
164.6K views•2023-02-06

6:00
The Mathematical Impossibility of Accurate World Maps
@Vox
23.3M views•2016-12-02
Related Study Plans & Knowledge Roadmaps
Structured learning paths in Mathematics
mathematics
Tensor Calculus: Vectors to Riemann Curvature
01Mathematical Foundations: Linear Algebra & Calculus
02Covectors, Dual Spaces, and Tensor Basics
03The Metric Tensor and Index Gymnastics
+ 2 more learning modules
40h5 modules
Explore Roadmap
mathematics
Gödel's Incompleteness: Logic, Proofs & Limits
01Introduction to Formal Systems & Hilbert's Dream
02Set Theory, Cardinality, and Cantor's Diagonal Argument
03Arithmetization and Gödel Numbering
+ 2 more learning modules
14h5 modules
Explore Roadmap
mathematics
Galois Theory: Fields, Groups & Solvability
01Foundations of Abstract Algebra: Groups & Fields
02Polynomials & Field Extensions
03Splitting Fields & Symmetries
+ 2 more learning modules
24h5 modules
Explore Roadmap
mathematics
Non-Euclidean Geometry: Models & Geodesics
01Euclid's Fifth Postulate and the Birth of New Geometries
02Hyperbolic Space and the Poincaré Disk Model
03Geodesics: Defining Straight Lines in Curved Spaces
+ 2 more learning modules
15h5 modules
Explore Roadmap