

















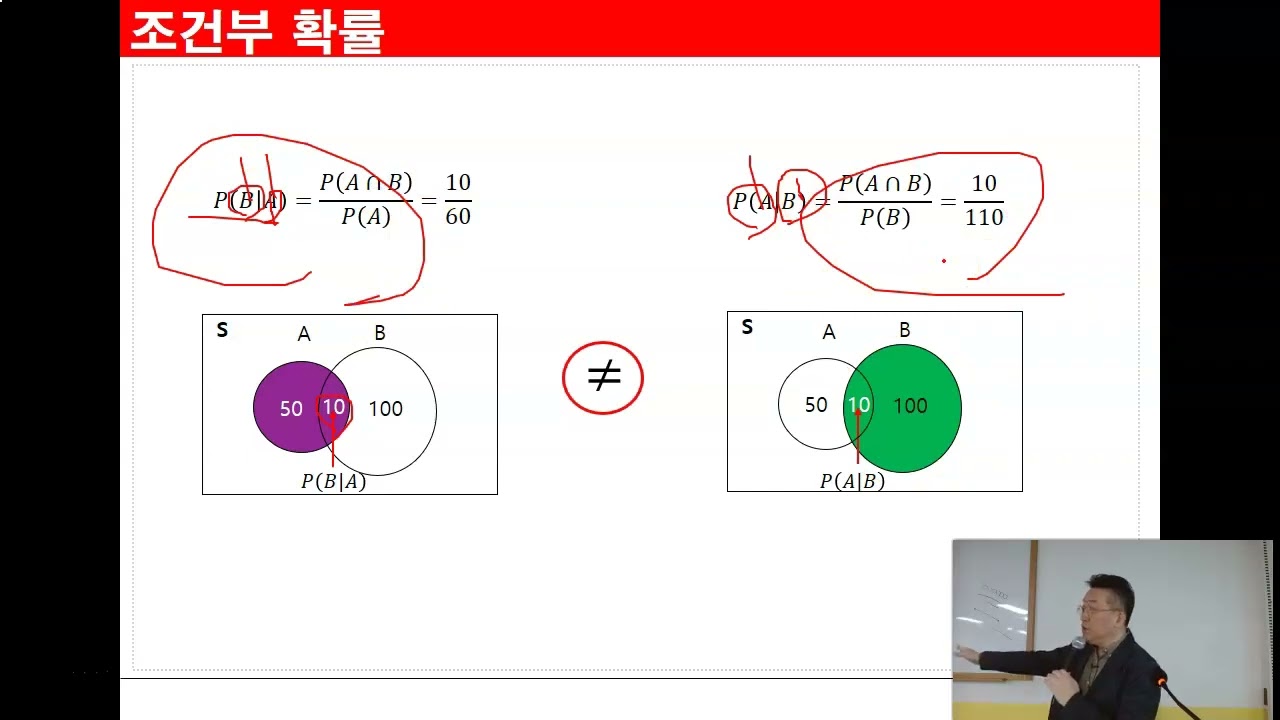



Conditional probability calculates the likelihood of an event occurring given that another event has already occurred, using the formula P(A|B) = P(A ∩ B) / P(B), where you divide the probability of both events happening together by the probability of the given event; this can be visualized using Venn diagrams to see the overlap between events or contingency tables to organize categorical data and calculate probabilities by focusing on relevant rows or columns.
Conditional Probability Using Venn Diagrams & Contingency Tables
Added:Basic probability concepts, including sample spaces, outcomes, and how to calculate the probability of a single event.
Fundamentals of set theory, specifically the concepts of union (OR), intersection (AND), and complement (NOT).
How to construct and interpret basic Venn diagrams representing overlapping datasets.
How to read and interpret two-way contingency tables (crosstabulations) representing categorical frequencies.
Bayes' Theorem, to understand how to systematically update the probability of a hypothesis as new evidence or information becomes available.
The mathematical definition and testing of independent versus dependent events using conditional probabilities.
The General Multiplication Rule of probability and how to represent multi-stage conditional events using probability tree diagrams.
Real-world applications of conditional probability, such as calculating sensitivity, specificity, and predictive values in medical diagnostic testing.
1.4M views20.4Klikes16:26Original Release: 2019-03-25
in this lesson we're going to focus on something called conditional probability perhaps you've seen something like this P of a with a bar next to it and then a b what does this mean this represents the probability that event a will occur given that event B has already occurred so let's say we have a six-sided die with a sample space of the numbers one all the way to six and let's say that event a is any time we get an even number by Rolling or let's say an odd number when we roll the die so 1 3 and five and event B let's say that corresponds to the numbers three 4 and 5 so what is the probability that event a will occur given that B has already occurred before we get into the formula let's talk about a quick and simple way of getting the answer ask yourself this question how much of a is in B the elements of a that is in b is three and five so there's two elements of a that is in the three elements of B so 2/3 of B is basically from a so that's the probability of event a occurring given that event B has already occurred is 2 over 3 that's a quick and simple way to do conditional probability but now this is a Formula that you need to know to calculate this conditional probability is the probability of event a and event B current divided by the probability that event B will occur so what is the probability of getting event B B has three outcomes that lead to it out of a total of six outcomes in a sample space so when you roll a six to die there's six numbers you can get and B is half of those numbers so the probability that event B will occur is 3 out of six now what about the probability of events A and B occurring well let's Write the sample space for A and B so this is the intersection of A and B and we know that the numbers three and five corresponds to A and B so event A and B will occur if we get two numbers out of the six potential numbers that we could get so the probability of A and B occurring is 2 over 6 now to simplify this complex fraction let's multiply the top and bottom by six so that the numberers six will cancel and so we're left with two over three which is the same as what we see here so that's a simple way in which you can calculate the conditional probability of an event occurring but now let's look at some more example problems there are 500 students in a certain School 150 students are enrolled in an algebra course and 80 students are enrolled in a chemistry course there are 30 students who are taken both algebra and chemistry if a student is chosen at random what is the probability that the student is taking algebra before we begin let's draw a VIN diagram so we're going to draw two circles with the circles intersecting each other let's put a for algebra and C for chemistry istry so there's 150 students taking algebra and there's 80 students taken chemistry there's 30 taken both and in this school there's a total of 500 students so what is the probability that the student is taking algebra so there's 50 students take an algebra out of a total of 500 students so this becomes 15 over 50 15 is 5 * 3 50 is 5 * 10 and so the probability of selecting an algebra student is 3 over 10 which is3 or 30% now what about Part B what is the probability that the student is taking chemistry given that the student is also taking algebra so this is a conditional probability problem so we're want to find the probability of getting C given that the student is taking algebra or given a so how much of C is in a think of it that way we have 30 of C that is in a so it's going to be 30 out of 150 now for those of you who prefer to use the formula this is going to be the probability of getting c and a divided by the probability of getting a so the probability of getting C na a the probability that a student is taking algebra and chemistry is 30 out of a total of 500 students the probability of a student taken algebra that is the probability of a is 150 out of 500 which we calculated earlier and so multiplying the top and the Bottom by 500 you could see we're going to get the same answer it's going to be 30 over 150 so let's simplify 30 over 150 30 is 30 * 1 150 is 30 * 5 so the probability is going to be 1 over 5 which is 1 iD 5 is.2 so there's a 20% chance of selecting a student who is taking chemistry given that they're taking algebra now let's talk about what this means out of all of the 150 algebra students in this school 20% of them is taken chemistry 20% of 150 is 30 now let's move on to the last part of this problem part C what is the probability that the student is taking algebra given that the student is also taking chemistry so going back to Part B we said the probability of getting C given a was 1 over 5 now in this problem we're looking for something different we're looking for the probability of a given C and these are not the same so what is the probability of selecting a student student who is taken algebra given that that student is taking chemistry as well so how much of a is in C notice that we have 30 of a that is in basically 80 of C so this is going to be 30 over 80 which we can reduce that to 3 over 8 so out of the 80 students who are taking chemistry 30 of them is taking algebra so the probability of selecting a student that has taken algebra given that they're taking chemistry is three out of eight and so that's a simple way in which you can do conditional probability calculations let's move on to the next question there are 200 birds in a zoo 70 birds are male with brown eyes and 100 birds are female with brown eyes 20 of the birds are male with blue eyes and 10 birds are female with blue eyes construct a contingency table so let's begin by doing that first so on the left we're going to have the gender so it's either male or female and at the top we're going to put the color of the eyes either blue eyes or brown eyes let me pick a different color for this and at the sides we're going to put the totals so 70 birds are a male with brown eyes so let's put a 70 here 100 birds are female with brown eyes 20 birds are male with blue eyes 10 birds are female with blue eyes so what's the total number of males 70 + 20 is 90 now the total number of female Birds is going to be 100 + 10 which is 110 so adding these two will give us a total of 200 birds in this Zoom now let's add these numbers so the total number of birds with brown eyes is 170 the total number of birds with blue eyes is going to be 30 and we can see that 170 + 30 is 200 so now that we filled out the contingency table let's answer some questions if a bird is selected at random what is the probability that the bird is a female so let's start with that so what's the probability of getting F so there's 110 birds that are female out of a total of 200 birds in the zoo so the probability is going to be 110 over 200 if we divide both numbers numbers by 10 by getting rid of a zero the probability is 11/ 20 which is 55 or a 55% chance of selecting a female bird now what about selecting a bird that is a male with brown eyes so this is not a conditional probability question we're looking for a bird with two characteristics it has to be a male and it has to have brown eyes so there's 70 birds that are both male and with brown eyes out of a total of 200 birds so the probability is going to be 7 out of 20 which is35 which corresponds to a 35% chance of selecting such a bird now let's move on to part C so what is the probability that the bird is a female given that it has brown eyes so now we're dealing with a conditional probability question so what is the probability that we're going to get F given BR so to do it the easy way think about this question how much of f is n BR so out of all the birds with brown eyes how much is female so there's 170 birds with brown eyes 100 of those birds are female so it's going to be 100 out of 170 which reduces to 10 over 17 now if we divide 10 by 17 that's going to be 588 so let's talk about what this means that means there's a 58.8% chance of selecting a bird that is a female given that the bird has brown eyes so out of all of the 170 birds with brown eyes 58.8% of those birds are female so that's what that means now let's move on to Part D what is the probability that the bird is a male given that it has blue eyes so what's the probability of M given BL so how much of M is in BL there's 20 of M and 30 of B so there's a total of 30 birds with blue eyes 20 of which are male so the probability of selecting a male bird given that it has blue eyes is 2 over 3 so as you can see it's really not that difficult when calculating conditional probability if you understand the principles behind it now before we answer the last question I just want to clear away a few things because this page is getting crowded now so the last part what is the probability that the bird is a creature with blue eyes given that it's a female so what's the probability of BL given F so how much of BL is in F so there is 110 female Birds 10 of which contain blue eyes so the probability is going to be 1 over 11 there's out of all the 110 female Birds 10 of the have blue eyes and so this is it that's all you got to do it's 10 over 110 which reduces to 1 11 and let's turn that into a decimal value so that's approximately 091 if you round it so there's a a 99.1% chance of selecting a bird with blue eyes given that it's a female
Up Next
13:59
Bayes' Theorem Clearly Explained: Derivation and Applications
@statquest
477.7K views•2021-08-16

4:43
Elliptic Curve Cryptography Explained: ECC, ECDSA, ECDH
@PracticalNetworking
28.5K views•2024-10-21
12:11
Simpson's Rule & Numerical Integration | Calculus Tutorial
@TheOrganicChemistryTutor
812.9K views•2018-03-13

6:00
The Mathematical Impossibility of Accurate World Maps
@Vox
23.3M views•2016-12-02
Related Study Plans & Knowledge Roadmaps
Structured learning paths in Mathematics
mathematics
Tensor Calculus: Vectors to Riemann Curvature
01Mathematical Foundations: Linear Algebra & Calculus
02Covectors, Dual Spaces, and Tensor Basics
03The Metric Tensor and Index Gymnastics
+ 2 more learning modules
40h5 modules
Explore Roadmap
mathematics
Gödel's Incompleteness: Logic, Proofs & Limits
01Introduction to Formal Systems & Hilbert's Dream
02Set Theory, Cardinality, and Cantor's Diagonal Argument
03Arithmetization and Gödel Numbering
+ 2 more learning modules
14h5 modules
Explore Roadmap
mathematics
Galois Theory: Fields, Groups & Solvability
01Foundations of Abstract Algebra: Groups & Fields
02Polynomials & Field Extensions
03Splitting Fields & Symmetries
+ 2 more learning modules
24h5 modules
Explore Roadmap
mathematics
Non-Euclidean Geometry: Models & Geodesics
01Euclid's Fifth Postulate and the Birth of New Geometries
02Hyperbolic Space and the Poincaré Disk Model
03Geodesics: Defining Straight Lines in Curved Spaces
+ 2 more learning modules
15h5 modules
Explore Roadmap