














This video demonstrates how to design and build a low-cost spectrometer using 3D printing and OpenSCAD, a free open-source computer drafting program. The spectrometer uses four essential optical elements: a concave mirror for focusing light, an optical slit for light entry, a collimating mirror, and a diffraction grating. The design process involves calculating precise optical geometry using OpenSCAD, generating STL files for 3D printing, and assembling components including a CCD detector, fiber optic connector, and electronic hardware with a Teensy 4.0 microcontroller. The system requires calibration for both wavelength (using known emission lines from a compact fluorescent lamp) and intensity (using reference standards), with data collected at 1 MHz. This approach makes spectrometry accessible for science education by reducing costs through open-source design and 3D printing.
Open-Source DIY Spectrometer Design and Build | Educational Science Tools
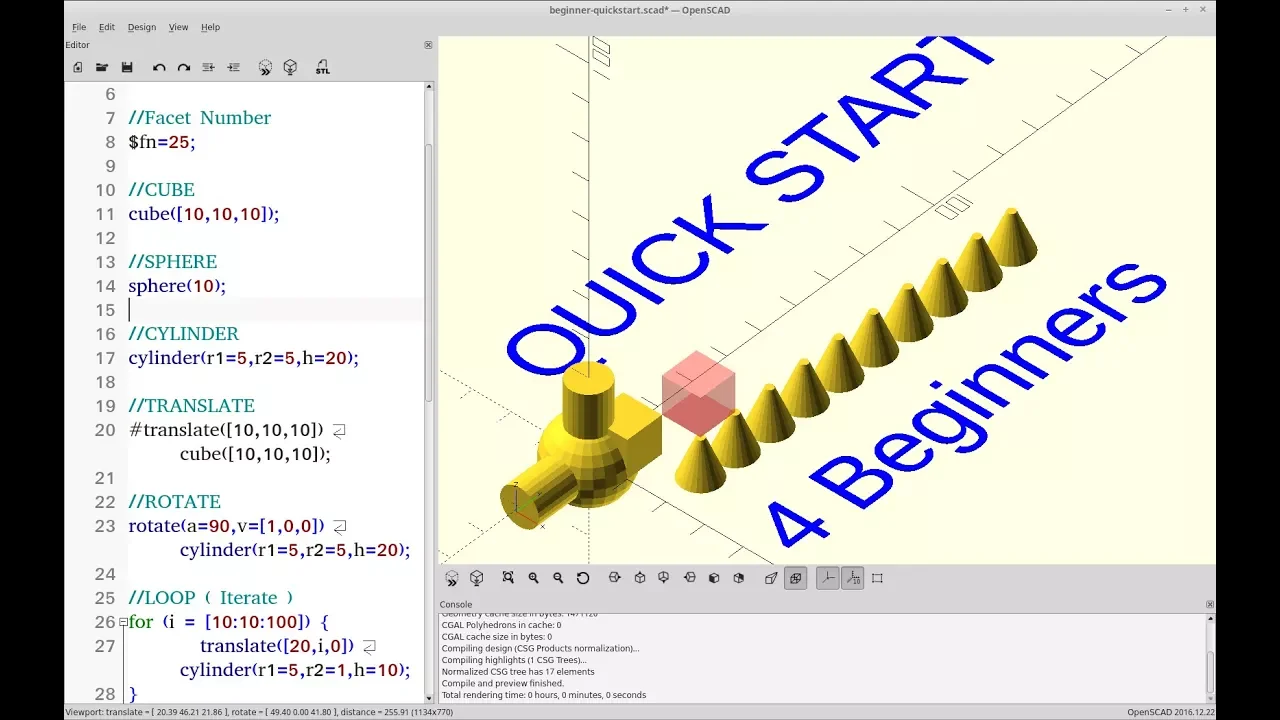
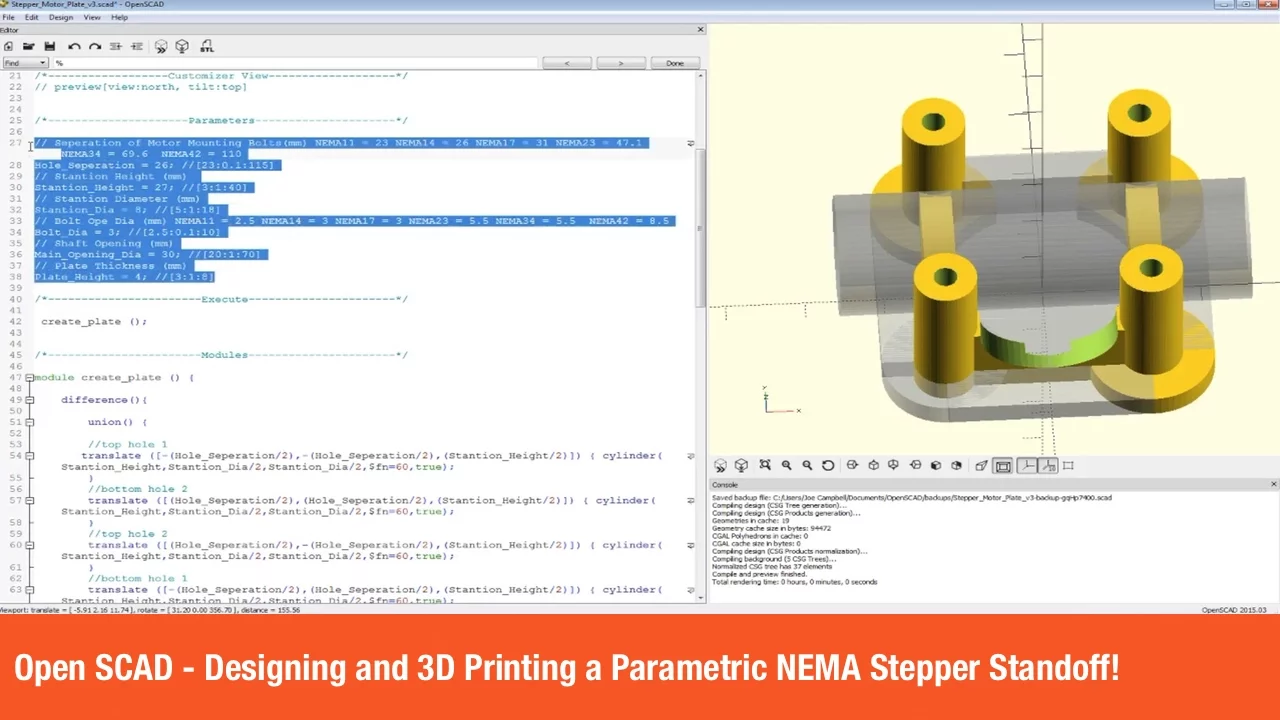
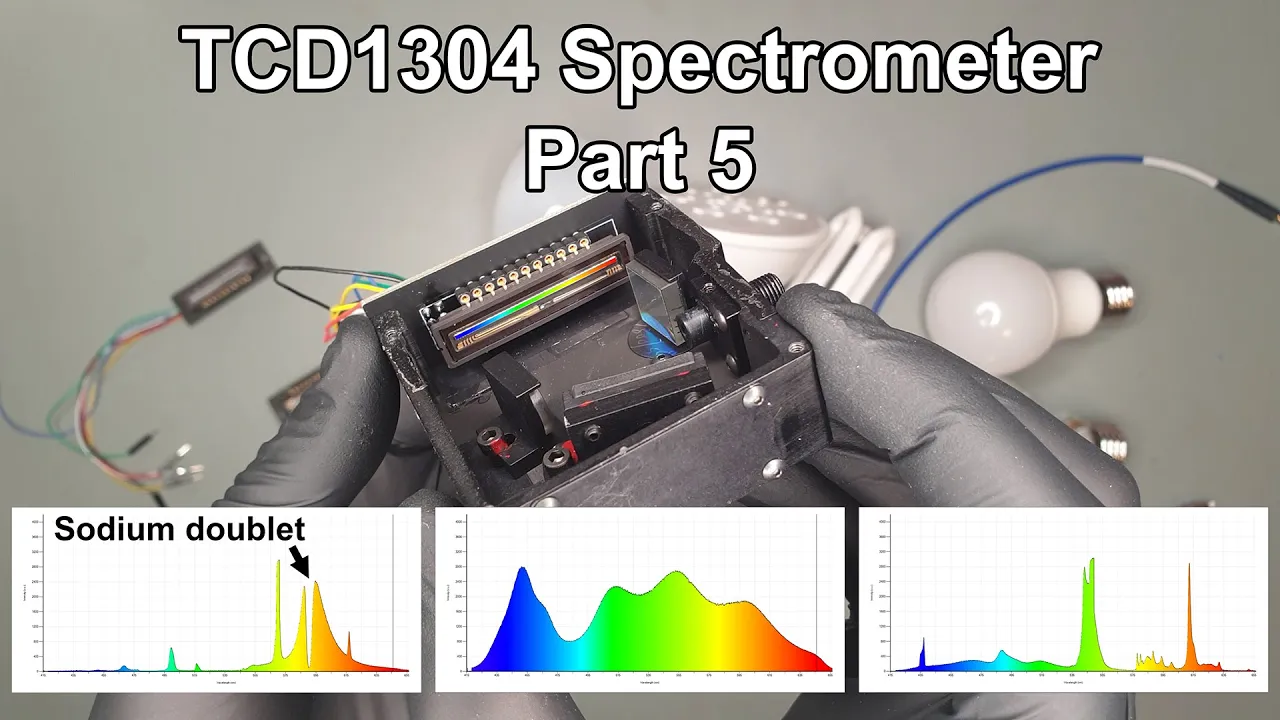
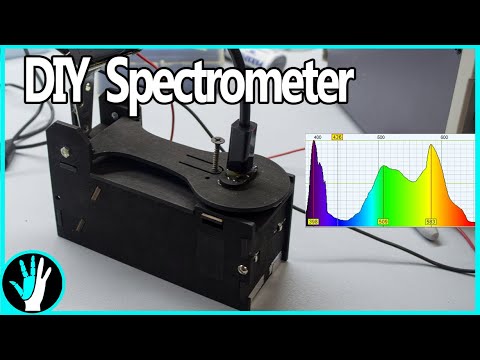
Added:okay people um welcome to my talk my name is jack summers and i am a uh i run this this 501c3 smoky mountain scientific today i'm going to tell you about work that we've done for our spectrometry project uh let's see we are 501c3 our mission is to develop and manufacture market open source instruments for science education and we have a number of instruments today i'm talking about the spectrometer let's see here how does that work oh there we go all right so first thing to talk about is optical elements right so up on uh in the center of the screen here we have a that that's a uh conv concave mirror that is used to focus light down here this is a an optical slit that lets light into our spectrometer this is a collimating mirror and a diffraction grating all right so these are the four optical elements that are required to make a spectrometer at least the ones that we are working with and these things are kind of expensive if you go out and try to source them from commercial sources so what we do is we have these uh manufactured and in a reasonable amount and that means that we can sell them for a road a relatively low uh price point and we'll be selling those out of our website smoky mountain smokeymtsci.com [Music] and i'll i'll have that later in the in the presentation okay so we need to have an optical bench right so we're using the cross zurni turner geometry which has the slit at the bottom of this figure and white light comes into the column mating mirror which is mirror one that reflects into the grating which is over here the light coming off of the grating is is diffracted onto the second mirror which is the focusing mirror and the focusing mirror focuses the light onto the detector which is a charge coupled device a ccd all right so there are a number of design challenges associated with making a spectrometer you need to have a precisely defined optical geometry right so how do you calculate the locations and the positions are the positions and the orientations of the optical elements and then how do you translate that design into making a physical object okay the answer to these questions we're trying to make something that's 3d printable right so this slide shows a an old design that we had and we designed this in sketchup a lot of people have 3d printers so we believe this is a good a good method for making low-cost materials we're unhappy with the sketchup freeware because they keep removing functionality from it and we've changed to working with something called openscad so openscad is a free open source computer drafting program that's interfaces well with 3d printing okay there are three print three panes in this window there's an editor over here where you write computer code and there's a console that allows you to output numbers and information and there is this viewer that shows you a rendering of your design so since this is a computer program it allows you to do precise calculation and use that to place your elements and figure out where your light's going okay so as i said you should be able to change the adjustable parameters over here this shows a little piece of the uh of the text editor where you're putting information in and you can choose the focal length of your of your uh mirror over here you can you know choose any number that you want you can put in there you can put different wavelengths and one and the uh the short wavelength here will end up being this blue uh blue stuff that will focus onto a point that long wavelength will give you this red ray tracing and the one in between will give you this green ray tracing you're allowed to put in different number of lines per millimeter of your grading this is set up for 600. you can pick a lot of different distances and angles to put into your into your calculation and this opens cad will generate uh some position and orientation parameters that you can then put into an another another program which will output a three three-dimensional uh figure and then you can turn that into a an stl file a stereo lithography file which can be 3d printed and if you don't have a 3d printer you can most likely use one access one through your local library or your university or you can just go out and buy one anyway once we made the stl file from this we put it on our 3d printer and printed this this physical spectrometer okay as you can see there are a number of black parts which are housings this this black piece in the front uh has the uh the optical slit behind it this is a fiber optic connector there's a small ball lens behind that that fiber optic connector and then over here we have the uh that's where the the collimating mirror is there's a mount behind the collimating mirror that holds it in place here are two mounts that hold the the the diffraction grating in place here is the mount for the for the focusing mirror and then over here this is the ccd and attendant electronics all right so the electronics are based on this uh this toshiba ccd and you have the spectral response you can see this goes down below 400 and up to about a thousand nanometers which is where that that detector is is useful you can change the orientation of the of the uh diffraction grading using by by printing different angles for the mounts right so this shows you a a figure of a mount that has an angle set into this and that will allows you will allow you to change the wavelength region where the where the light focuses in case you you don't have your uh spectrometer exactly tuned the way you want it so there is some some adjustability so this spectrometer body over here we calculated for giving us uh the centered between 300 and 700 nanometers and this is the spectrum uh that we acquired uh this is the spectrum of a what's it called a compact fluorescent lamp which has known wavelengths of an emission i believe this one over here is 611 nanometers so we can do a calibration and you can see that 300 to 700 is not in exactly centered but it's not too bad all right so we have some stray lights giving us variation in the background when we use this translucent orange plastic right so what i'm talking about here is this background noise and it's not noise what is it it's it's stray light that gets into the spectrometer i took this spectrometer and after acquiring these spectra i put it in a cardboard box and acquired 18 more spectra and you can see that they uh they align very well so the the idea here is you don't use the translucent plastic all right so we also came up with electronic hardware all right so we have this ccd detector we are using the teensy 4.0 microcontroller board and we made a uh we had fabricated a board that connects the two and also has an amplifier you know series of amplifiers and a 16 bit a to d converter all right so this shows you another view of it that's the top view this shows that the the ccd the detector is on the bottom side of the board so this part goes inside the spectrometer and this other part sits outside the the spectrometer and we and it seems to work pretty well there's a lot of embedded electronics that we have to deal with we're collecting data at 1 megahertz so we need to calculate we need to get our 16 bits of data off of our adc and under a micro microsecond and this slide shows a scope trace of that all right let's see here we have a couple different interfaces that we're working on one of them this one i'm showing you here this is uh dedicated to um to calibrating our spectrometers right so we have two directions we need to calibrate in we have the intensity direction and we have the wavelength direction and this uh this interface is set up to allow you to calibrate the wavelengths based on the wavelengths the the emissions of a compact fluorescent lamp okay so this peak here is observed at 404.6 nanometers this one's at 435.
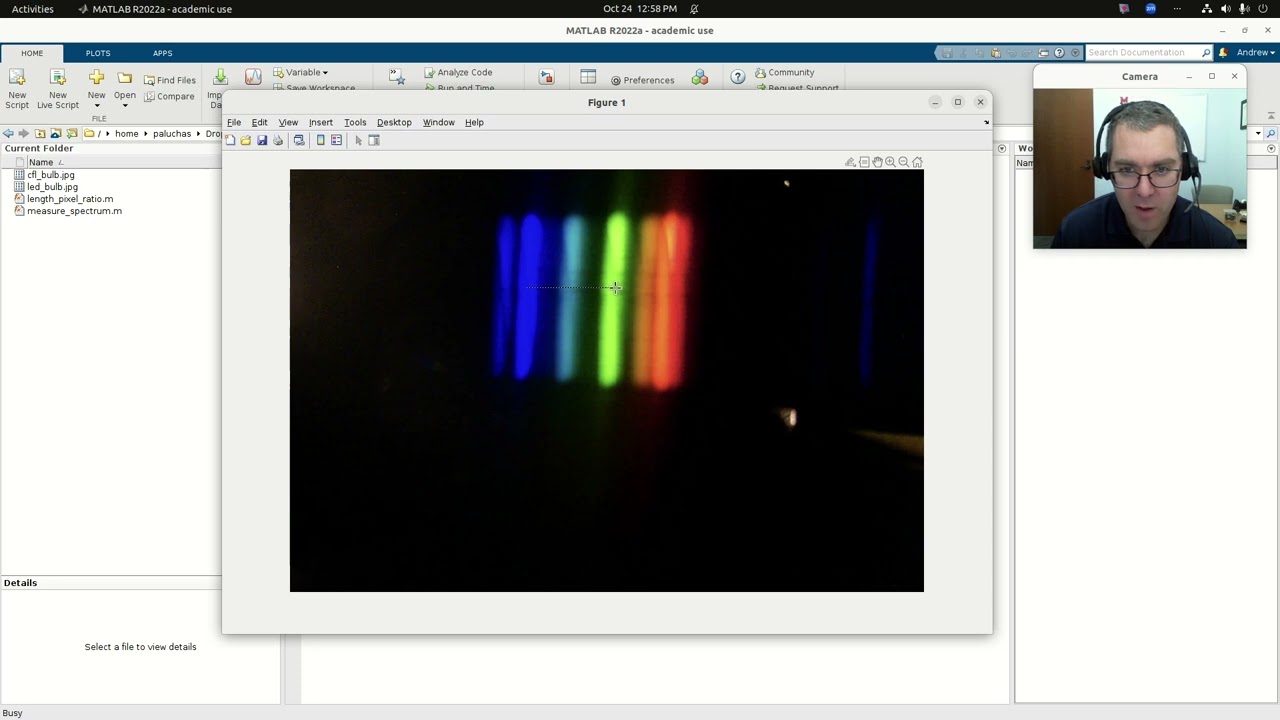
and etc we come down we we pick we have a a way of peak picking you just drag this little box and it'll it'll take this these crosshairs to where you're trying to get it to you select the wavelength that you want to uh to [Music] that you want to assign and when you hit the select wavelength button it will tell you which pixel on the on the spectrum you're looking at once you have the the pixels defined you hit the refine and it will do a least squares refinement to give you a a baseline wavelength calibration data that you can store in that will be stored in in non-volatile memory you hit the right cal button and it stores that information in on the spectrometer on the microcontroller of the spectrometer so that is how uh that that is how this uh calibration the wavelength calibration is done uh you can calibrate the the vertical uh dimension the intensity dimension uh with this low reference and high reference these are out these are values that get transferred to the microcontroller they are output into pwm signals which are voltages that are used by first of all the amplifiers to give you an offset the low reference will give you well we'll change this this dimension the the height of the baseline the high ref will change the the intensity uh the high intensity level okay and i have i have uh videos i have youtube videos available for uh for looking at this information all this information should be available from my our website smoky mountain scientific dot com smoky mountains smoky mt sci okay so this shows some old data of absorbance spectra and i don't really feel like getting into this this is our our this is the lamp that i acquired that information on it's got a fiber optic connector it's got this compact fluorescent lamp this wooden box fits over this it's got a little switch over here and that's how life is i think i'm about done with what i want to tell you uh we got a whole bunch of stuff that we did and yeah and if you have questions i'll be happy to happy to address those all right so thanks a lot for listening
Up Next

Spectral Workbench 2 Tutorial: Capturing and Analyzing Light Spectra
@PublicLab
18.2K views•2018-11-30

Triumph of Orthodoxy Icon: Byzantine Art & History Explained
@BenCallan
2.1K views•2024-08-06

FastAPI vs Flask vs Django: Choosing the Right Python Web Framework
@TechWithTim
302.5K views•2024-05-26

Game of Thrones Opening Credits: A Cinematic Analysis
@gameofthrones
46.3M views•2011-04-18
Related Study Plans & Knowledge Roadmaps
Structured learning paths in General & Interdisciplinary Studies