














The 21cm line from neutral hydrogen provides a unique probe of the cosmic dawn and reionization era, allowing astronomers to map the formation of the first stars and galaxies by detecting the brightness temperature variations caused by spin-flip transitions in hydrogen atoms, which can reveal the topology of ionized bubbles and the percolation process of reionization through statistical methods like power spectrum analysis and Minkowski functionals.
Mapping the Cosmic Dawn with the 21cm Line | Cosmology
Added:The timeline of the early universe, specifically the transition from the Cosmic Microwave Background (CMB) to the Cosmic Dark Ages.
The atomic physics of hydrogen, particularly the spin-flip (hyperfine) transition that produces the 21cm radio emission.
The concept of cosmological redshift and how the expansion of the universe stretches light wavelengths over time.
The difference between neutral hydrogen (HI) and ionized hydrogen (HII), and the fundamental process of photoionization.
The design and engineering of major radio interferometers dedicated to 21cm cosmology, such as the Square Kilometre Array (SKA) and HERA.
Methods for foreground subtraction, which is the crucial challenge of removing bright galactic synchrotron radiation to isolate the weak 21cm signal.
The EDGES experiment and the physics of the global 21cm signal, including potential signatures of non-standard dark matter interactions.
The '21cm Forest' technique, which uses absorption features against high-redshift radio sources to map the distribution of neutral gas at small scales.
371 views6likes27:09Original Release: 2019-05-31
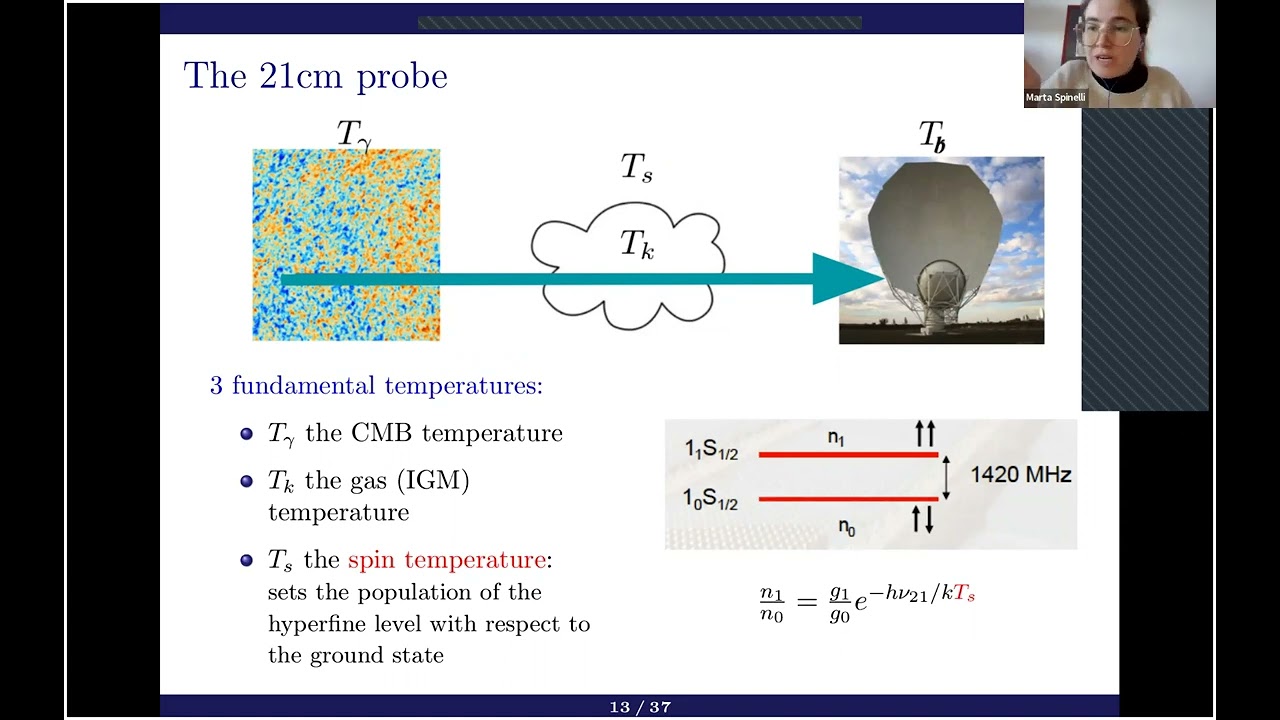
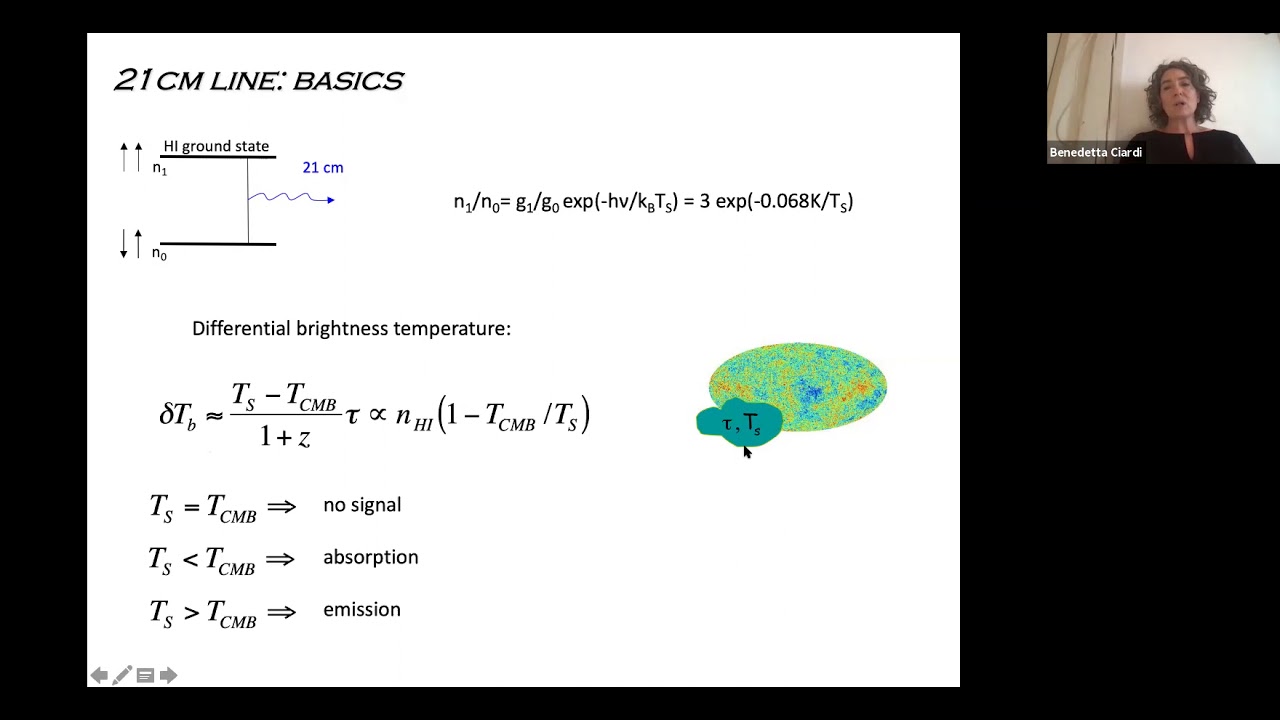
so our next speaker is dr. Pritchard from Imperial College London we'll be talking about mapping the cosmic dawn with the 21 central collide fingers crossed as our great yes so thank you very much yep so I'm Jonathan Pritchard from Imperial College and I want to talk about ways of learning about the cosmic dawn from the 21-centimeter line so I'll touch upon work from some of my students postdocs who these days do most of the work and I should thank the ERC well I still have the chance for giving me money so what is the cosmic dawn so you know when we talk about cosmology we have a fairly well-established picture of what the universe looks like from looking at the Cosmic Microwave Background at very early times we learn about this inflationary spectrum of density fluctuations that over time grow into the sort of galaxies that we see at later times in nice pictures of the hubble space telescope but there's a gap in what we see in terms of the evolution from those early primordial fluctuations through into the galaxies and that's the period of time which I'm most interested in thinking about a cosmic dark ages before the first stars in galaxies form what I like to talk about the cosmic dawn when the first stars and galaxies began to form and illuminate the universe with the first star light and then realization when that ionizing light from those galaxies starts to ionized bubbles which then grow and eventually percolate in a phase transition and so in this talk I wanted to say a little bit about the basics of the 21 centimeter line and say something about the current status of some of the observations which are starting to get quite an interesting period and then just sort of touch upon two topics which are interested me and hopefully to you looking at rihanna's ation as a percolation process and then thinking a little bit about how we'll use some of these observations specifically as the power spectrum to estimate some parameters and some of the challenges that come up in trying to do that so if you start to think about this period of realization we have some constraints things like the Cosmic Microwave Background if you look for the optical depth which is a measure of how many CMB photons get scattered by ionized gas between us and a redshift of 1,100 that tells you something about when realization take took place and you can use it to constrain the kind of the midpoint of when realization that's happening you can look at things like the lyman-alpha forest and to say something about that very end point of reorganization essentially that it's all done by a redshift of six point five or so you can look at things like the kinetic Sonya Zelda effect and get some sense of the duration but that's really it and what you'd really like to learn about is a much more complicated structure that looks like this figure up here where the red is neutral gas the black is ionized gas and you have these kind of bubbles that get bigger over time and grow and merge so you'd like to learn about those kind of structures you'd like to learn about the sources that are driving it which we begin to learn about by looking at the faintest galaxies in the Hubble ultra-deep field and we'll learn a lot more about with JWST hopefully in the not too distant future but really the sort of the existing observations are not enough to tell us about these kind of structures and we need me something new which is where the 21 centimeter line comes in so just to to show one picture of what we do know about rihanna's ation so this is the kind of plot that people like to make looking at a function of redshift and a neutral fraction so the fraction of gas in the universe is neutral and the kind of data that we have are these kind of you know a hodgepodge of arrow bars from lyman-alpha emitting galaxies lime and break galaxies all interpreted in the context of model and often with quite a lot of systematic errors it's the CMB and what you're trying to do is piece together some kind of history here one would like to know more so that's really where the 21 centimeter line comes in and that's where I want to focus the majority of my talk and so you know you're all smart people but just to remind you what the 21 centimeter line is so we're talking about the hyperfine splitting of the hydrogen ground-state so you've got a proton spin and electron spin and they can be aligned or anti aligned and do these kind of spin flips absorbing or emitting photons with a wavelength of 21 centimeter and that 21 centimeter or 1.4 gigahertz redshifts into the radio band so frequencies somewhere between 50 and 200 megahertz of interest here so 200 megahertz is redshift 650 megahertz is redshift of 27 or so and these correspond to times going back to about 100 million years after the Big Bang so we're really starting to look back into the very early universe with these observations or well once they work and so the kind of picture in cosmology is that you have the Cosmic Microwave Background which is a radio bright back light source light from that comes through clouds of gas which absorb or emit 21 centimeters photons imprinting a signal that redshift to radio frequencies today so you know if you listen to I don't know things like the Today Show on the radio you're contributing to the noise here along with John Humphrey getting in the way of doing science with these kind of observations and so what we want to do is to measure the signal and learn about measure of the intensity which you can describe in terms of a brightness temperature which depends upon properties of the gas so things like how much of the gap hydrogen gas is neutral or the density is there's an important term here which is the difference between a spin temperature and excitation temperature of the gas and the CMB temperature if this term in brackets is positive you get emission signal if it's negative you get an absorption and that tells you that you're looking at cool gas and there's a lot of physics that goes into setting the spin temperature and excitation temperature you can interact with CMB photons and the spin temperature gets driven to the CMB temperature and your signal goes away you can have collisions between hydrogen atoms that drives the spin temperature to the gas temperature and you can have resonant scattering of lyman-alpha photons which also drives the spin temperature to the gas temperature and so we're sensitive to things like neutral fraction density lyman-alpha flux and the gas temperature those are the kind of things we had to learn from the 21 centimeter signal and so just to give an impression of what that looks like I want to show this video movie which is about a hundred megaparsecs on the side it'll go from a redshift of 25 and decrease in redshift blue is cold gas hot will be hot gas and so we start off with very little this far too quickly okay so the blue gas initially is coupled and cold we start to get heating which of these red regions eventually as you get lots of x-ray heating from compact objects the gas all becomes hot and then you move into this phase where you have ionized bubbles which are the black gas just slowly growing let me run that once more just to show so this is the kind of thing that one would hope to see if you could make a movie and ultimately this is the sort of thing that radio telescopes like the Square Kilometre Array hope to do to make images as a function of frequency in order to see the evolution of this so just to map that out so this is the kind of signal that we we expect to see and this is very much a story so at early times you just have density fluctuations before there are any galaxies once you start getting galaxies they produce lyman-alpha photons which coupled the gap as a spin temperature and the gas temperature producing this strong absorption signal that is strongest if you have very little heating and once you start to get heating from x-ray sources you move from absorption into a mission and around the same time you'll get realization and your signal slowly dies away so there are two sorts of signal you can look for this kind of spectral distortion in the same way as sort of measuring the CMB blackbody or looking at maps and there are different experiments that are trying to do both of those from single dipole experiments like edges through to things like LOFAR MWA here and eventually SK looking at these maps and one of the things that's very nice about this field is that there's a systematic path to probing this full range including putting radio interferometers on the far side of the moon which is everybody's favorite science case so these are some of the instruments that people are looking at so we've got low fire in the Netherlands mlwa and the Australia there was an experiment paper which is now completed in South Africa and is being replaced by Hiro which is a set of 14 meter dishes there are some of those out at Lord's bridge in Cambridge if you want to go see them and eventually there'll be the SKA so all of these are low frequency radio interferometers essentially you take lots of individual dipoles collect them all up and use that as your radio telescope so you know this is a fun area for me because I've been sort of working in this area pretty much since my PhD and talking about how soon these observations would come along they're not quite there yet but there is data so that's exciting so these are very hard observations to make so you have these large radio telescopes which you need to be able to calibrate and you can calibrate them on the sky in the traditional radio astronomy way there's a new relic well it's an old reimagined technique known as redundant calibration which telescopes up here are using but this is one of the big challenges for getting these instruments to work the other big one is radio foregrounds so you're looking for this fairly faint radio signal from the epoch of realization but what you have between you and it are radio emission from galaxies from a galaxy all of which are many orders of magnitude brighter than the signal that you're looking for but happily there are lots of clever ideas for removing that Emmett Chapman who's an Ras fellow as one of the people who's developed a lot of that for for LOFAR and a lot of progress is being made on this so that finally I can start to show plots like this which have some data so this is plotting as a function of redshift the amplitude of the 21 centimeter power spectrum and a set of upper limits which have really just since 2014 started to come from the different telescopes so MWA has some constraints up here these black ones are from LOFAR these other ones are from mostly from paper and then to theoretical models this is the kind of fiducial model that we think about the normal galaxy forming galaxies driving realization this is the kind of most extreme plausible model that I can come up with where there was no heat production in the early universe and so the gas has just been cooling ever since the CMB and that gives you your largest signal and the take-home point is that these upper limits are starting to make contact with that realm of models there's a sad story that actually this data pointer has been retracted in the last month or so these are these are hard to get right and there's a real danger that when you do your analysis that you throw away some of the signal at the same time as removing foregrounds and error estimation so that was what was going on but things are looking good and the limit here is very much systematics LOFAR certainly has the sensitivity to detect something if they knew how to analyze all of their thousand hours or more of data so that's kind of where we are and so I think it's you know it's a hopeful phase and so then the question is as we start to get detection x' what are the interesting things that we're going to learn so I just want to play about with two two sort of areas for their imaging and the power spectrum so what one would really like to do is to make these kind of time-dependent movies by making three-dimensional maps both in angle and in frequency and if you could do that then for example you could image the ionized region around very bright individual sources so sort of quasars at redshift seven or eight you could start to make maps like this with ionized bubbles and use that to tell our friends we work on high redshift galaxies what kind of environment they're galaxies were living in whether they're ionized or neutral regions you could build up catalogues of ionized bubbles sizes and learn something about what's going on during the ionization so you know looking at these individual bubbles is looking at relatively local properties but you can also look at realization as a bonafide efface transition so realization is a percolation process just as you may teach in condensed matter courses you know you have bubbles which have some size they get bigger over time eventually those bubbles start to overlap and you get clusters which are long and eventually the length of a connected ionized region becomes essentially infinite in a simulation case it ends up crossing the box from one side to the other so on the left-hand side these are four simulations of realization the red is ionized gas blue is a percolating cluster that maps from one side of the region to the other and as time goes by initially well this this comes into existence when the ionized fraction is about point one and then grows and grows until it can see it contains essentially all of the ionized gas and along the way the neutral regions go from containing all of the gas to being broken up into separated discrete islands so just sort of show a video of on the right hand side where red is again ionized and eventually you'll see a a percolating cluster appear in blue so getting more and more ionized and eventually at point one you get this blue cluster which comes into existence which is the percolating cluster and eventually grows to contain everything so when you start talking about phase transitions you want to talk in terms of some sort of an order parameter which in this case is naturally described as the fraction of gas in a phase contained within that percolating cluster so if I'm talking about ionized gas I've got some amount of ionized gas some fraction of it is in that percolating cluster and that would be my order parameter and we can look at not only the ionized gas but also hot or cold gas or above and below some of arbitrary threshold and so you end up with a picture that looks something like this where there's a function of redshift you have order parameters for the different phases of the gas so if I were to look at say this cold gas down here the order parameter is zero there's no cold gas moving backwards in time at some point I a percolating cluster appears they got to an order parameter one where essentially all of the cold gas is connected and so you can use this as a way of finding different phases of Rihanna's ation where all of the cold gas is one cluster hot and cold glass are both in these percolating clusters so intertwined and so on and so this is sort of an interesting way of thinking about realization the question is how would you actually go away and observe this and so one way is to think about things known as Minkowski functionals which are a way of describing the topology of gas at a redshift and the most interesting one is the Euler characteristic which is a way of describing connectedness so it's defined in this way so you have the number of parts so the amount of stuff minus the number of cavities so if I have a shell that has a hole inside of it which is a cavity minus the number of tunnels so this kind of tourist type structure here has a single tunnel running through it and if I had a figure of eight I'd have two tunnels and so this other characteristic runs from being more positive if I have more disconnect structure the more negative if I have more interconnected tourists like structure and it turns out that the zero point of this Euler characteristic can be connected to the point at which percolation happen that's where you have this sort of different filaments in connecting with one another and so you can look at what this will look like in during realization and so this is sort of a complicated picture where I'm plotting the Euler characteristic as a function of redshift and then as a given threshold in brightness temperature so if I were to look at this dotted line here for example I'd be looking at gas above this or gas below this and asking the question do those live in percolating clusters and it turns out that as you go from high redshift to low redshift you start off with a phase where all of the cold gas is connected then you end up with both the hot and the cold gas have these percolating clusters then the hot gas breaks apart the cold region so only the hot gases percolated then you start to get ionized bubbles which are percolated and then eventually it's only the ionized gas and this blue region here is where the Euler characteristic is most negative and represents the region where you have the phases both above and below the line in percolation and this Euler characteristic is potentially something that you can go away and and Mesa people have tried in the CMB and hopefully we will 421 centimeter okay so that sort of requires imaging and so there you're talking more about the Square Kilometre Array for the first generations of instrument the real thing that you look for is the 21 centimeter power spectrum and so this movie here just sort of shows the kind of thing that we'll be looking for so here is a function of scale and plotting the brightness the power spectrum and you'll see that as a function of redshift this will evolve quite a lot on the left hand side is just a map of the fluctuations in the slightly silly color scheme so if I let this run you'll see that this power spectrum it rises it falls it changes in shape towards the end as you get ionized regions it flattens and falls away because there's no neutral hydrogen left and so in terms of scale this power spectrum is relatively featureless but in terms of redshift or frequency it moves about quite a lot and so you'd like to use both of those as a handle to understand what's going on in your models and so as upper limits start to come along we begin to be able to play the game of parameter estimation at the CMB so you can write down some sort of priors on data or some sort of likelihood to make predictions for parameter constraints in the form of a posterior evidence if you want to do model selection and you the sort of thing you want to do is to be able to write down models with some set of parameters which are things like how many ionizing photons and my galaxy is producing how many galaxies there are what x-ray production is there model the power spectrum and other statistics and then do this kind of Bayesian process to invert it so pretty you know it sounds very easy when you say it like that in practice this is going to be very difficult for us because we need to do this with numerical simulations which are very expensive to run individually you don't want to throw those away entirely because a lot of hard works gone into them and so you need to work out how to use them and so a lot of the effort that's going on at the moment is looking at the an idea of emulators so the idea is to take a finite and hopefully small number of evaluations of your complicated numerical models and use those to come up with some approximation scheme with which you can do the Bayesian analysis quickly and it turns out that this isn't a crazy thing to do because when you do your Monte Carlo and yeah Markov chain Monte Carlo you're often sampling the same point in small regions many many times where the model isn't changing very much and so scoot on the kind of thing that we've been doing is looking at using neural networks to piece together the behavior away from some set of training points you can also use Gaussian processes and this works really well so you know it's the sort of thing where rather than needing millions of points in your MCMC you can get away with a training set of a thousand or so and recover the kind of parameter constraints that you expect very accurately so things look fairly good at this I don't know I'm sort of running out of time yep good so you know the power spectrum is just one statistic because the 21-centimeter signal isn't a nice gaussian random field you need to use other statistics but it's not clear which were the best to use so some of my postdoc Suman Majumdar Catherine Watkinson have been looking at the by spectrum as opposed to a large scale structure the pi spectrum here is relatively large and one of the interesting things that you might be able to do is to look at kind of trajectories of your models in power spectrum by spectrum space so these are different for different models of rihanna's ation and hopefully will help to distinguish different things going on and so that's kind of you know some of the topics which i'm interested in you know the big work at the moment is thinking beyond LOFAR MWA for ska SK the Square Kilometre Array has been doing a lot of design work over the last year there will be dishes in South Africa I'm mostly interested in this aperture array in Australia for realization but as a project you know I'm biased but I think the SK will be fantastic we're very lucky in the UK that we have the headquarters of Jodrell Bank they're putting up a really nice fancy building there so you know go and visit that the kind of timeline is an international governmental organization hopefully coming in soon ish construction 2020 on to about twenty twenty six and then bits of science happening as the construction goes on with full operations about 2028 so you know it's still somewhat in the distance but there's a nice path from where we are now working on LOFAR to ska and then an exciting decade and more beyond that so I will finish on that sort of uplifting note I think Rihanna's ation is still pretty interesting you know a lot of progress is being made to measure the global realization history but you really need to go beyond that to understand the topology and the structures I think if you want to learn everything that there is to know about the sources and the instruments are really starting to get to grips with this there's data being collected by LOFAR MWA paper they're making progress in understanding the kind of systematics that come along it's not easy but upper limits are there and they're getting smaller as time goes by and once we start this to work imaging is going to be really interesting for learning about things like percolation the power spectrum has a lot of information that we're just starting to work out how to analyze and connect back to the more sophisticated numerical simulations which will be important [Applause] thank you to distinguish between warm doc Matt cold doc Matta no doc matter considering that you need to impose the same initial fluctuation to start growing the signal in the matter so so so I mean when you start talking about the 21 centimeter signal there's always two directions that people want to go in to learn about the astrophysics or to learn about the cosmology you know I got involved because I thought this was going to be the next big CMB and excite really exciting for fundamental physics as time goes by I get a little bit more skeptical for that because it turns out that astrophysics is really hard and complicated and messy so things like warm dark matter versus ordinary dark matter assuming that you can significantly change the populations of low-mass halos and propagate that into the kind of heating or the ionization then there can be large signals to look for and so certainly not crazy you need to come up with a way that you're confident that that's different from some sort of other feedback effect acting on the galaxies and I think that's the sort of the generic challenge for doing cosmology versus astrophysics trying to come up with clean signatures where you're confident this is what you're seeing okay one more I was interested by the minkowski functions for the topology of the bubbles on simulations that seems okay but if you start having data where there are literal holes from a mask or the edge of your survey is there a simple way that you would be able to fix that simple probably not is it practical I think that's a really interesting question so I mean measuring Binkowski functionals on the CMB you know my understanding is that that's not been the easiest of things to do there are some advantages here that your signal does not mean zero and so noise and your signal is somewhat separated dealing with edge effects isn't something that I've thought about in general that sort of area is very undeveloped and people who need to sit down to think about that sort of stuff to see how things go yes [Applause]
Up Next
71:45
Probing Cosmic Dawn with the 21-cm Hydrogen Line
@CMBBharat
208 views•2025-05-28
61:17
First Billion Years of the Universe with the Square Kilometre Array
@iaaudc
121 views•2022-05-26

69:50
Phosphine Detection on Venus: A Potential Biosignature Discovery
@RasOrgUk
267K views•2020-09-14
6:10
Gamma-Ray Bursts: Cosmic Snipers Explained | Astronomy
@kurzgesagt
15M views•2016-07-31
Related Study Plans & Knowledge Roadmaps
Structured learning paths in Astronomy
astronomy
Reionization: Pop III Stars, IGM & 21cm Line
01Foundations of Cosmology & the Early Universe
02Population III Stars & Cosmic Dawn
03Physical Mechanisms of Reionization
+ 2 more learning modules
17h5 modules
Explore Roadmap
astronomy
Planetary Rings: Dynamics, Roche & Resonances
01Foundations of Gravity and Orbital Mechanics
02Tidal Forces and the Roche Limit
03Structure, Composition, and Collisions
+ 2 more learning modules
10h5 modules
Explore Roadmap
astronomy
Asteroseismology: Stellar Waves, Ages & Cores
01Foundations of Stellar Astrophysics & Wave Mechanics
02Stellar Oscillation Modes: P-modes and G-modes
03Mathematical Framework of Asteroseismology
+ 2 more learning modules
35h5 modules
Explore Roadmap
astronomy
Adaptive Optics: Physics, Engineering & Control
01Foundations of Wave Optics and Wavefronts
02Atmospheric Turbulence & Optical Distortion
03Wavefront Sensing Technologies
+ 3 more learning modules
35h6 modules
Explore Roadmap