













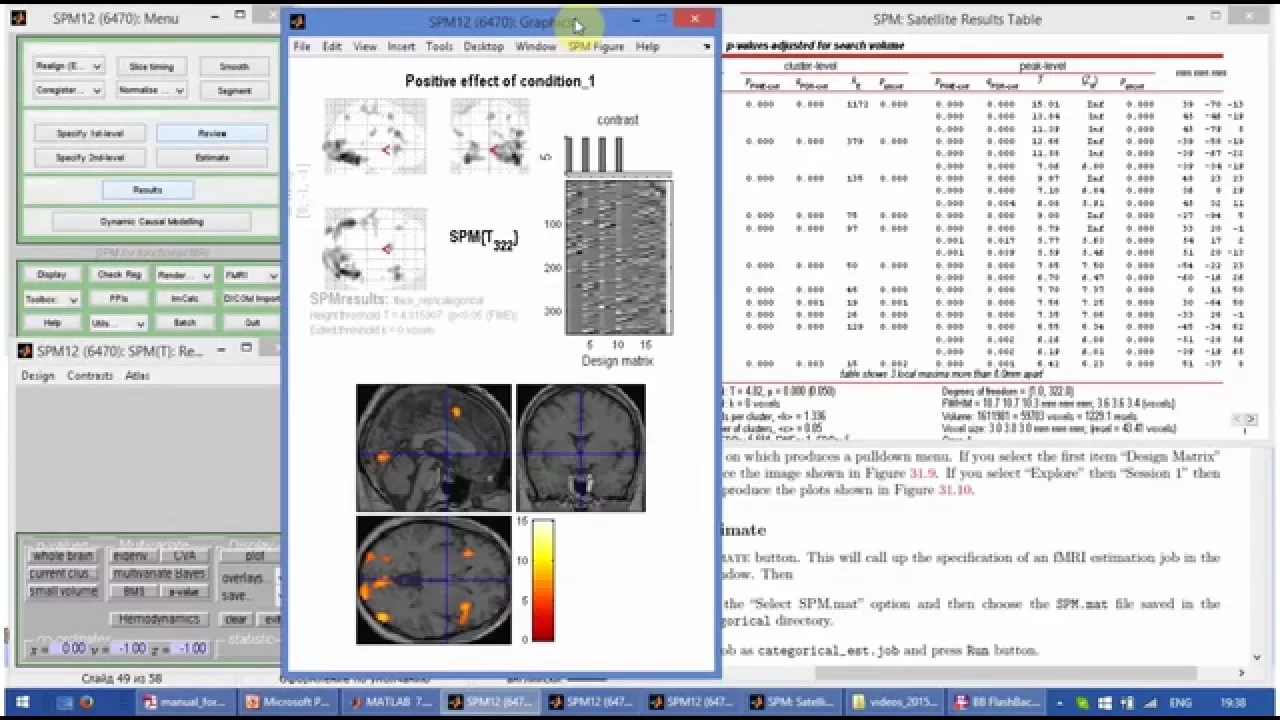
Dynamic functional connectivity extends traditional static connectivity analysis by examining how brain network interactions change over time within a single fMRI scan, using methods such as sliding window analysis, co-activation patterns, and state detection to reveal temporal dynamics that may provide more sensitive biomarkers for understanding brain function and disease compared to time-averaged connectivity measures.
Dynamic Functional Connectivity in fMRI: Methods & Challenges
Added:Understanding of basic fMRI principles, particularly the Blood-Oxygen-Level-Dependent (BOLD) signal and its hemodynamic response function (HRF).
Familiarity with static functional connectivity (sFC) analysis methods, such as seed-based correlation and spatial Independent Component Analysis (ICA).
Fundamental concepts of time-series analysis, including Pearson correlation, signal filtering, and the limitations of temporal resolution in neuroimaging.
Knowledge of major large-scale resting-state brain networks, such as the Default Mode Network (DMN) and the Frontoparietal Control Network (FPN).
Advanced dynamic modeling frameworks, such as Hidden Markov Models (HMMs), wavelet-based coherence, and time-varying autoregressive models.
Clinical applications of dynamic functional connectivity, including identifying temporal brain-state alterations in neuropsychiatric disorders like schizophrenia, depression, and Alzheimer's disease.
Dynamic graph theory analysis, focusing on temporal fluctuations in network metrics like modularity, participation coefficients, and hub node dynamics.
Methods for statistical validation and artifact mitigation, such as utilizing phase-randomized surrogate data to distinguish true neural dynamics from sampling noise and head motion artifacts.
326 views5likes50:36Original Release: 2025-04-04
Yeah, thank you so much. All right, so um this lecture focuses on um dynamic analysis um or dynamic functional connectivity. Um and so I know you guys have recently covered concepts in in connectivity. So yeah, we essentially extend these to look at more of the temporal dynamics.
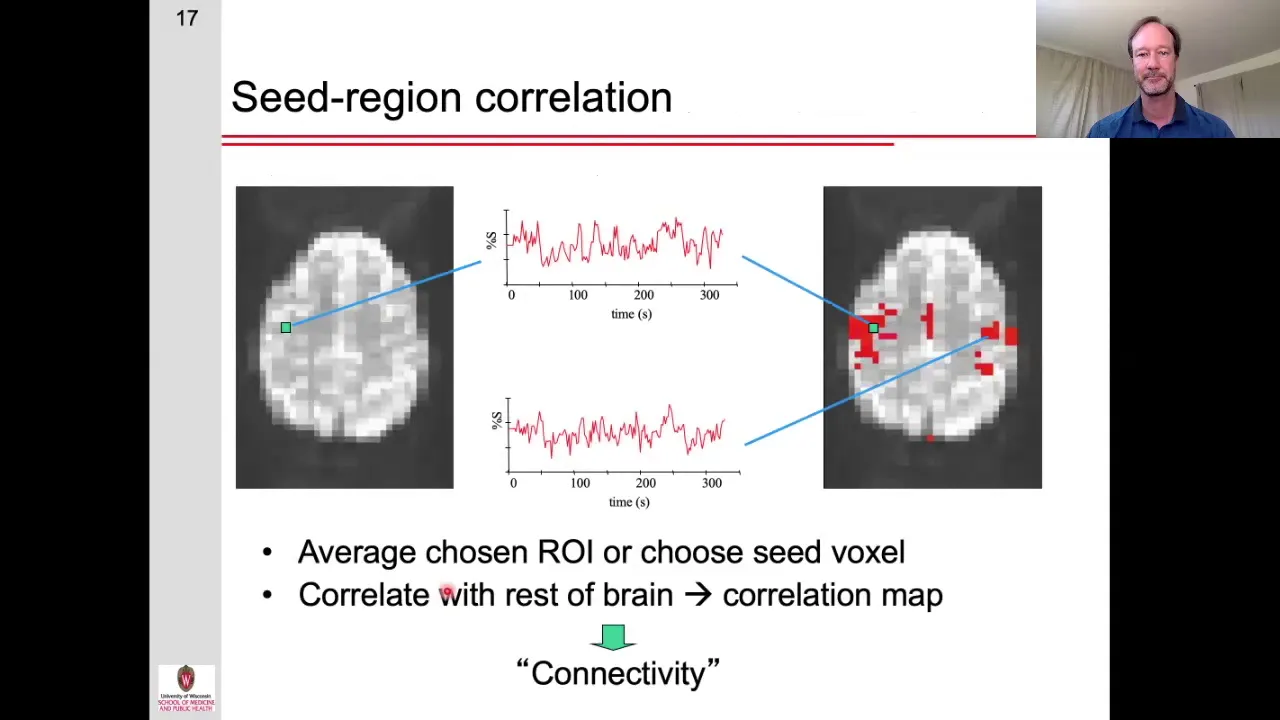
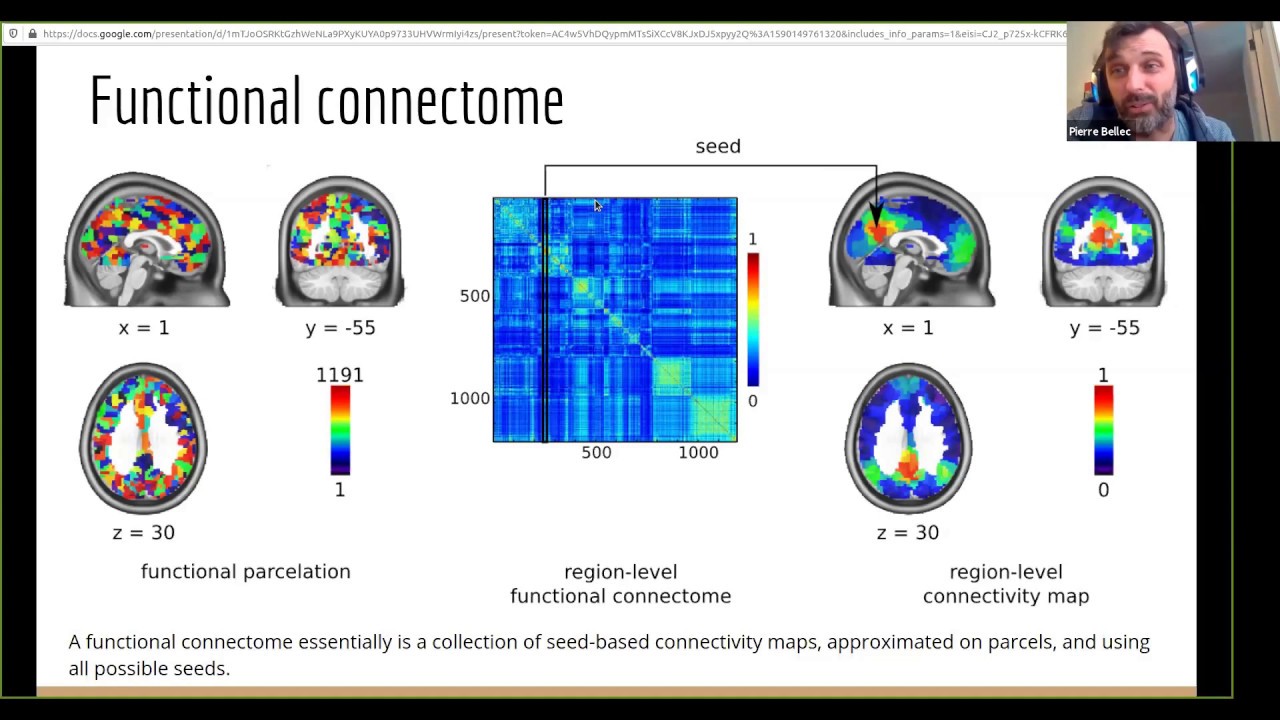
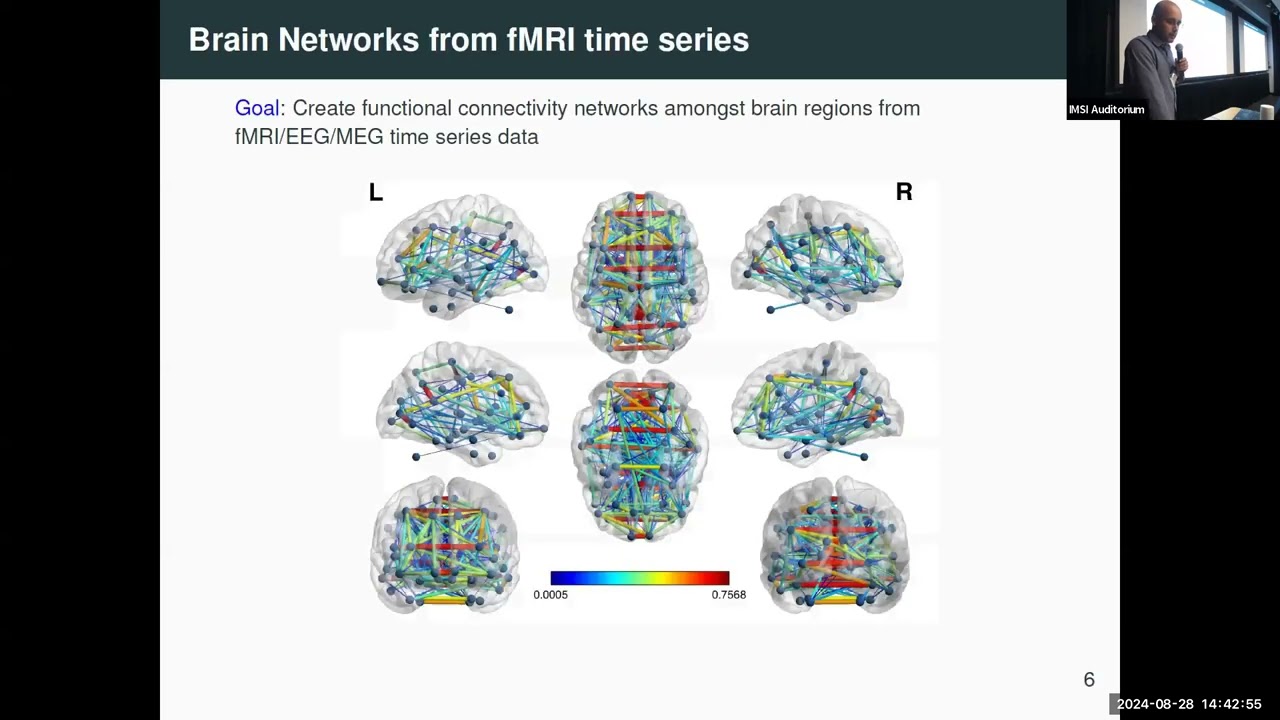
Um and so this is going to be more of the dactic lecture. So I'm going to go a little more through some of the types of techniques and um methods and trade-offs. So um I will uh yeah give an overview first uh talk about some methods for analyzing the data in a dynamic fashion um and then go into some of the issues and challenges and interpretation um and then wrap up. So functional connectivity um what is our goal? So we are interested in investigating how different brain areas may be interacting as systems or networks. Um and so we'll need a way of trying to infer uh these networks based on fMRI. And so what we do as you know is we use our time courses uh we extract the time courses from different brain areas and we try to map their statistical similarities using measures like pairwise uh correlation like Pearson correlation or mutual information or other similarity metrics um and hope that will give us some insight into the um functional organization of the brain. So, um, as you've probably, uh, heard about quite a bit already, um, there's a lot of, um, stability in the the patterns that can be identified across different people, um, or across many different conditions.
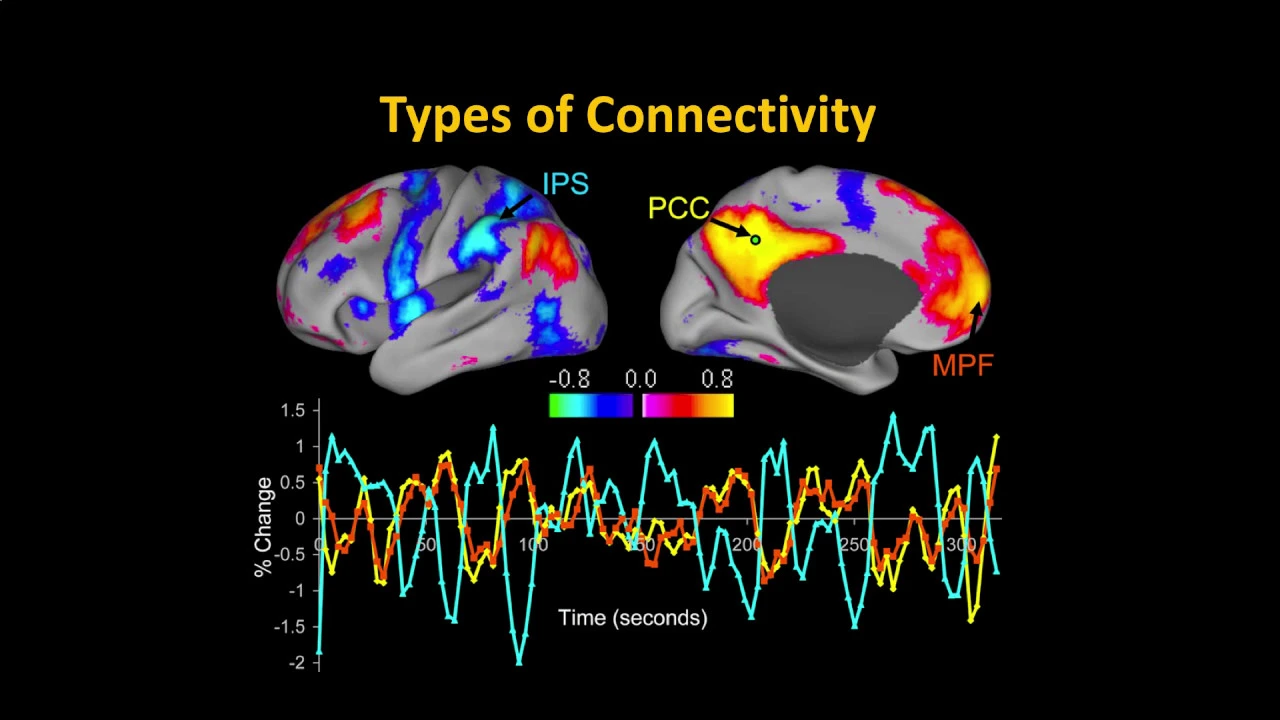
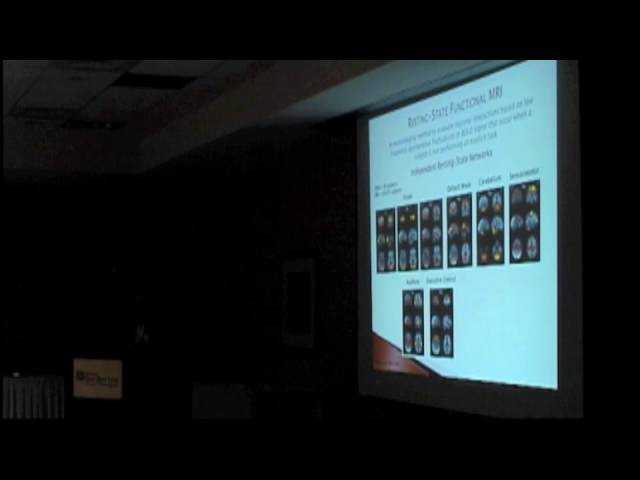
And so, um, if you take the default mode network for example, um, you can identify a pattern that looks quite a lot like the default mode network, not only in people who are awake, but you can still find it when people are asleep. although there's some differences. Um you can find it in other species. Um you can find it in uh in infants um as well. So um one reason that you know these are so um there's so much interest in studying these networks is because it seems to be some hallmark of brain organization uh that we can consistently detect.
But if you look more closely at the actual like magnitudes of correlations and topology of these networks, you can also see that there is variability across different conditions. Um, of course we already talked about um arousal states um but to illustrate a few other examples um you know it's in one experiment they asked um how much is connectivity altered by what a subject is thinking during the resting state scan. So you can have we just put in resting state scan. You have someone in the scanner and you say maybe you don't give them much instruction, right? You say just relax. Um some people could be thinking about their favorite song. Some people could be worrying about their grants or um etc. And so it's actually kind of important to consider whether these um like uh just hidden cognitive processes might be shaping the connectivity patterns that we're getting. And so um they in this paper I highlighted here they um they did this experiment where they would tell people to specifically do some of these common things like they had to imagine songs in their head during the scan or they had to be recalling memories. Um and then they asked if you take the region to region connectivity patterns can you classify what someone was doing based on that connectivity pattern alone? they could actually get fairly good accuracy meaning that the patterns do change um according to what people are thinking.
Um this is also useful to us in the context of uh you know in clinical applications. So um one of the primary uses of resting state is to ask are um intrinsic networks altered in disease can this be a biioarker? um and the fact that we have these variations across disease of course is very important for um for being able to do this uh research. So um the focus of this uh lecture will be on connectivity changes on in time and so I just want to start with this illustration. Um so suppose you have a subject resting in the scanner with their eyes closed and it's a long scan. So they're in there for 54 minutes um poor person. um then you could make a connectivity matrix with that whole stretch of data, right? I could take my time courses 54 minutes long from my different brain regions and I could correlate them and create this matrix. Um but then you can ask what happens when you start to break that down. So I could I could chop this up into the first 30 minutes or the last 24 minutes and so forth. And even 15 minutes, which is like it's a long scan actually. Most of our scans are not 15 minutes, but even in that uh in that interval, you can still see some differences, um in the connectivity. And so um questions that this might raise are what is this coming from? Is it mainly arousal state effects or cognitive effects or is there noise? Um what is happening that drives this variability? Um so this is a interesting um you know avenue to to think about. Um and so oops um let's kind of think about why um we might just want to study these dynamic u measures of quantity. So um one motivation is that you know we know that many conscious and unconscious processes are evolving on time scales that are shorter than one scan. Um so as as we've already seen um different internal states such as vigilance these are continuously shifting and so there might be some real neural state changes uh that are happening over um our data acquisition and could be very interesting to study. Um one thing to keep in mind of course is that we are using bold fMRI. Um so what we can study in terms of dynamics is of course filtered through this hemodynamic response. And so we are um more limited to studying changes that are on the order of you know number of seconds rather than milliseconds as you might be able to do with um meg or EEG these kinds of technologies. But it's also been reported that um you know there are a number of um you know using simulations some faster state changes can even manifest in fri slower bold signals. So um um another motivation is that uh temporal features of our data may actually be important biomarkers. And so if we only look at the average correlation between brain regions over a scan, maybe we're losing a lot of information that could be useful to unpack and say, are there features that we can abstract ex um can extract from say like a series of connectivity matrices calculated over the scan that might be valuable for understanding a disease. Maybe it's the variability in connections that's the more um interesting feature than the average correlation for a particular um application.
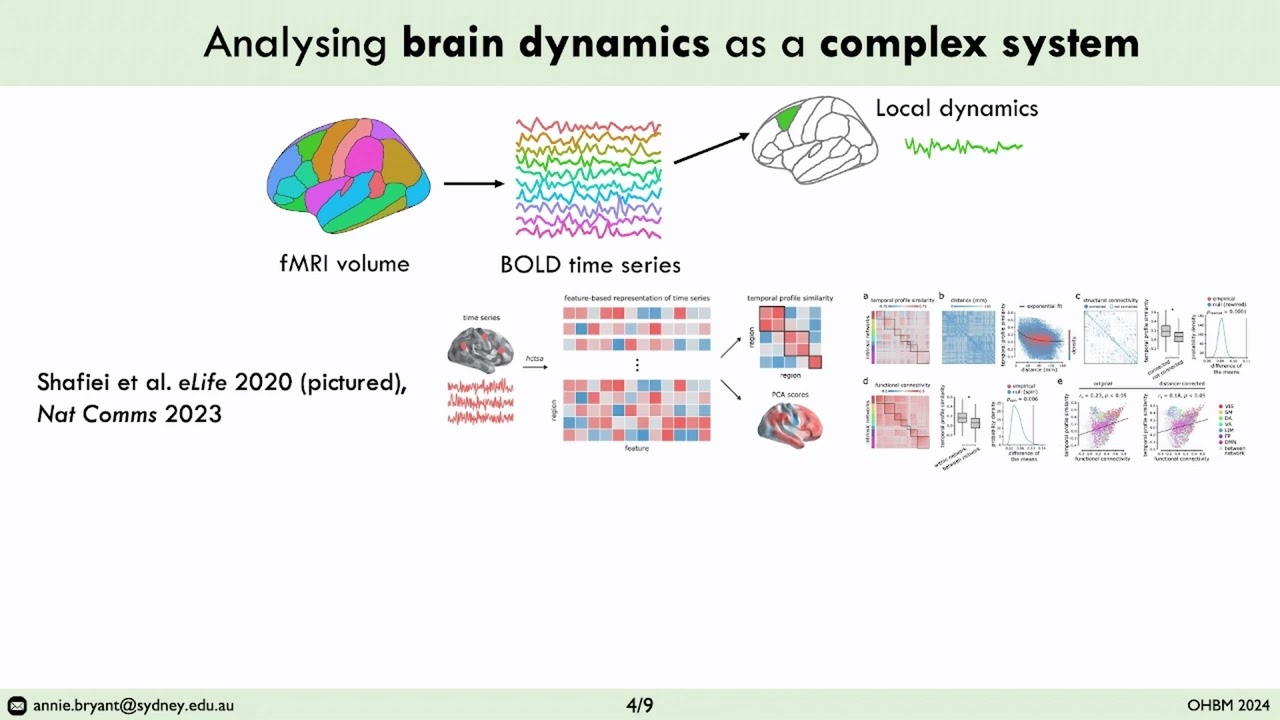
Um and also you know if we're studying these state changes um in our uh if we're if our focus of our research is on different states such as affective states, cognitive states, physiological arousal states then um that's another motivation of course to to calculating connectivity measures on faster time scales. Um and one thing to keep in mind is that there in terms of the methods it's it's quite exploratory because um you know we have these 40 time course data right like 3D um uh data over time is an fMRI scan there's so many operations we can do on this data to try to find features of interest and and so I think um there's a lot of uh literature has been to just take um approaches from um maybe that are being developed in computer science, engineering and other you know for other applications or for or in a basic um you know technique development for signal analysis and say like how can we can leverage these techniques um to understand more about brain activity. So there's a lot of uh cool work going on. Um and so over the years there's um been a number of studies probing whether um features that you extract based on the dynamics of uh regional or network interactions can provide um important information about individuals. So I just kind of put up this um set of studies here that um in one way or another has shown that some dynamic feature extracted from our data um may um provide a more sensitive measure than this kind of time averaged um measure of connectivity. Um so for example um uh this study actually showed that um if you look at this is a an auto reggressive model of connectivity dynamics. Um it could explain more variance in uh cognitive assessments compared to this like longer time average static connectivity. But that was only true actually for certain measures. So it seemed that the dynamic features um explained more variance in measures like fluid intelligence, sustained attention, working memory.
Some of these kind of um where you have somebody doing an assessment and they're kind of doing some active uh uh cognitive or attentional uh task. Um, but they also looked at other um uh traits that were um um like like they they uh you had subjects give them self-report measures of things like um how lonely are you, how stressed are you and interestingly some of those measures had a stronger relationship with not the dynamic features but with the more uh time averaged maybe stable ones. And so I think that what this suggests is that that different um time scales about dynamics may actually be relevant for capturing different aspects of um brain function.
So um the idea behind this dynamic uh functional connectivity um analysis is just to kind of put that in a picture.
Instead of taking all the time points in our scan and using that to make a single network um or connectivity matrix or any other way of representing connectivity then you can essentially consider um shorter intervals of time and understand how um there these dynamics may be playing out um in time. Um and so although I have a picture here that indicates like network or functional connectivity um more broadly this field of dynamic analysis extends beyond these kind of region to region correlational matrices but can be these signal um patterns more instantaneous patterns etc. And I'll show you some examples of that. So um yeah, let's go through some methods and I'll start with sliding window analysis because this is one of the most um conceptually straightforward ways to think about studying changes in something over time. So uh this is also the basis for a lot of different approaches you may read about in the literature. So the basic idea is that um we can divide our scan into some kind of overlapping or non-over overlapping windows and then for each window you can just calculate uh some measure of interest like I mentioned it could be the correlations it could be an ICA um the decomposition um things like that um over these uh different intervals of time and so uh if you do that um then just to illustrate some of the matrices that may come out. Um this study um took different intervals of time and resting state data and found that yes uh just as we saw in the other example, there can be quite a bit of difference um in the properties um of the data over these different time windows. Um, I made this movie actually back when I was a grad student and exploring data, but I like to show it anyway because I don't know, maybe just like reminds me of um kind of the things of like I was trying to think about in terms of what this all means.
Um but if you take a seed in the posterior singulate cortex and you make a movie that captures um how that uh map is changing over two minute windows of data then you can see quite a lot of difference in even in the same scan. Um something that changes most actually is maybe the anti-correlations. So those positively correlated regions seem to remain stable um over time. And so at the outset if you're just looking at resting state data um again we have some questions about what exactly that means but um you can definitely see that there are a lot of um dynamics in the in data. Um so it's easy to just take your data and run some analysis like this. Um but there are a number of trade-offs uh to be aware of um and some parameters that you would have to select as well.
And so one question you might ask is how long do I make windows when I'm going to look at networks um over time um on the one hand we if they're too long then we're not really we're maybe missing something that's happening at a faster scale but on the other hand how short can we really make them given that the hemodynamic response takes like 20ome seconds to return back to baseline. So if we slice it up too much then we can get some weird effects happening just because we are um taking very short sections of data and also the fewer data points that we have the more unstable estimate we have um you know to uh to work with within each window. So there can just be more variability by virtue of having um kind of the noise um of shorter windows. And so um those are some of the tradeoffs um to to kind of consider. Um I I would say that like in the literature um people tend to use around um maybe 30 seconds as a short side when you're looking at some kind of when you're extracting some kind of uh correlation between brain areas. Um but we'll also look at some methods that look at more instantaneous uh variations as well.
Um, another challenge to think about is um, when you start to open up this time axis more, um, then we're also opening up a much bigger space of features to work with, right? So, we've kind of we don't just have one connectivity map or network per person. We now have like a series of these things and we got to mine them to figure out um, what is the essential information? Um, how can we summarize uh, those into different um, measures to to gain some insight? And so um suppose you have this kind of hypothetical measure of dynamic connectivity over time. This could be from a sliding window analysis or it could be from another way of parameterizing um connectivity change.
Um but you um you know we can see that uh there there may be some features that we can um pick up from this um dynamic behavior. So maybe how much do regions vary in time? um how quickly do changes happen? Um and so basically can kind of um ask there in in a lot of cases um if you're studying this in the context of some uh clinical application or cognitive question then it's really helpful to have some hypothesis that you're trying to test. um maybe there are reasons to expect that there's a more variability um in this connections um for example and so maybe you want to use this as a measure um of interest and then just like we can do for a sort of typical functional connectivity analysis a non-windowed one um we can you know take these metrics and then do statistical analyses across conditions or brain regions um to understand how these are are differing uh differing Um so one uh study actually just asked which connections um in the brain tend to be the most or least variable. Kind of nice basic analysis to do when you're first um when this you know you're first starting to um consider um what um dynamic features are um present. So um it turns out that as you might expect regions that tend to be very consistently correlated as parts of functional networks those don't have a lot of variability in time because they show up very consistently um by definition but other regions they seem to be more variable in terms of whether they part of the same network or not. Um and so you can actually characterize um those uh kinds of regions that are most end up shifting their allegiance between uh different networks. Um I'm going to skip this for now. But another way um that we can look at structure in the data um goes back to one of the analyses I presented in the last lecture which is to um see if there are certain configurations of uh connectivity that are represented in the data um uh often.
So this was um a study where they um took their fMRI data and you can break it up into these windows windowed connectivity matrices and then you can put those into something like k means clustering um and look at the centrids of the clusters that are detected um and they call these uh these uh states and you can do some things with this. So once you've assigned every window to the cluster it belongs to then you know within an individual subject's data you can ask how much of state three was there how much of state seven was there um in patients is one state represented more than in controls what was what did that state look like what did it correlate with and so these are the kinds of experiments that um uh people have been uh carrying out in this uh with this kind of direction and So one thing they looked at in um in another study from uh this lab which Vince Calhoun's group um was to look at uh the proportion of time uh subject spends in in a given state and whether that distinguishes between groups. So they had schizophrenia and healthy control subjects and they found that they could identify states where you know they were occupied more by controls uh than by patients and vice versa.
So now I'll kind of um go to a bit of a um ex extension of this method. Um but here we're going to move from chunks of data sliding windows down to individual fMRI time frames. And so our raw fMRI data we can watch as a movie, right? Um actually it's hard to see much unless you normalize the signals because um everything just looks like a brain. um uh in the raw form, but if you normalize the signals and you kind of just play out your data in movie form, it's interesting. You can see these patterns that are um playing out. And so just like you can take a series of connectivity matrices and cluster them and and and see what centroidids look like. Um you can also just do that with individual time frames as well. So I can unroll the frames of a movie. Um and I can take these as individual each one is an individual multivaried pattern and I can also enter those into some analysis to understand um what kinds of uh states are present. Um and so uh this is a nice illustration courtesy of your instructor Dr. Chen. And um in this paper um we actually looked at these co-activation patterns um in uh in a in a couple of contexts which I'll show in a second. But the idea is that um if you take these individual time frames um you can cluster them and you can find um you know the clusters will represent TRS that have a similar spatial distribution of activity. Um and so here's three examples and um these focus on um clusters where activity in the posterior singulate cortex is high.
So um one thing I wanted to emphasize here um in terms of what you know more information you can get from this analysis than a static connectivity analysis is that um if you were to just take the PCC signal use it as a seed and calculate on average what is correlate with that. Okay, you get a set of regions but in time when the PCC has a high signal activity uh high um you know uh activity level there could be one array of regions in the brain that also has a high activity level and maybe those are areas of the default mode network but at certain points of time you you might actually see like the PCC has a high signal but another set of regions also has a high signal so you're going to temporally decompose um this PCC's co-activation with other brain regions and that's um more information can get um from this data. So um just like in the um the the the correlation uh window correlation studies we can also characterize like in a given scan how prominent different patterns are these co-activation patterns. Um and one thing that um that she found here is that um in resting state compared to when you have somebody doing a working memory task for say 10 minutes um there actually seem to be a greater diversity of patterns that are represented and pro probably because it's a less constrained condition um compared to in a working memory task.
And so we can take this and ask you this is a framework by which we can ask similar kinds of questions about patients versus controls, different brain states, how um many states are uh collectivation pattern states are needed to represent a data set and whether that tells us more about the um dynamics of brain function.
So um this is one application from um study in uh actually was looking at depressive symptom severity and this was a a large sample of participants again with neuroiming data as well as um uh clinical measures and um a co-activation the the authors applied co-activation patterns analysis and found that um the more time a person spent in a pattern pattern where their activity was dominated by the default mode network relative to other externally oriented networks like a dorsal attention network, then it seemed that the worse their scores were um in terms of depressive symptoms. And so um yeah, this uh one illustration of how you can maybe apply these in clinical context um as potential biomarkers. So um one thing that the CAPS analysis kind of ignores is temporal ordering. So if we are just taking our individual time frames and we're putting them into a clustering analysis, it doesn't matter which one was where necessarily unless we start to look uh at that specifically. But um we can actually start to look at whether or not there are repeating temporal sequences of act of activity um in addition. And so um this is work from Shella Kyles's lab who's really done a lot in developing this area. And this is one of their early patterns or papers where they're proposing a a pattern finding method for looking for these spatial temporal patterns. Um and can find interesting like basically little u motifs in the data where you have maybe the activity of certain networks preceding um the activation or deactivation of others. And so again, this might um if we find these kinds of repeating patterns um in data, then that might indicate, oh, this could be something important that we can study um or something we might um think could be altered in a in a disease state. Um so zooming from 2009 to um 2021 um this from the same lab. Um they they um extended this work to look at uh large publicly available data set uh human conneto project data um and could um you know characterize the co-active or sorry these spatial temporal patterns that seem to be um prevalent um across individuals. And so um not going to really go into what all these mean, but um one thing you in addition to looking at the patterns on the cortex, you can also see what is going on in deeper brain regions at the same time, subcortical region, cerebellum. Um and so this is a this is a dynamic signature. It's it's represented as something static here, but there is a there is a um propagating pattern across these brain areas. And so um in some of the patterns they saw some brain stem activation like followed by some cortical activation. And so it's a fairly powerful analytic technique for for looking at these kinds of uh propagating waves. Um so in this slide actually I'm just presenting a collection of various methods um that uh have also been applied in the field. There are quite a few different approaches that have been developed um at this time. Um but uh one one additional class of methods I could mention is uh change point analysis. So in the sliding window framework you fix your window size and you just move that along. Um but why don't we let the data decide when some change happens? So um there are methods from statistics where you can identify points in time where the statistics of the data are changing.
um maybe that's the of the raw signals or of the the functional connectivity but um these groups have started to apply this to fMRI data and understand if we can uh detect these change points in a datadriven fashion. Um another set of approaches that people are applying more and more are based on hidden markoff models. So these are designed to look for um hidden states in the data and transitions between um different states. And this was um yeah some of the early work applying it to fMRI data.
Their their group also did um a lot on oh I'm sorry this is MEG data. So this is an MEG data they have extended to to fMRI since then. But um yeah can also characterize sequences of states and ask whether these can be altered and in certain conditions.
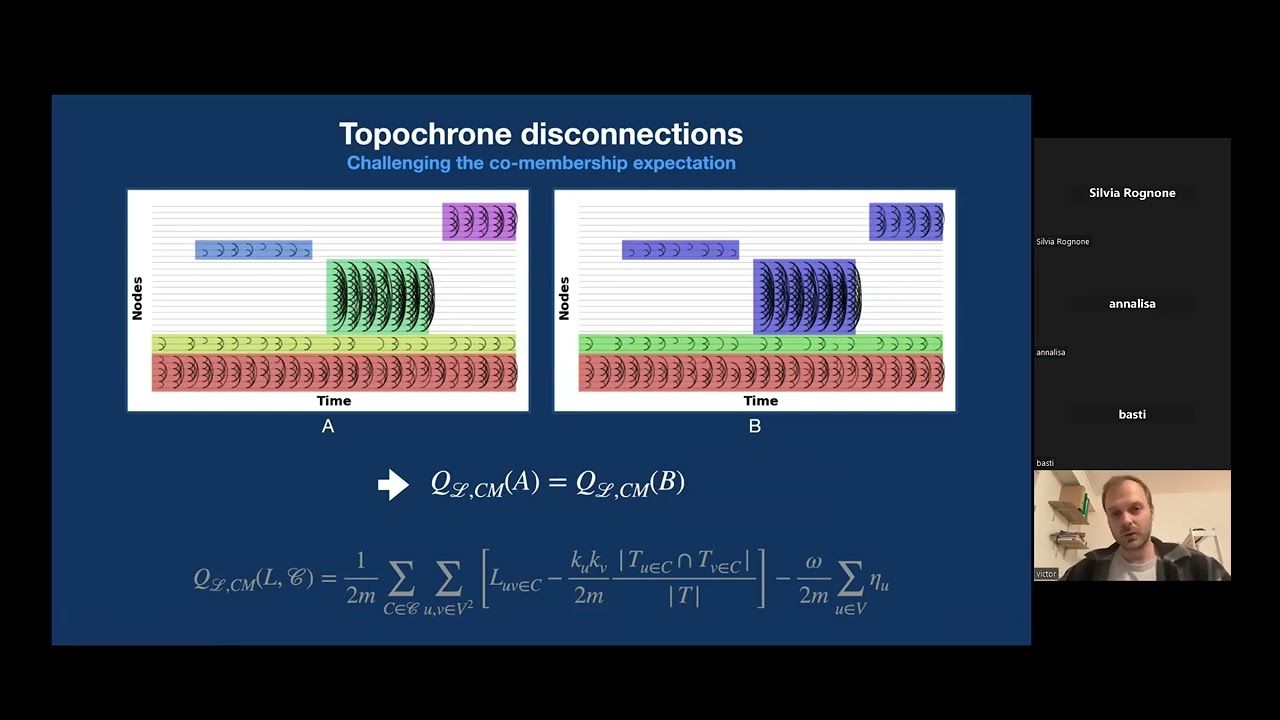
Um you probably talked a little about spatial ICA maybe. um temporal ICA is a variant that um people have proposed for looking at uh other aspects of uh the the dynamics. So instead of um finding patterns that are uh statistically independent in space um we can also try to find temporal modes that are statistically independent from each other um and and understand um what those look like. Um and for the network complex network type approaches um this can also be extended into the time domain. Um you can actually have links between uh different time um windows the networks that you find over these different windows and build multi-layer networks. So this is another rich area that's going on. So there's more too.
there is no um way to survey them all in a in a lecture but yeah so um feel free to interrupt me with any questions as well um but otherwise I'll just go on to uh this next part um where we're going to talk a little more deeply about um challenges in the interpretation and also in some of the anal analysis um aspects.
So um one question is um what you know do these changes mean when we observe them in our data. So um and how do we know that they reflect neural activity in the first place? Um and one reason to be concerned with that um for fMRI in particular is we know that there's neuron neural influences um on our signals. And if at any point in time you see that some neuronal um thing like some head motion is dominating over the signals you're getting the the real neural neurally generated signals then that is going to perturb the pattern that you're going to get in a window of time. Um and it becomes more more um severe as we go down to these smaller windows. then we're really sensitive to what is happening in the data at that particular moment in time.
Um and yeah so also interesting to understand uh the sources between behind these metrics and um knowing that there can be um spurious variability then another important direction that's arisen as people have started to do this kind of analysis is to understand how we can appropriately do statistical testing for these effects.
Um so in terms of uh non-neuronal perturbations um there are a few things that can cause some kind of a um a a change um in our data that affects something like a correlation map. One of them is uh taking a deep breath. So um in the extreme case if you take a deep breath and you just hold it you see this really large bold signal changes. You can get much larger bold signal changes from taking a deep breath than you can by any task.
Um, so if someone's not taking that many deep breaths, then maybe that doesn't matter. But if you happen to be looking at a window of time around the when someone is is holding their breath or taking a deep breath for any reason, then you can see um a change in the connectivity um of your data. Um I know that there may be um more lectures going into what you know how these effects manifest in the data. But um in the case of a a deep breath then um the kind of impulse response function that has um in fMRI is some initial increase followed by a more delayed uh negative dip across much of gray matter. Um and so thinking from the standpoint of connectivity calculations, anything that anything any effect where we are engaging regions in common is going to inflate our correlations between those regions. And so that would be the effect of this kind of manipulation. Um so yeah, it's actually um it's a good idea whenever possible. I can just throw this in there because I think it's a good message like um to record physiological signals um in your scans so that you know what's going on too so it won't be as mysterious if you see some change like that. Um another thing is that you can you know just want to highlight that you can get meaningful looking variations um even in random noise. So these are real fMRI time courses that I extracted from two different brain regions. Um and then over here um oh yeah if you take their sliding window correlation um h you can kind of plot what the the the yeah the correlation is between those two signals over time. Um but we can also make up our own time series by taking um white noise and we can convolve it with an HRF so it looks a bit fMRI like um and you can do the same windowed analysis and you might get the same amount of variability. So I just want to highlight that like the presence of variation itself is not automatically some interesting feature. Um and so if we want to make a claim about the amount of variation or or something else like the states or the co-activation patterns then um it's good to generate some appropriate um null model for whatever feature that you're interested in. Um and there's more discussed in in u papers like this. Um with sliding windows um you can also get some spurious uh connectivity effects that relate to the window size uh relative to the frequencies in your data. So if you imagine that your data are a nice sinosoid here, um you can this it's hard to tell because this is a little bit subtle here. So but this this has a little bit of a shift. Um if we just look at these two signals and we say we want to say that their interactions are not really changing over right time, right? They're just two sine waves with a with a phase shift. But if you start to roll and if you start to roll a window over um time um and calculate just the Pearson correlation then indeed you're not going to really see much variation but there's kind of tiny wiggles um because of the phase uh shifts coming in. But if we shrink our window size down and we repeat that analysis um then you can see larger um fluctuations in the connectivity values correlation values that you're going to get between these two signals because when your windows are small then the phase difference is going to count for more. Um and so um what are the practical implications of that? Um well it's been suggested that if you don't want to have these kinds of spurious windowing effects um then we want to use window sizes that are have have some number of periods of the um slowest frequency of our data in it so that we don't have any kind of component that's slow and are giving rise to this non-stationary effect. And so um it was actually recommended in this set of papers that you could highpass your fMRI data so that the window length like if you if you know you want to use a certain window length like 30 seconds or 100 seconds um then you could actually filter your data so that it doesn't have a lot of the slower frequencies um so that you're sure that you're focusing on the um the ones that are meaningful in the context of the window size that you're looking at.
Um also we want to ask you know what time scales um should we study um for looking at connectivity changes.
Um of course you know in terms of the analysis one trade-off is you know we'd like short windows but that would give us fewer data points um per measure. Um but also bold signal doesn't give us a lot of guidance in terms of what time scale we should study, right? It's not like we see these oscilly peaks in bold like we do in EEG alpha rhythm for example where it's like okay we can we want to look at algorithms um in fMRI data actually tend to have this one over ft type characteristic um and so we have contributions from a lot of different frequency components and um just from the data itself it's not so obvious what we want to what time scale we want to to focus on um and So I think the experimental uh question comes in into play here a lot. Um are you is it is it um are you interested in st something uh studying something that's playing out on very long time scales or is it something that you expect to happen um much more quickly. So that can also guide um what you're looking at. But in general it's kind of hard to say just from the characteristics um what what as frequency we should be focusing on.
Um, another approach I guess is to take a more data driven um, uh, avenue and say, well, I may not know what scale I want to look at, but I can actually make a portrait of interactions between brain regions across multiple time scales at once. Um, and this can be powerful visualization, especially when you're trying to understand um, you know, if you're if you're the first person trying to apply some dynamic analysis to a specific a specific context, you might want to get a sense of like where is the variability happening in terms of uh, frequency ranges. And so you might explore that and and see that um, you know, using a something like a wavelet analysis um, which decomposes um, in this case coherence as a function of both time and frequency. you may be able to see that um the the interesting changes are happening at certain particular frequency band. Um on the other hand uh you know just because we're talking about trade-offs um while this can be a really rich representation of our data there's a lot of information on these kinds of graphs. So not only do you have some magnitude, so firstly, not only do we have time and frequency instead of one value that says how correlated are these signals um but you also have across this plane um maybe a phase difference between the signals. And whether or not you're interested in all that really depends what you're looking at, but um it does give you the option to to look at all of these um uh relationships.
Um, when you're studying connectivity, um, it's always important to think about what's going on in the raw signals themselves. Um, because two signals correlated at point4 may actually have very different things going on in terms of their their time signatures. Um and so um and if you have an amplitude change um in the data then if and it suddenly becomes higher like much higher than the noise floor that might also um you know govern the kind of correlations um that you're seeing. So in some cases um you can look through correlation matrices. Sometimes it seems the signals are just not that much changing in amplitude but they are becoming more correlated. Other times there's amplitude changes mixed in. So um it's a lot to think about. This is like complex, but I mean it's just to to keep this in mind um when you're looking at connectivity values and thinking um there may be more to it may be important to kind of unpack any connectivity value and to thinking about what might be going on um in a more raw form um and connectivity. So we we kind of covered a a range of different methods so far in the examples that I've shown.
Um but there are so many different ways to represent uh data and even though taking correlations between regions is really common. Um sometimes a more um a representation that might be kind of truer to what's going on is something like an event or a traveling wave um or a frequency shift. And so I think that's also worth considering.
Um so for this last bit I wanted to discuss a bit more on um you know what are the sources of variation that are happening uh to that drive connectivity changes. So supposing that uh we're looking at neural uh driven bold uh signals um for now um recording other measures during the scan can be really helpful in order to understand that. So you as as illustrated earlier you can look at EEG oops you could look at cardio and cardiac and respiratory signals um you know physiological signals there's especially in resting state when you don't have a lot of active behavior it's really hard to get a probe into what somebody's state is.
So these these uh recordings are just so helpful to have. I'm always um happy when I've recorded them in a previous study because I it's it always gives um some useful information. Um I'm gonna skip this because we did that one last uh time. But um it when you're um you know going back to this topic of when you're maybe not able to record um measures um people have been asking you know how to the ex what ex to what extent can you use dynamic connectivity or activity patterns to track um someone's brain state and this was one of the first studies that at least that I'm aware of to to try this in uh resting state fMRI but in the context of sleep. Um and so they they did record EEG simultaneously with fMRI. So the EEG kind of provided this gold standard for what sleep stage a person was in. Were they in were they awake? Were they in REM sleep, etc. Um and then they took sliding window connectivity patterns and they asked if they could put this in as support vector machine classifier and match what they were getting based on the EG based sleep staging. Um and found that they could do that um pretty well.
So um so yeah uh people have actually in in the course of this like uh field um there have been like you know questions asked about what what these dynamic connectivity changes um mean and um and one um several papers have actually focused on the the effects that we you know spent the last lecture on which is arousal effects. Um but uh this one uh just to show another illustration um was asking how much the questions uh or how much the uh windowed connectivity patterns um relate to sleepiness. Um they again this is long scans with EEG but they could find that um yeah the global correlation patterns that appeared sometimes in the data um were indeed leaked with um states like light sleep.
Um it's also very interesting to investigate how um dynamic fri patterns connect to other types of mental processes and mind wandering is another one that is very prominent when people are in the scanner. Um but how do you how do you figure out whether somebody's mind is wandering? I don't know. Does anyone have any ideas? Yeah.
Yeah. Well, that's that's one um way to kind of interact with pro, but like if you have someone doing a task, like if they're kind of um lapsing in their performance, that that might be one contributor. Um it's kind of hard to tell, but this study actually kind of just presented some probe every once in a while. So, they kind of introduced this additional task that asks, "How much was your mind wandering just now?"
and the subject had to make a response.
I think they kind of ignored those parts when they did the data analysis. But um here they just kind of ask them at certain points during the scan or you can give them a questionnaire um to ask afterward. It's really hard to kind of probe these internal states. So um without disrupting the system, right? So um this is actually quite challenging to do research in but um I think this uh this the study they looked at the the amount by which they were daydreaming and um you know saw that this correlated with the amount of correlation between the parts of the default mode network.
So we find this really interesting.
Um and I focused this you know a lot of this work on um resting state data but you can actually look at experimentally induced changes in um connectivity or in any other dynamic metric as well. Uh these are two examples and in the first um one they actually had people watching sad movies in the scanner and they were actually interested in affective responses. So they would isolate sad scenes in the movie and then look at limbic network connectivity. Um but we're also just interested in the dynamic behavior of the lyic systems connectivity over the um over the course of the scan and how that me correlated with measures like heart rate variability. Um and in this one, this is a a pain study, um I believe. So they actually paint gave in a in an IRB approved way um pain to a participant uh over time and um you know tracking a brain response to pain is also really important question. So they knew that, you know, when the stimulus would come on, they could kind of track the dynamics as people's um sensation of pain maybe ramping up or going back down and uh you know the the the network um activity that uh goes with that. Um yeah, so this is uh the summary. So there's many possible methods that can be used to explore um bold dynamics. Um of course keep in mind that we are looking at certain time scales. Um they uh very very short windows analysis windows can be sensitive to um noise or other sparious variations. Um but there's increasing evidence that these descriptions of data based on dynamic features can provide useful biomarker information uh information that complements static connectivities and not just recapitulating the same stuff. Um and we can um design experiments where we study dynamics of uh network connectivity um together with specific manipulations um or we can study them with at rest. Um so some open questions I wanted to pose uh to in case of you are doing research on this. Um so one one thing that is consistently um that people consistently like grapple with is that you know now we have a lot of highdimensional uh features. Um so isolating the ones that are most relevant for a given scientific or clinical question is always um um important. Um and uh there are also other ways of getting spurious coupling between fMRI time courses even the absence of noise and artifacts. And so um how to best isolate dynamics um of functional relevance continues to be an ongoing question. Um and also there are you know it's not like brain some of the models suggest that the brain is like in one state and then switches states and things like that. Um but there's it's pretty complex. There's probably a lot of continuous overlapping processes.
There have been some models proposed that say um at a given time point or window there's a mixture of states and we can represent this mixture of states.
So um there are a lot of um overlapping processes that may be on different time scales and so um looking to some of the different analysis methods not all of them will be equipped to kind of handle that. So I think there's still more work needed on how to identify and disentangle overlapping processes. So um yeah, we shared the slides I think but yeah there put some references here in case um you want to see some of the review papers on this topic. Yeah.
[Applause] Questions.
anything.
Yeah. Well, I mean, if you're interested in looking at Well, I guess first um even if you know that there's some change happening on a slower time scale, but the signal that you're looking at is not directly uh tracking it, you can still remove the slowest frequencies and focus on what else is going on maybe in terms of the other frequencies during those times, if that makes sense.
Um I don't know if that kind of answers your question or um it's like but yeah there are slow real like naturally very slow processes and then maybe getting longer and longer scans is um as helpful for that but then um I guess depending on the time scales of what's happening across those changes you might have some analyses that look at the like you might do multiscale type analysis where you're looking at larger windows with slower variations and adjusting the window size to look at faster.
Oh yeah.
That's so important actually. Um and uh yeah this is a this is a great question.
So um the TR kind of so data quality always best we can get is is is helpful especially for these dynamic analyses but um for TR uh there's been a lot of interesting uh discussions and trade-offs pointed out actually uh Dr. has written a nice article on um you know as we go to so um when these fast fMRI techniques start to emerge that people think oh we can um we can uh you know scan faster and faster of course that has um other impacts on the ability to measure certain other features it may improve our ability to see some things but at the same time compromise others which I can't maybe summarize very well in a response here but it there are complex tradeoffs in in these so thank you for raising that because that's a really important point.
Okay.
Yeah. I mean, one thing is like, you know, it would be great that the more time points we get, the better, but yeah, it's not quite quite as um straightforward as that.
Okay. She could answer that though in another lecture.
Oh, yeah.
Oh
Up Next

28:49
Hypothalamus Structure & Function | Neuroanatomy Lecture
@DoctorNajeeb
335K views•2017-09-27
21:55
Deciphering Neural Circuits Controlling Anorexia in Mice | Richard Palmiter
@AllenInstitute
2.3K views•2011-10-10

4:10
Vagus Nerve (CN X): Anatomy, Nuclei & Functions Explained
@Alilamedicalmedia
305.2K views•2022-10-31
13:03
How Exercise Benefits Your Brain: Science Explained
@TED
11.4M views•2018-03-21
Related Study Plans & Knowledge Roadmaps
Structured learning paths in Neuroscience
neuroscience
Appetite Regulation: Brain Circuits & Hormones
01Foundations of Endocrinology and Brain Anatomy
02Introduction to Energy Homeostasis
03Peripheral Signals: Leptin, Ghrelin, and Insulin
+ 2 more learning modules
14h5 modules
Explore Roadmap
neuroscience
Neuroeconomics: Value, Risk & Brain Mechanisms
01Foundations of Neuroscience and Brain Anatomy
02Introduction to Neuroeconomics and Subjective Value
03Dopaminergic Prediction Errors & Reinforcement Learning
+ 3 more learning modules
18h6 modules
Explore Roadmap
neuroscience
Spatial Navigation: Cells, Grids & Brain Maps
01Foundations of Brain Anatomy and Memory
02Place Cells and Head-Direction Cells
03Grid Cells: The Brain's Coordinate System
+ 2 more learning modules
12h5 modules
Explore Roadmap
neuroscience
BCIs: Neural Decoding & Prosthetic Control
01Neuroscience Foundations: How the Brain Signals Intent
02Signal Acquisition: Recording the Brain's Activity
03Neural Decoding: Translating Brain Waves into Data
+ 2 more learning modules
25h5 modules
Explore Roadmap