






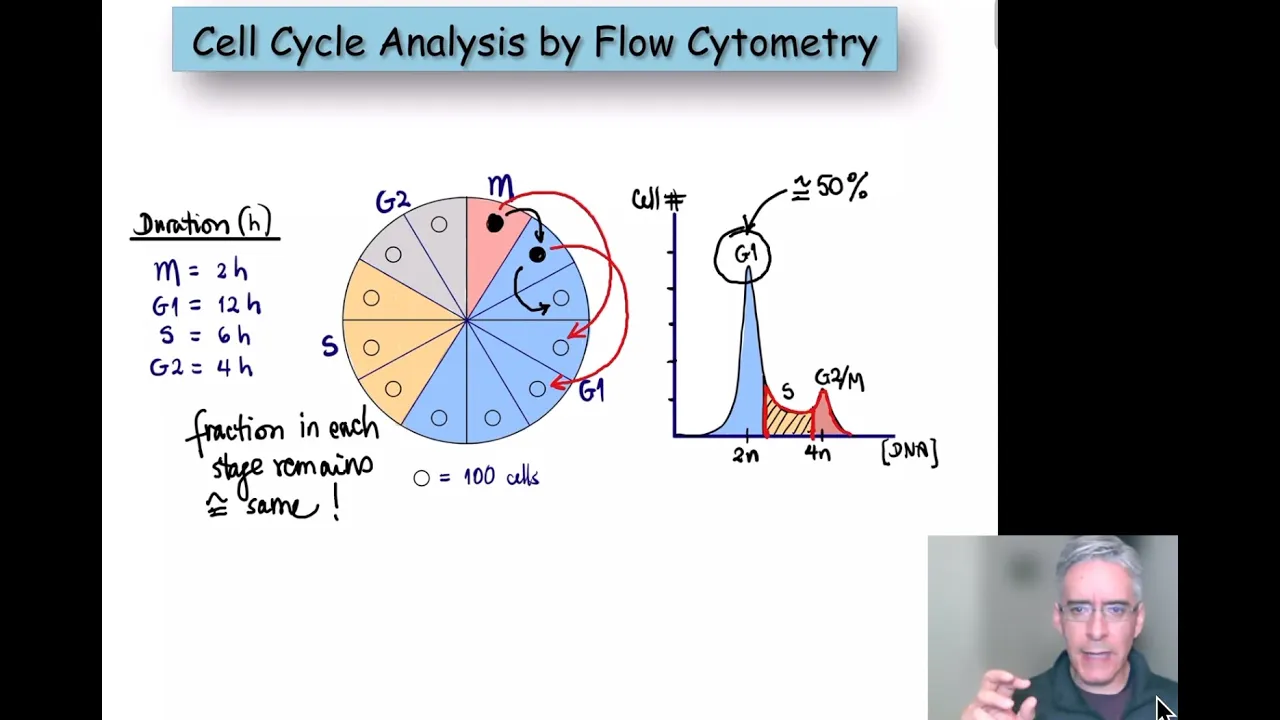



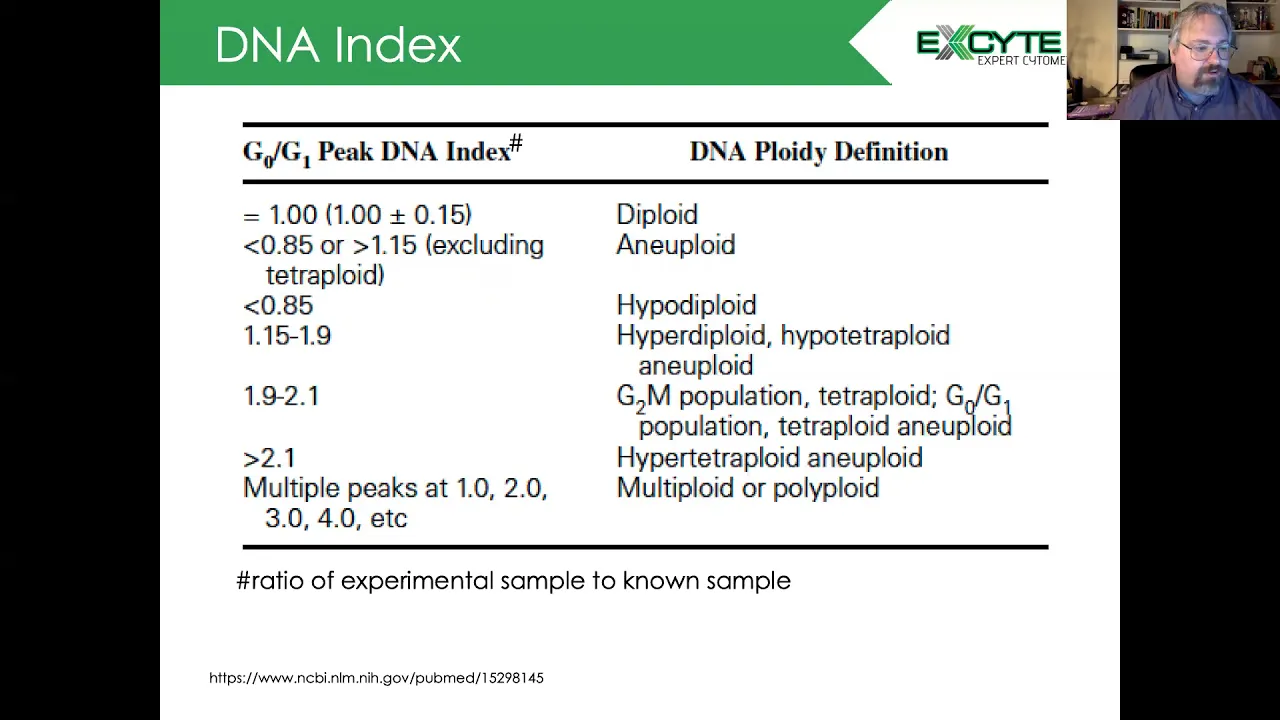








This tutorial covers cell cycle analysis using FlowJo software, demonstrating univariate analysis with PI staining and Watson/Dean-Jett modeling, bivariate analysis incorporating BrdU for improved S-phase resolution, and proliferation analysis using CFSE/CellTrace dyes with division index and proliferation index calculations. Key concepts include proper gating strategies, RMSD as a quality metric, coefficient of variation adjustments, and the importance of biological controls and experimental consistency.
FlowJo Cell Cycle & Proliferation Analysis Tutorial (MSKCC)
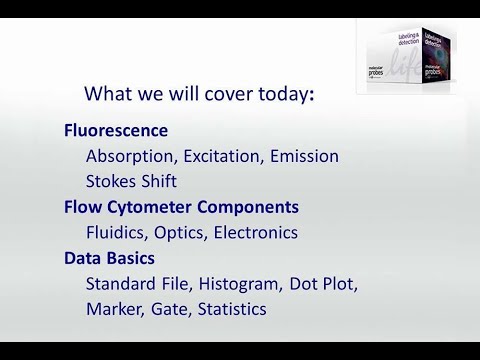
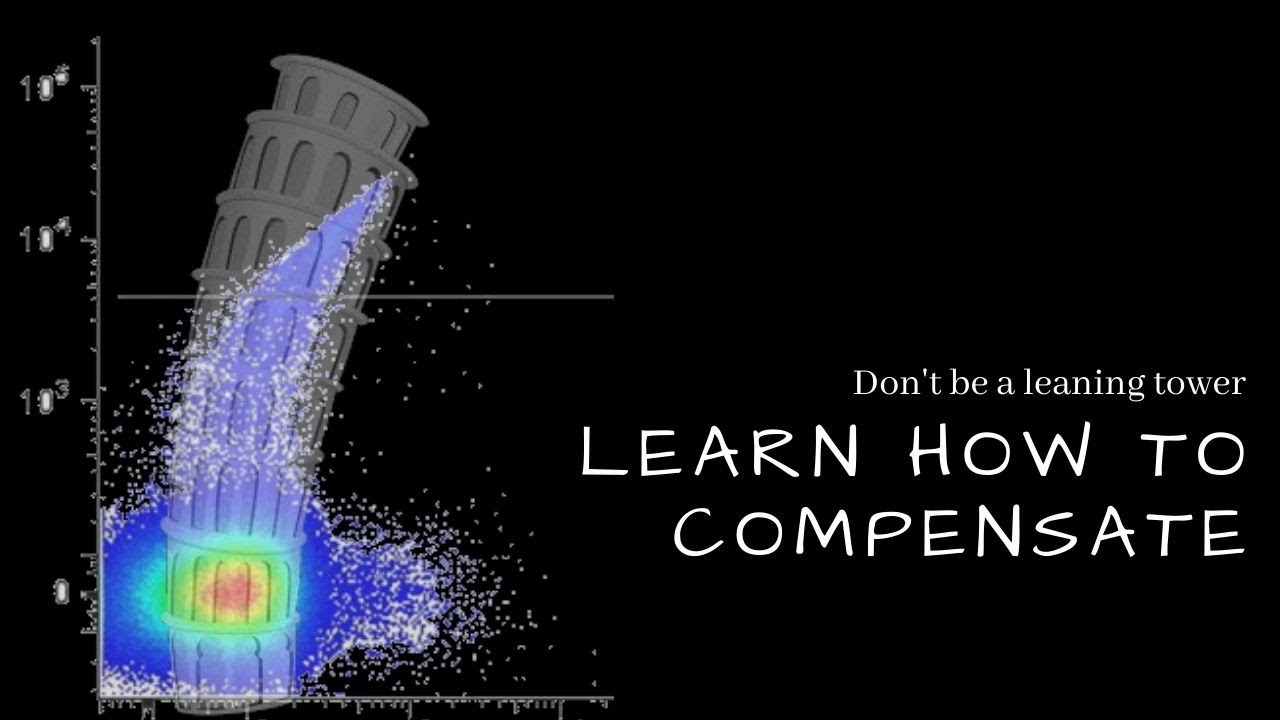
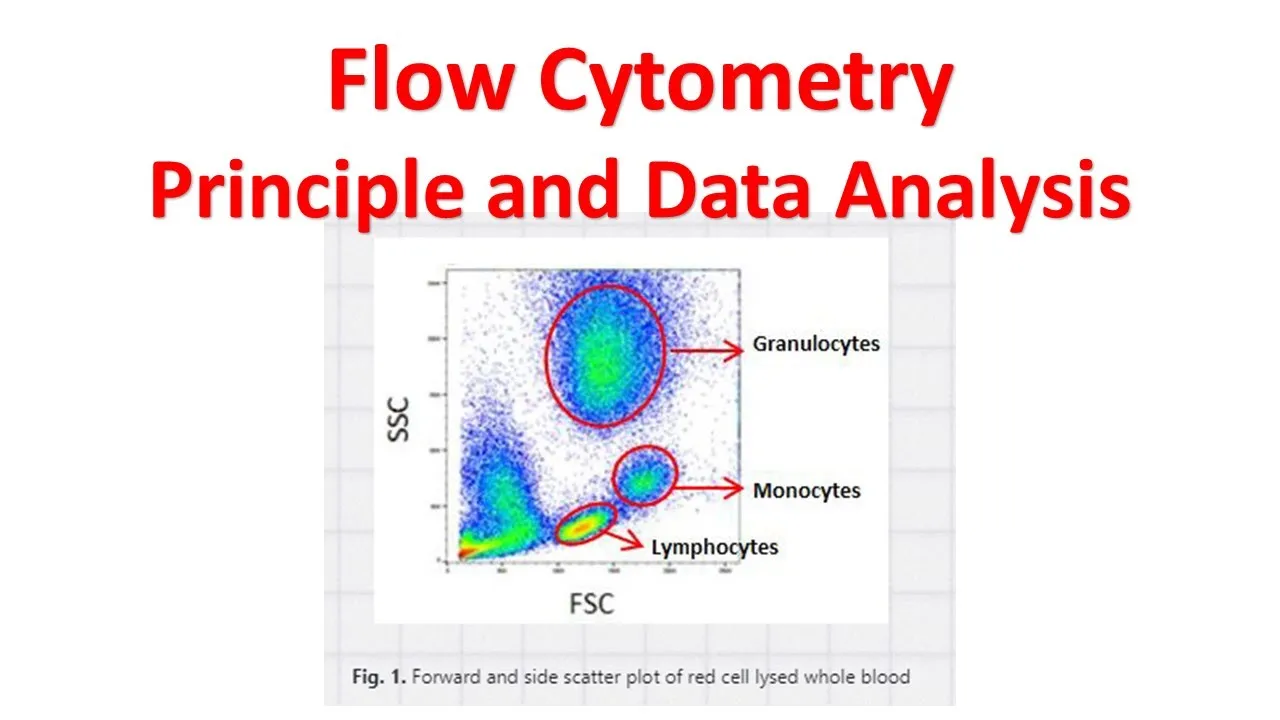
Added:Fundamental principles of flow cytometry, including fluorescence detection, compensation, and how to interpret histograms and dot plots.
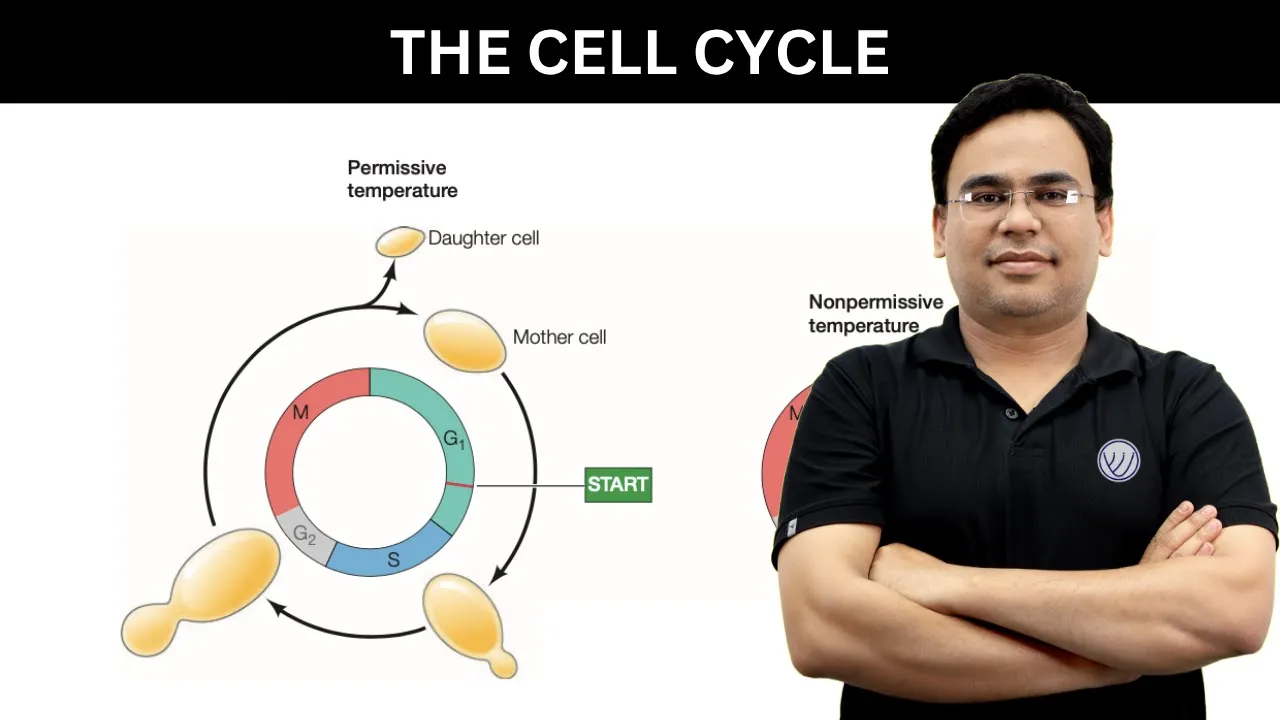
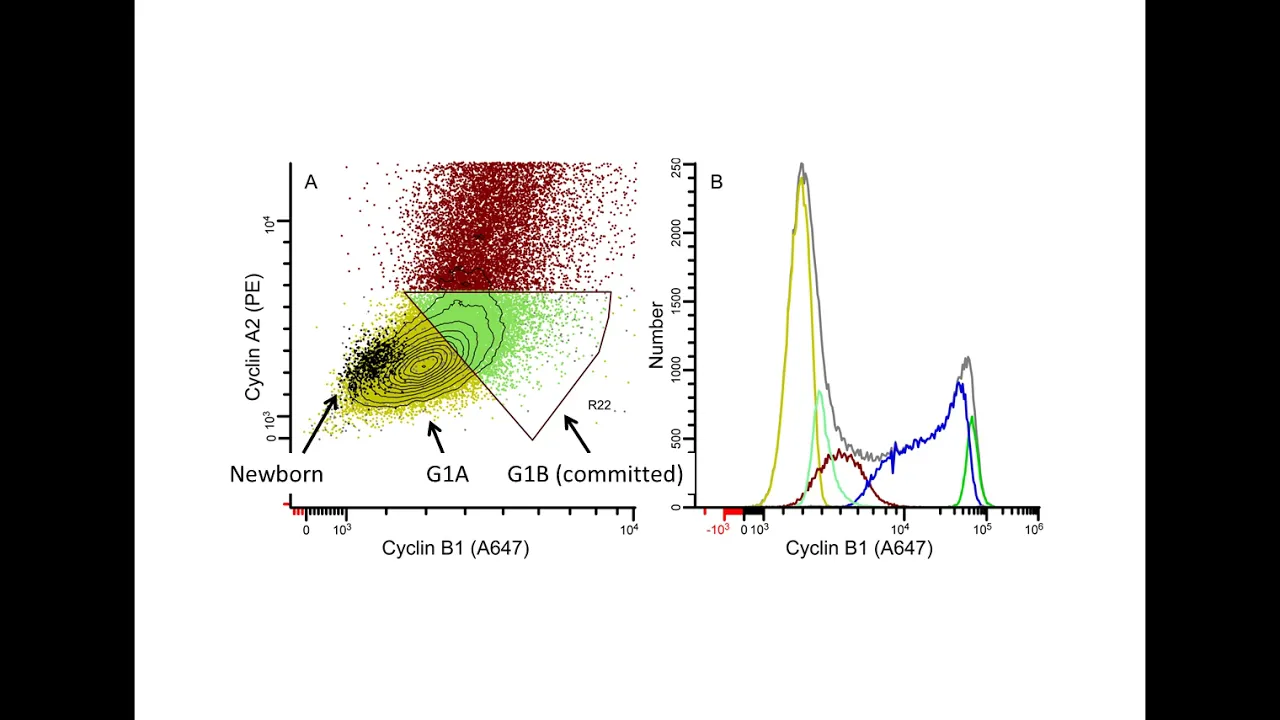
The biology of the eukaryotic cell cycle, specifically the molecular and physical changes across the G0/G1, S, and G2/M phases.
The chemistry of DNA-binding dyes (such as Propidium Iodide, DAPI, and 7-AAD) and how their stoichiometric binding relates to DNA content measurement.
Basic gating strategies in FlowJo, especially singlet gating (using height, width, and area parameters) to exclude doublets and debris.
Advanced multi-parametric flow cytometry panel design, such as combining cell cycle analysis with cell surface markers and intracellular proliferation markers (like Ki-67 or Phospho-Histone H3).
In-depth mathematical troubleshooting of fitting algorithms (Watson vs. Dean-Jett-Fox) to handle samples with high background noise, debris, or non-standard DNA distributions.
Designing and analyzing dye-dilution proliferation assays (e.g., CFSE or CellTrace Violet) to calculate replication index, division index, and precursor frequency.
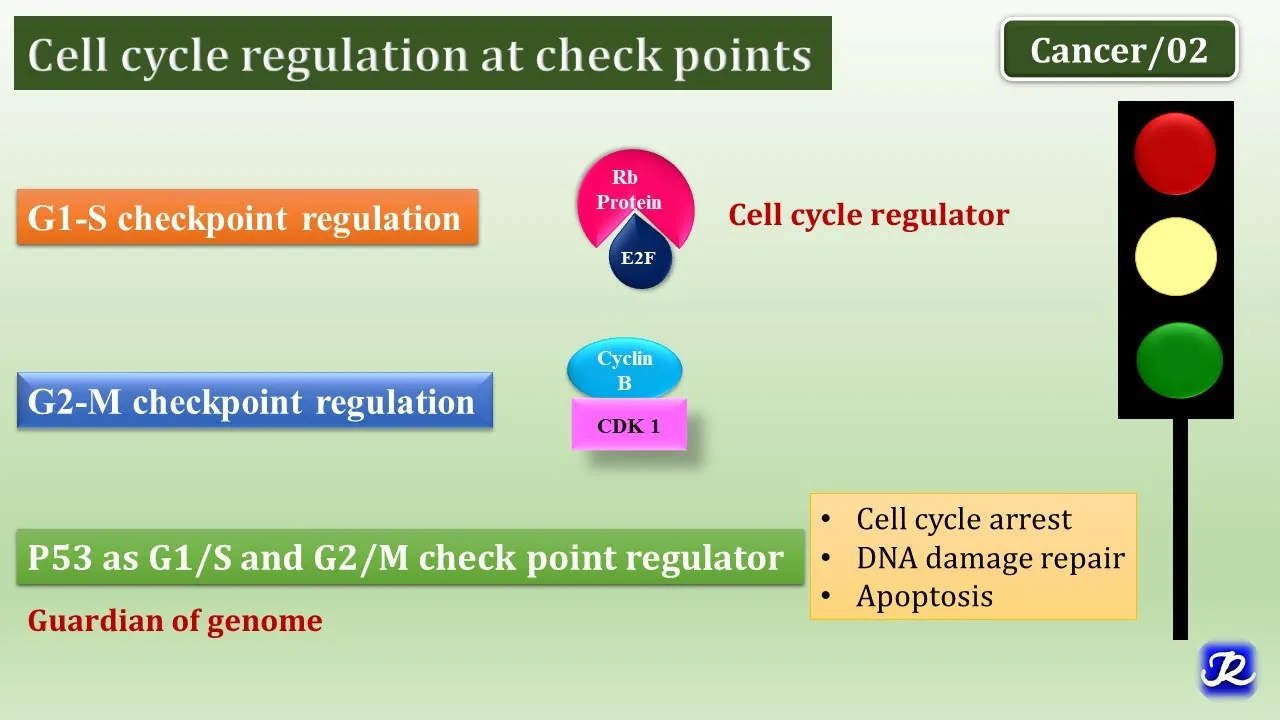
Applying cell cycle and proliferation data to translational research, such as measuring the efficacy of G1/S or G2/M checkpoint-inhibiting cancer therapies.
5.2K views65likes1:53:16Original Release: 2020-04-10
okay hello everyone so welcome to all of our attendees for our next session on the intro to to flo-jo held by the flow cytometry course facility at Memorial sloan-kettering Cancer Center you might have just heard the phone ring so as like most other people right now I'm currently working from home so pardon any miscellaneous noises that you might hear and we hope everyone is staying safe right now staying home and everyone is happy and healthy okay so with that um I should introduce myself for anyone that is just joining us for the first time today my name is Kathy Daniels and I work as the flow cytometry core facility manager at Memorial sloan-kettering Cancer Center you'll hear regardin also on the line he's the head of the facility and I'll say this throughout but if anyone has any questions as we're going along please feel free to use the chat function really we'll be monitoring that and as we go along if anything pops up seems confusing you need a little bit of clarification please go ahead and just use that chat function so again today is going to be on cell cycle and proliferation okay and some of the summary of the topics that we have today sorry we're going to be going over univariate cell cycle data so just for example dab epi and then we're going to be going over some bivariate cell cycle data with the incorporation of brdu okay then we'll review some of the different types of modeling for the analysis when you're looking at the universe itself cycle because there are different approaches to that and then from there we're going to move on and go to proliferation analysis modeling and we're going to look talk about some very briefly showing two different examples of different dyes that are available because there are an array out there some important that we want to stress to everyone that's coming and joining us flo-jo has made a license available for researchers as they're working from home due to the current pandemic and we thank them for that and for more information you go to flo-jo calm and use this specific hyperlink with the co good 19 license so thank you to flow jump then for the flow cytometry core facility website its FCC FM s KCC org we post all of the videos recordings video recordings of these sessions in addition to other educational content SOPs news of our facility and we also post these items in addition to announcements and other items on our twitter and our handle is Flo Emma's KCC if you're interested in learning more about cytometry we are want to stress that you can also visit the I sac website it's our International Society and they have also made Saito University free and available for people given the current scenario so we thank Isacc for that initiative and then Flo repository is a nice source to get FCS files if you're working from home but you might not have any files yourself to analyze but still want to go ahead and take a look at Flo Jo or any data analysis software some more important links that you'll see this there are two more that are here today that we usually don't have and that's a link to the proliferation and cell cycle analysis platforms and closure so Flo Jo has detailed explanations of some of the things that we'll be going over today so I'd like to reference that um for everyone to know that it's there to be able to get some more information then you have the cytometry part a Jo that's available for research into cytometry articles Metro flow is our local New York New Jersey flow cytometry users group so I encourage everyone to go and check that out we have two meetings every year we have a vendor meeting and then our scientific meeting in the fall so lastly I just thank you to David Gravano and the link is at the very bottom here the YouTube what you'll notice at the very beginning you had that text to FCS file with cell cycle and proliferation and thought that was pretty cool so I've been using that a lot and if you want to play around with some text or image to FCS files you can absolutely do that so the contacts to reach out to if you have any questions about this there's Ruby Gardiner who's the head of the facility again at Gardiner are an MS Casey Sea Org and then there's myself Kathy Daniels and the email there is Daniel K 1 at MS Casey Sea Org so this is a little bit clearer than previous slides where you can see that it's a 1 and not an L after and lastly we just wanted to thank our whole group I can't stress it enough they've been wonderful this whole time they're on this webinar to you I believe and you know I just want to say thank you to our group for being so great before all of this and now ok so now you can go ahead and we can start looking at some data so I move myself a little bit down here and I'm gonna go to my flo-jo icon right here on the desktop and most people are aware of this and I'm sorry if I repeat this every week but I want to make sure our new attendees are aware that flo-jo now mostly works from a portal ID login ok so it's not a hardware based login but rather a portal ID if you're working from an individual license it's a little bit different if you're working from a shared computer but for individual licenses you you still have to go through the portal ID ok and as I'm signing in for shared accounts you also still need the portal ID but that's a different different topic so I'm going to go ahead and sign in and it goes from unlicensed to a licensed version of flo-jo since I logged in with my credentials now what we're going to go over first is we're going to go over some cell cycle data so I have my folder here and what you'll remember likely from last time if you attended is if I open this folder up I have a couple of other folders that all have some cellular data in it from cytometry experiments okay and I've parsed this all out for what we're going to be going through today and the first thing I want to take a look at is some univariate cell cycle data now this is the title of the folder so what I can do is I can go ahead and double click and drag individual files in before I can come over here and add samples right if I click that it's going to ask me where I want to take them from but my preferred method that I like to do is I like to just drag in that folder and when I do that I get the folder name as a group do you need that group it's up to you we've had multiple discussions about this so I won't dive too deep into it so I'm just going to delete that because I don't necessarily need a separate group and I like to keep things a little bit cleaner so I just hit the Delete key on my keyboard to be able to do that and then I'm gonna X out of this file window right here and then we're gonna start looking at our data okay so I want to before driving too deep just say thank you to one of our researchers at Memorial Sloan Kettering for being kind enough to share some of this data with us I won't call her out by name because I'm not sure she wants that she knows who she is and we're very appreciative of her donating some of these files for analysis so what I'm gonna do is I'm gonna go ahead and I'm going to open up my first FCS file and it defaults to forward scatter inside scatter okay I can tell my eye that this was likely acquired on a beedi instrument but again a reminder for everyone cuz I think this is very important regardless of if you've attended previous sessions and I double click right here on this little circle it's going to give me some keywords from those FCS files or that FCS file specifically ok and when I come up and I scroll up what I see here from the cytometer keyword if I expand it's telling me that it's from the LSR for Tessa okay so just for people to be aware that can be very important and we might see that a little bit later on why that's going to be important all right so forward scatter side scatter what I first want to do is I want to gate on my cells of interest that I'm hovering over here with my mouse and I don't want to get rid of all of this debris there's not much to bring your background in the sample so it looks pretty beautiful but what I'm gonna do is I'm gonna take this elliptical date and click and drag and when I do that it automatically comes up with the name of lymphocytes and I'm just gonna change that to sound scatter I tend to veer away from from calling or from naming a population of cells are annotating it strictly by scatter I prefer to use CD markers but for this case this was just a cell line so it doesn't really matter anyway so I'm just gonna pull itself scatter and I'm gonna take that and I'm gonna drag it up to all samples when I double click here this is now going to show me from that same sample which is specimen 1 as your own time point it's going to just show me with what's within that scatter gate okay if I move this it moves in real time with it okay so any adjustments that I make are going to carry over there and again in here for the workspace you'll see that that is no longer bolded so if I say ok those changes I made I didn't really want to make if I hit delete there and yes on my keyboard all that happens it just it keeps that gate it doesn't completely delete it because it's owned by a group and it it switches it back to the position that it was automatically in or originally in rather so again I'm going to double click forward scatter area is going to be on X and forward scatter height is going to be on the Y and what I'm going to do is I'm going to do my initial singlet gate so I'm going to select the polygon option right here that's my preferred method for singlet gating to start off with but I want to stress that as we're doing this just to go back to the basics a little bit as you're doing these gates feel free to explore the different options so just because you're looking at forward scatter height area doesn't mean you can't look at side scatter height area or side scatter area with or forwards data area with those parameters all work in order to look at and discriminate for doublets or aggregates and cells the biggest or the strongest recommendation I would make is to explore all of those because sometimes you'll see it pulls out a little bit better in certain parameters and others per cell type or experiment so don't think that just because you have one favorite that it's going to excite at all just like dropping those little hints in for everyone as we go along so that I'm going to try and see if we can do a double doublet which we can because the user was wonderful and went ahead and and looked at a couple of different parameters here and enabled area and width for both forward and side scatter so you see here even though I did that initial singlet gating there are still a few aggregates that are left over here and when we look at side scatter the area with you can also try side scatter height with you know if they're kind of um and we can take a look at multiple of these in combination okay don't worry get into the cell cycle very soon it's just been one nice clean data so these are all things that'll help us get that nice clean data so then I'll I can't have two gates of the same name so I'm just going to do single cell side scatter you do too you can call it whatever your heart desires and hit okay drag that over and then what I'm gonna do is I'm going to highlight these two gates that I've created and I'm gonna drag it under cell scatter now what I'm ready to do is I'm ready to take a look at the cell cycle this experiment she was really just looking at cell cycle so we didn't have to hone in on any population than a heterogeneous tissue or anything like that so some people might think okay let me just take a look at this and then what I'll do is I'll look at my histogram of P because that's the the dye that this user had utilized for her experiment and if I do that and I come down and I select P I and then here you can simply select histogram what some people might think is that you can come in and expand this out and use your interval gating to start setting a G 1 and a G 2 peak and then from there go ahead and define s based on that that is something I want to stress that is not um stress is not best practice right because if I do something like that and I come in and I make this gate right here and I call that G 1 and I call this G 2 what kind of happening is we were visual creatures by eye right so we want to look at that and say all right this is roughly where it is this is roughly where it is but when we think about the histograms and univariate data and how that Falls if you follow my mouse what would happen in a normal distribution is this is going to kind of come over a little bit and this is gonna kind of come over a little bit so we don't have the ability to set those gates by eye to be able to accurately determine with a univariate set of data where my G 1 and G 2 and s phase actually lie so I just wanted to bring that up and show you something that some people might might be trying to do that probably wouldn't be the best practice when trying to analyze cell cycle data because we're limited in our capabilities as humans to be able to pull out that that univariate data okay so what I'm going to do instead is I'm going to click on this population and I want to look at the biology right but I skipped a little bit too fast because actually what I should do very quickly is run through and just check those gates before I go ahead and and start looking at the cell cycle modeling for all of this data okay so to do that I think I told everyone this trick before but if you hit shift and hold down shift on your keyboard and if all of these plots are listing the same sample so assessment Oh one 0 seconds dot or underscore 0 0 6 FC s once I start scrolling through I'm looking cohesively at each sample for all 3 gating strategies or the gating strategy for all for the sample in one picture and I'm able to just quickly verify that that looks pretty good I'm not going to get too crazy with it I'm sure I would have made some modifications if it wasn't just done a training session like maybe kind of I went in here and pull that in a little bit but I'm not gonna worry about those small changes today all right so then like I mentioned I can close this out now and I'm gonna go back and I'm gonna start looking at the modeling for cell cycle so this single cell side scatter right here that's the population that I want to start looking at the single cell data are start looking at the cell cycle data online so you'll see there's this little biology tab right here and if I click on that there are different options so there's two different options that we're going to be utilizing today but the data that we're looking at now is cell cycle not proliferation modeling so I'm gonna go ahead and select that cell cycle right here so what's wrong here it's telling us right now that we cannot calculate the model it's unable to calculate the model based on the inputs why is that okay if I was in that fashion I'd asked for someone to pop their hand up but I'm just gonna tell you guys the Dappy parameter was open but from what you saw previously on the dating that I manually put in her staining was actually with PI so if I select P I this looks a lot more like what we'd expect okay so this actually looks pretty good I will say I'm gonna walk you through some of the different things that are actually coming up here how to analyze this data and how to make any changes as you see fit if things might not pop up exactly the way want them to be so the first thing that I'm gonna do I'm gonna kind of expand out on those two options of model and constraints that we can talk about them a little bit deeper as we go through okay the first thing I do is I take a look at this modelling and I say right away is is the modeling fitting the data okay now when I when we ask that question it can be a little bit hard to determine you know just by eye and what we want to do is if we look at this the root mean squared value when we look at this the lower that value is the better the modeling is at fitting the model itself to the raw data so if we have a very low value which here it's one point one eight and you might say ok what does 1.18 mean made does it need to be 0 does it need to be 0.5 this the guidance by Flo Jose actually did that value they take it as someone acceptable if it's under 10 so there's someone competent or confident in the data if it's under 10 so this value of 1.18 is actually pretty good okay so this modeling has actually done a pretty good job at fitting this data to cell cycle model okay now the Watson model just to give you a very brief review what it does is it actually assumes a normal distribution of the peaks of either g1 or g2 and so it's that normal Gaussian distribution and then what it does is it assumes about a 1.75 increase like the the value of the g2 is about 1.75 of that g1 if I'm correct and it adds up how many events would be in that G 1 and then that g2 and then it subtracts that from the total number of events and that's how you wind up with your S phase okay the Dean Jett model is a little bit different so if I click on that Dean jet modeling what you'll see once I click on that it automatically is gonna switch to that modeling technique and here on that RMS that I was mentioning before the rmsd that number has gone up okay so that means that fitting is not as good as the Watson model now you feel free to play with this and feel free to go between models and see which one fits your data the best I'm not going to make a recommendation here on which one you should use the Dean jet actually fits through a mathematical function which is a polynomial to be able to get that that modeling of the data can I go into the deep mathematics of that unfortunately I cannot but we can always have an offline discussion about that if needed ok I just want you guys to understand that there are different methods for modeling this data okay so for the purposes of today I'm gonna go back to the Watson because I think that mom and not only think but I see that it's fitting this data a little bit better and what you can do say it didn't look quite as nice as this I'm gonna show you some different options that you can utilize to try and to try and optimize that that RMS okay before you do let me just remind everyone that if they want to ask any questions to feel free to to write them down in the chat and I'll be more than happy to to ask them to you awesome yes that is a very very good point you know and we'll be happy to answer any questions and do our best as you come through with them okay so like I was mentioning what we what we can do is we can actually make some adjustments as we're going along to be able to try and fit these peaks a little bit better okay so one of the things that you'll see in this plot right here is that I have the option to put in an interval gate to set a range so it's telling me it's a minimum a maximum range to define inclusion or exclusion of a single dimension but for our purposes if I just click on that what I can do is I can come in here and I can save that sorry do it again I can constrain that to be my g1 range okay now when I do that what you'll see is this g1 peak here now it has been set at a range and it's not unconstrained and strictly just based on the modeling okay if I go back to range what happens everything is disappeared I have no modeling the data's gone please don't worry about that you can simply just go back to unconstrained or if you hit range what you could do is just to find that range okay and say this is my g1 range you might have populations sometimes that pop up that are a little bit Messier that you have a lot of background a lot of a lot of crud that might come up it's a scientific term crud and those joke tragedy and when when you're doing that it might have a hard time finding it so you might need to give it a little bit of guidance okay now the other thing that you have the option to do you'll see that the RMS is actually pretty good still when I set it at that range compared to the unconstrained so there's really not much much of a difference there okay but the other thing that you have the option of doing is setting the CV for the g1 okay for this data I'm just showing you how to make those changes but for this I actually wouldn't recommend doing it so doc it looks looks very nice okay for the CV if I come in and what I can do is I can either say it's a value of n and define that CV myself where I can come in and say that that's my it's gonna be the same as my g2 CB what is my G - CB and how do I know okay up here it's giving me a lot of statistics so based on um based on everything that it has modelled right now it's telling me that g1 CB is five point seven five and my g2 CB is 5.63 typically because we're looking at this data in a linear fashion because it's its DNA and it's just g1 or g2 it's double the amount or you have polyploid that you know - double right the Seavey's of the data are somewhat similar between the g1 and the GG peak okay so if I come in there and I said alright you know what I don't want my g1 cb250 5.75 I think it's a little bit higher than that if I hit n it automatically defaults to one and what happens this does not look great anymore even though that RMS is coming at a very low level we have no g1 and we know that that's actually not correct so if I start adjusting this value of the CV of two or the coefficient of variation of that peak right and how tight it is I don't want 33 that's not gonna be good three I want you to see that the g1 is coming back we're seeing that population and this RMS is going down okay four it's going down even more I opened up an app I did not want to open up so are we Xing out of that in a second you can see that's an app that's not utilized on this computer okay and as I go up and on what are you seeing you're seeing that that RMS is actually going down so this is ways that you can go ahead and if there's a sample that's not fitting exactly right you can go ahead and make those minor modifications when the modeling itself is having a little bit of a problem okay over here and the graph option you have draw model son if I uncheck that it's not showing us that line that's showing the that pink fuchsia line that's showing us the fitting of the modelling the draw component takes away the g1 the ass and the g2 and then if the components are there but you don't want them filled and you just want the outline you can do that as well okay so just I'll let you know that those are all there the one thing that would be nice if it was here would be the ratio of the mean of G 2 and G 1 okay because what we expect is we expect to see roughly double the amount of G 2 as far as the mean as we do for G 1 I'm gonna show you how to do that with stats very quickly but that's the only thing that would be a nice fits in there but we could very easily add into the stats stats table okay these options are also here for g2 right so you can say that you want the g2 to either be a range that you said you know why that's happening okay might even cuz the question came through so it could either be a range that you set through that interval gate or it could be the g1 times n if I wanted to set that up and make adjustments there right now if I say it's exactly 2 and I exactly double the mean of g2 that it is for g1 you'll see that does not look great so it's likely a little bit lower than that and if I type in 1.95 you see it gets a little bit better oops click the wrong thing here if I type in 1.9 even better right so these are all things that you can do to kind of adjust and make your fitting a little bit better if you need okay if the data is nice and clean and it looks pretty good you shouldn't have that much of an issue but just so that you know these are all options available to you I'm gonna go ahead and set this back to unconstrained while you're doing that one of the questions the chicken just came up is regarding applying the same settings to all samples or you know can you adjust them for four different samples great question so what would happen is as I'm going along the next thing that I was actually going to do is that the perfect timing to that question is come in here and you can right-click and you can copy that analysis to the group right or you can drag it up to that same population now when you do that if I had made those modifications right so say I made the g1 peak for the g1 CV 1 and then I drag that up to all I believe that should carry over and you see right here it does so as I go through all these samples they're all going to be incorrect but I'm doing that to show you the drastic because it's so drastic and how you'll see that change how that adjustment will carry over to all okay now say I'm like you know what that definitely does not look good the CD I'm gonna let be unconstrained that I'm going to play the the Watson or the pragmatic modeling function go ahead and take care of this what I can then do and you'll recognize it this cell cycle little tab right here is no longer bold that's because I made a change to it right and all the rest of them are going to be back at once for the CV of that g1 peak so what I can do is I can right click and I can copy the analysis to the group or I can again drag it up okay so I'm going to show you the copy analysis to the group because I don't think I've actually shown that yet and I'm gonna replace the whole group and then as I go along it actually went ahead and made those adjustments so the second part of that question was can I go ahead and make changes per sample what I would say you might run into some a circumstance where there's a certain treatment we have a lot of background you have a lot of maybe subji one or any pop Kotik cells that are popping up and it gets a little bit messy and it's hard for the modeling to find in that scenario you might be able to go in and and make an adjustment and put in a range of the g1 but I would be careful what I what I'd always suggest and you'll see we always make all these all comments what I would suggest to do is optimize your experiment as much as possible right from a technical standpoint so that the modeling should hopefully work for all of your samples if you do have to make modifications understand you know there might be some some implications that Andrea please correct me if I'm wrong or anything like that work if you have any nothing wrong but if you have any any attic comments for that but what I'd suggest is if there's anything that's way different try thinking if there's a biological reason for that and it makes sense that you'd have to make some of those adjustments if not there might be a technical reason why something had happened there where you'd have to make some changes and adjustments sometimes I've seen people come and it might be their first time doing cell cycle and this peak that's right here at about fifty thousand might be shifting up and down and up and down and they feel like they have to adjust from each sample that is likely because they didn't keep the correct cell number or the same cell number per - and then there's going and if it's not in saturation with the the concentration of the dye what's going to happen is you're going to see shifts of that signal so as much as you can control your experiment from a technical perspective yes yes yeah it's important to note that you know we want to be as consistent as possible both in sample preparation and acquisition and then in analysis right so we don't want to change too many things from from sample to sample without a strong reason and we're not a good criteria for for that what Kathy is saying here is that you can have some changes some biological changes that you know one model won't be able to fit all of the samples because of those biological changes the thing is we don't know right and so again we want to be as consistent as possible and avoid that but if you see that the fitting is much better for one sample when you change the model compared to all the other samples where you didn't have to change the constraints then then really what's important is to have a good fit right and if you have a good fit then then the you know you're getting the best data out of the of the modeling so you know I would say I agree with Kathy we should be try to be as consistent as possible but there may be some reasons that that will lead us to to change a little bit the constraints from from sample to sample yeah especially if they're you know with treatments and stuff like that you'll you'll see some changes like I mentioned and I do have a data set that I wasn't going to bring out for in the main session but I'm pretty sure that I have a sample where it where it does adjust and there's like a pretty big increase in the sub g1 peat that you'll see and when I say sub g1 right this g1 peak right here in a nice controlled sample everything below that would be considered sub g1 and sometimes you see a hump here and what that typically is referred to as sub g1 where cells that aren't maybe starting to have do you make DNA fragmentation they're starting to undergo apoptosis you might see them there and that might throw it a little bit so if there's time at the end I could always bring that in after we do our second analysis right just let me just ask a question because a few people here have brought this up you know you went you went immediately from a simple data and and some people here asking you know should we address quality control of sample like looking at the time gate do we need it for more controls and compensation and even do we need to get out the dead cells you know the typical things we do with immuno phenotyping so my suggestion I have a couple of suggestions there so for a time gate we brought it up briefly during another session but that's something that's um that's always a good practice to do regardless to take a look at a parameter versus time right so I can show you how it looks like when we're if we wanted to check those out and there are certain certain different plugins that you can use to help out with that and flo-jo and that might be one of our future sessions utilizing flow clean or something like that that's available to help us out that's something that you always do want to be mindful of so you can do a quick check of that right so if I open up a plot and I look at time on the x-axis you can see here everything is pretty stable and I can do a quick run through and go through all my samples and be on the lookout for any drops in signal whether it's fluorescence or scatter or anything like that that might indicate that there's your a change in laser delay right or and laser intensity if it was based off of PI right so you see here there might have been a little bit of a blip they might have stopped the sample they might have paused it for a little bit at mo minded me to read or text this I wouldn't be super worried about but if I if I was we can always set a gate and exclude that but checking the quality of the sample by time is always a good suggestion okay now talking about viability dies okay now if you're worried about I've actually made the suggestion and I think this user have actually done that that you if they're fixing and utilizing if they're fixing they can always go ahead and use fixable live dead dye and stain it stain their selves with fixable live dead die then do the fixation and then do the cell cycle analysis this way they can pre gate out their dead cells okay that is an option it's not something that people always utilize but the more you can increase the quality of your data by ensuring what you're looking at are the live cells we would suggest that there's also some live cell cell cycle options that you can utilize that you wouldn't necessarily need need need that so that's my viability suggestion and then as far as FM all controls though it depends on what you're looking at so for this data set I don't need to look at an FM oh because when we think about fmos that's the contribution of multiple fluorochromes and you're having an issue with some spreading of the data and you need to be able to define where you're positive and the negative populations are for cell cycle if you're just looking at p i right or sorry when you're just getting out the dead cells excuse me and then looking at P I or Gabby or whatever it is you do not need to worry about an FM oh okay that's going to be if you're doing a panel of maybe a couple of colors there's some spread and then you're needing to better define positive and negative cell cycle is is a little bit different and you're looking at the linear data typically in one or two parameters any more questions or we're good on that front okay good so I'm gonna close out that and those are great questions keep them coming guys so now I have that cell cycle data for everything so for full of my samples rather so what are some cool things that I can do with that one I'm actually gonna go ahead and open this up again because I actually want to show you something else what we can do that I forgot to show you in the modeling you can copy the gates in the workspace okay so you see if one once I selected that here you see the the g1 the g2 and the S phase so even though my I was was close right it's still off by a couple of percentage points and I wasn't able to super accurately define the g1 and the dg2 peak which is why I wanted to show you that here okay so I can go ahead and delete those old gates that I made but it does give me the option to copy those gates and then if I open the layout editor what can I do if I wanted I can go ahead and drag in the g1 the g2 and the S phase as overlays or what I can do I can just drag in just some cycle analysis and when I do that I can expand this out what's nice about this and the reason I might like that a little bit more it's showing me the cell cycle it's showing me the fitting and everything like that it's showing me the different components with the fill and it's also giving me my statistics all right here it's telling me what percentage is less than g1 my sub G one population what might be considered polyploid if you're looking for that which is greater than p2 the Seavey's of the data and it's also giving me the means okay very quickly we already went over batch reports and everything like that we need to show the bivariate data and then the proliferation data so I'm not focus on this too much but what we should expect right and what I mentioned before is that ideally what we should see is that the the g2 should be double the amount of g1 so if I open this table editor right here what can I do I can say for this g2 I want to go to the workspace and I want to look at statistics so if I look at the mean of P I from g2 and I look at the mean of g1 for P i okay I could have left that statistic box open just wasn't thinking what I could then do is I can hit command on my Mac or I believe it's control on the PC and I can drag those into the table editor and then I can go ahead and I can edit I can add a column you guys know I love columns if you've been with me a couple of sessions now and you'll also see that I can cut my own hair at this point because I've done that in the past couple of weeks from home for attempted a joke what I did okay so apologize g2 ok so we have g2 and then what I'm gonna do is to divide that by g1 very simple all I want pick in Titleist I want g2 / g1 call it whatever you like I come back to the table editors I can create that table and because I only put in those populations that first sample it's only going to show up for that one you can see it's pretty close it's 1.85 so we have roughly double the amount of of Pi signal and DNA in g2 then you have in g1 so that's just a nice little QC method for yourself to be able to make sure everything worked okay okay I'm going to close that out I'm gonna save this workspace and by going to save as or we're just going to save rather and this it's gonna go into this session from today the univariate data so I always save your workspace is where your FCS files are and the other recommendation I'll have few quickly is make sure that you go ahead if you have files on the server try and transfer them to a local drive before you start analyzing or else you'll see that little circle going and going is it's trying to read from the server and back to your desktop so that's why I always work from the desktop whenever possible okay so next we're going to go over some bivariate cell cycle data so I'm going to open up this folder again I'm going to drag in bivariate cell cycle some bivariate cell cycle data okay now when I bring this in I'm not going to analyze all of these samples okay I'm just going to analyze one or two because I want to show you an important point here and try open this up I'm gonna do some the night gating you discussed before scatter and I'm gonna go a little bit quicker I mentioned this in the previous section there's an option in the Preferences where I can adjust where the Sanitation goes so I don't have to move it each time if anyone wants to see that later you just let me know and I can do that after so as I'm doing this um I'm gonna just let you guys know there's a reason when I talk about bivariate right cell cycle data I'll spoil the surprise it's going to be um if that's when we try and coorporate another marker in there for us to be able to pull out the cells that are in different phases of cell cycle right so for for this data we actually have brdu and the Alexus 647 is an anti brdu the brdu is a nucleoside that we put in into the cells and let them incubate and then after we can go ahead and after we do the viability and we do surface staining whatever is necessary we can come in with an anti beat brdu antibody titer for chrome to be able to pull out cells in S phase so that's what we're gonna see okay go back up to them this is the control right here so if I double click on this control and I look at P I that is a negative control okay so if I look at P I and a histogram that does not look so great okay so you can see for all of these it's not a super clear signal right so this one might be the best one and the recommendation that I would always have is to make sure you have a nice control population but sometimes you're staining might not look so great so how can the second marker help you out I'm actually going to delete this control actually not let's take that back um what I'm going to do is I'm going to take a look at the cell cycle there okay I'm going to look at the P I it's not looking that wonderful now I'm not wonderful it's not showing me any modeling right I can come in I can put in a constraint and I can set that as g1 right and I can try doing my best by saying g2 is going to be G 1 by maybe 1.7 I can start making some assumptions here and try pulling out some data 1.6 can I get this where it looks ok 1 I'm having a hard time with this right I might have to spend a good amount of time pulling out where's my G 1 where's my G 2 this data is not looking the best or what I can do I'm not gonna spend too much time on this I can open that sample up and I can look at P I and then I told you my Alexa 647 was against brdu now what do I see here I see something that looks much much better okay the first thing I'm going to do is I'm gonna use this transform button and customize the axis okay and I'm gonna go ahead and try it with you make that scaling on the negative end a little bit better sometimes it just scales up and that's okay if the populations a little higher and that's okay and I'm gonna make this a little bit bigger so that we can all see a little bit better okay now when I do that what do we see we see a very clearly defined Alexa 647 hi and then we also see this population here and this population here so so what is that right the brdu is incorporated on by cells as they're undergoing the division and they are they're in the S phase right so those brdu Alexis 647 positives are our S phase so by doing that what we're able to do I could do a polygon GI probably just on a rectangular gate but if I select Becky XA these my s phase not faj I'm not looking at a virus right now please okay and then what I could do is I could take a look and draw a gate or a my g1 and my g2 okay so by doing that I'm able to get bivariate data I'm able to get cleaner data and I'm gonna get a really good reading on a more accurate reading on my S phase and get more accurate statistics by looking at another parameter so that's something that I would suggest and that this research researcher at Sloan had started doing that pulled it out much better okay I can then go ahead and apply that up to the rest of them and start looking at this and making minor modifications as as I have to but if I try and compare this right here to a histogram it's gonna be way harder for us to pull out that S phase as things are starting to merge a little bit closer together just with the PI than it is with us looking it's a addition of brdu I do have another data set um with this where I can compare we can get the pie or the Madhavi rather cell cycle modeling to work and then we can compare numbers from that to to the through the actual incorporation of brdu and we can see the differences in that state and those statistics but what I'm gonna do is I'm gonna actually ask Ruiz advice on that one so do you think we should see that data set or should we move ahead to cooperation given the time I think unless people ask for that I think we should we should probably move on can I can I just ask you one of them is that somebody was asking about the doing the discrimination with with fluorescence is that something very typical to do when analyzing DNA cell cycle yes that actually is something you can absolutely utilize on if the if you have the height in area or on with selected typically on these instruments you just have to be careful about how you select it but if you have those parameters selected please feel free and you absolutely can take a look at height versus area so if it's pee eye height versus area you can do that in that data set that I had I don't believe that I could so the singlet determination by the height in the areas what we can do for that data set but we often sort nuclei for our users and we take a look at the defi height versus area and another little tip to help everyone out when you're taking a look at your cell cycle data what we do in our facility before we do any of those sorts is we throw beads on to make sure we can check the CV of the the QC beads on our instrument of quality control it to make sure it's nice and tight because reliable data not only relies on the technical aspect of your experiment and biological it also relies on the instrument performing up to its best standards and making sure it's nice and clean that the PMT is nice and the detector is nice and linear and also it relies on the alignment of the laser and all of that to make sure everything's right where it should be so keep that in mind and if you're a user or facility or a tents are all you can always ask those questions whether it's here at m/s KCC not my house beside a year or whatever facility you're in feel free to ask ask the people that are running your facility or you can always reach out to myself so you can have your own instrument and very quickly because somebody was really excited to know I think you show this in the in another session but where do you fall where do you change the annotation location in the preferences oh yes I'll show you that with the proliferation data because another thing I also enjoy very well so I'll bring that in and I will be sure to show you that so before we do the proliferation and actually bring the samples in I'm just gonna briefly show you two or three slides just to show you what some some common tips for proliferation and I'm also going to show you some of the stacks that we're going to be seeing and what they mean and remember we're going to be distributing these slides to everyone who registered to this class so I'm not gonna go into slideshow here but I'm just gonna briefly show you this is a flow poster that was put together by a Barbara Oliveira in our group on cell proliferation by flow cytometry so it has some nice tips on how to actually go ahead and look at cell proliferation by flow and it talks about the different dyes available you have the nucleoside analog incorporation with brdu or edu that's something that we just looked at with the cell cycle then there's also dye dilute dilution proliferation assays such as CF se or cell trace we're going to be looking at some of those today where they covalently bind to intracellular molecules like a means right and then they're inside of the cells and they can't get out right so they remain in the cells and as they divide each daughter cell has about half okay so that's very important to remember if the parent cell has 100 molecules you would expect each daughter totally each have half roughly okay and it should add up to a total value of all like a hundred percent where are one okay other type is cell cycle associated proteins such as ki-67 or pca if you're interested in any of these flow post-its you can visit our website or the Twitter that I mentioned earlier we have some statistical definitions this was all taken directly from the flo-jo website and it's reference down here it's from their version 9 website it defines everything really really nicely so I took it directly from the site I can't take any credit for this we're going to be focusing mostly on the division index and the proliferation index and we're also gonna be looking at some other things like peak ratio okay so I'll talk about it very briefly but the definitions are here okay and I do have an example we can go back to later that discusses how we kind of get to some of those numbers if we have the time I'd like to get to some of the data but it just goes to some examples of how you would get the division index the proliferation index and also how we understand starting cell numbers so for people that want to stick around later I'll go ahead and go through some of those statistics and the basics but just that you know we um we're going to be going over some of that at the end if you stick around okay so open up a new workspace and then we're gonna show you our proliferation data so if I open up that folder I want to actually thank John Queen from Flo Jo who helped me out and and sent some proliferation data and also Stella Tron from thermo who also sent me an FCS file showing their cell trace violet so I'm going to show you both of those today we're going to start off with the proliferation data from Flo Jo so when I drag that in wait what I'm gonna do first is I'm going to show that user who or the researcher who asked the option to go ahead and change annotation so if I go into preferences okay what I want to do first is I want to go into gates okay when I go into gates the annotation position right now it's showing as inside so when I draw a gate what's going happened as it's going to say the gates right here it's going ahead it's gonna put it right in the middle okay if I set it above its going to set it towards the top of that plot so I'm setting it as above and I'm gonna go ahead and hit okay now once you change those settings moving forward it should work out for you sometimes when you make changes in the Preferences you have to quit out of the out of the program and open it back up for its he sees I'm not sure that that's the case with annotation off the top of my head so if it doesn't show up exactly like that that's why okay so we have our unstamped ample right here and if I come in I'm gonna draw a pillow for a okay I'm not exactly sure what shelves of my interest I think that's some debris and crud I think those are likely my cells I had to make the guess um but this sample actually is stained for multiple markers so I'm gonna be able to pull out the cells that I'm looking for I'm gonna call that my scatter gate and I'm gonna bring that up to proliferation data we've discussed in previous session you don't have to start off with a scatter gate you can always start by looking at your viability versus TD marker of interest that is something I like doing that might be great for this but I'm just gonna leave it as is because I just already did it and you can see that annotation is now above if I scroll over what can I see I can see there's a change and there was a stimulation which can oftentimes change the scatter profile of a population okay so please be mindful that it is okay to adjust that scatter gating as you go between Havering you go between unstimulated and stand because as cells become activated as they're I'm certain people afraid they're very well might be a significant change in the scatter profile and the other thing here that you'll notice is the skeptic side scatters and log that is something that researchers commonly do there's nothing wrong with it if I changed it to linear through this transform button I am NOT going to be able to reliably gate there so I'm going to leave it in log okay open that up now we can take a look at the singlets so forward scatter with forward scatter area single cells drag that up okay I'm just gonna again for sake of time just do one single it gate should be okay understanding that you can do two now next thing I'm going to look at is I'm gonna look at the seven ad which is the viability here and then I'm gonna look at cd4 alright now we always want to run friends backs when I'm stained or an MMO because we're working from home I've been very reliant on the generous the generosity of people to be lending me data as to be able to work with you guys on this so I unfortunately don't have all the controls on that we might always be looking for but what I can say is I can say alright I see this population here those would be um actually yep my cd4 negative I also see mice 780 positive negative and then I have the double positive so what I want to get on is my live CD for all that live CD for okay because for this assay what they're looking at is they're looking at proliferating t-cells which is a common application okay let me go to the next one I could modify that gate and for this experiment in for this sample I'm just showing you an understand okay close that up we're happy with all of that and then what I'm going to do is I'm going to go ahead and I'm going to take a look at the proliferation so again I'm not gonna go too crazy into this but like I said earlier if I look at the proliferation die this one's a four six seventy if I look at that I'm just in a histogram what do I see I see that understand population is is nice and high it's it's up there and you you always want that control to be able to define where your undivided cells are and then when I go to the next sample which is one of the stamina populations you see a very nice pullout of different populations as they're dividing okay I cannot draw gates on that to be able to pull out how many divisions there are anything like that that is something I'm not even gonna try and enjoy gates on some people might look at data um you know versus another parameter or anything like that I still cannot pull that out so we want to utilize again that biology tool or a biology option right here and then instead of looking at cell cycle this time we're going to look at proliferation modeling so I'm gonna start off with my understand I'm gonna select that and I want you to be very careful because it's not every single time but it recognizes which parameter that you're supposed to look at okay so what I want to do is I want to change this GFP to the floor 670 die which that I know is my puffer Asian marker once I do that I know this is my own stem why does that matter it matters again because that's where I know I have my population of cells that are undivided because I haven't treated them with anything to stimulate them to proliferate so I click this here right there I drag along and I'm fixing that as Peaks zero I'm telling the software these are my undivided cells then what I can do I know it's been in our clocks going on um I can go ahead and I can copy that analysis to the group so this is pretty straightforward um if I come to the next one you'll start seeing that it starts to model that data okay does it look great right now it does not I'm gonna walk you through some of the things that we want to look at and how to adjust this that it's actually fitting the data correctly the first thing that I actually want to go ahead and do is I want to take a look at how many Peaks am I able to see by eye so with the mouse I see one which my cells that still have not divided two three four five so what we want to do is you want to take that five you want to add one and then what we can do is we can tell the modeling let's look for six Peaks if I hit six and then hit enter look what happens okay that data looks much better we can still go ahead and make some modifications but that data is now modeling really really well with this data set with these proliferating T cells now if I go back to four I should have pointed out to you we also have this root mean square value for the proliferation modeling again for people that have been with us since the beginning that root mean squared the lower it is the better it is at modeling and fitting rather the raw data to the mall okay so the lower that is the better your your modeling is at being able to fit to the raw data okay so keep an eye on that that's three point seven six I go to the six which is the five Peaks that we can visually pull out plus one okay now this looks pretty good to me I'm going to show you some tricks that you can use to go ahead and and modify this and kind of adjust it so that it's fitting a little bit better and before I do that I'm going to show you some options in the graph so here in draw model some it's very similar to cell cycle where if I put that in it's showing me how that modeling some is based on that red line as it's going through okay you can also show the peak numbers it's going to tell you this is my undivided divided population or generation one two three four five I'm gonna take that away from now this can be a little bit distracting and one of the things that um that you can do first is take a look after you've adjusted the number of peaks at that peak ratios okay so as I mentioned before what means that we have a starting population that's undivided that has a certain amount of dye paint for example it has 100 molecules as those two cells divide it's physically impossible or yet physically impossible for those two populations to each have more than 50% the peak ratio if it's above point 5 is saying alright my my two daughter cells each have 51% of that starting amount of dye that's impossible so we know that that fixed ratio or their peak ratio cannot be anything above point 5 so I'm gonna select here to fix the ratio and I'm gonna set that to 0.5 so I always want you to be on the lookout for that now when I do that what do we see the root-mean-square went up a little bit but this population right here has shifted and we're able to have a little bit of a better starting undivided population so know that I want you to take a look at that and make sure that your fixed ratio is correct at the start if I change that to 0.4 it's gonna look horrible so very minor changes have a pretty big impact so I want you to be aware of that change that back to 0.5 and I'm gonna look at the values that that best fit this data the next thing that I want you to be aware of is that it is important whenever possible that you have a population of cells that's stained for everything else with the exception of your proliferation die what's the reasoning for that right so if someone before mentioned FMOs so we have a couple of different flower Chrome's in here and you might see a little bit of spreading right it starts to define where our negative and our positive are and if I had a sample that had everything in it with the exception of the seafloor 670 what I would be able to do is I'd be able to look at that population and gate on the negative there and look at the statistics and get an idea of the background because having an idea of the background is going to help us to define where are where it would be possible to have our 64 670 and pull out between a floor 670 positive and negative so I don't have that for today but what I want you to do is I want you to use this example as an example for why you would want that okay so if I choose fixed background and I say if I had to make a very educated guess not best practice I want to stress this and I'm using as examples that you know what we want to do is to include a sample that did not have the e for 670 what I could do is I could say all right I think this MFI is somewhere around 500 for that for the that's where our negatives would be as I do that what do you see you see this modeling fitting a little bit better because it's having a better understanding of where the background would be for that sample okay as I make that adjustment and I go up to about 650 or so what are we seeing we're seeing the data is fitting much better and we're seeing that root mean squared value go down about 1.2 - okay so you can adjust this data you can also go around and adjust the peak C B's I think that these CDs aren't are fitting actually pretty well it's telling you right now that the pod the CV of each peak or the coefficient in the tightness of those populations around three point three three each if you wanted to adjust this say I want to set it at five doesn't look great they're too broad it's not fitting the data set that we have if you set it at three it's a little too narrow that might not be loving it - you see how it starts to kind of go way to way too small there so we can always play around with it we can fix the CV we can unfix the CV and you see once i unfix it and it sets it at about three point three three that root mean squared where the fitting of the raw data and the modeling is working much better now okay so these are all adjustments that you can make and you can make them to go ahead and ensure that it the the data is fitting correctly okay so there are some statistics here that we can go back to you it's telling you that the percent divided is seventy seven point one so that's saying that from the starting population seventy seven point one percent of those cells have divided drop my pencil then you have the proliferation index and you also have the division index okay I'm gonna go back here to our slides so that we can get a better definition so you have the division index which is actually the number of cells cell divisions or the average cell divisions that the cells will go under they've taken into account everything including undivided okay the proliferation index is actually going to help going ahead and it's telling you um work so yeah the proliferation and that's it's telling you the number of cells that have divided not including the undivided so or the average number of replications rather I should correct myself average number of replications for the cells that have divided so you have to ask yourself what statistic do you need from this okay do you need to understand from the whole population including undivided cells the average number of divisions or do you need to understand just from those cells that did start to proliferate what's the average number of divisions okay the the CV typically is somewhere between four and seven routinely for proliferation data we're pretty close about point three a that key crease ratio I mentioned it already it should be about 0.5 or so that's ideal okay so that's the proliferation modeling I do have another example from from Stella like I said that is the cell trace violet the reason I bring this up and I wanted to show you that data set as well is because it's important to know that it's not just CF se it's not just you know e for 670 there's so many different dyes available to you and just before I get going into that I'm showing you that second example before we open up for questions I'm going to show you a couple more things with proliferation okay Kathy let me take a vantage of that of that comment that you just made some people here we're asking about the comparison of different dyes you know in terms of durability you know maybe even brightness or or or their efficiency so do you have any anything to comment on that so as far as on brightness or anything like that that's going to depend on a couple of different things right it depends on what flora Chrome you're choosing it depends on your instrument it depends on the laser power it depends on the panel combination that you have if we're talking about resolution uprightness so there are a couple of different considerations there what I would suggest you to do is build the panel that you have to build keeping in mind there are multiple options for you with proliferation guys I do know that CFS II is pretty pretty bright and you do have to titrate it down that's my own personal experience from users that I've seen that the CFS II can be kind of screaming off the charts so and that isn't always a good thing keep that in mind that that's not always what you want um so be careful and be cautious of that but there are different options and I would say explore those options to see what fits best for your needs and your panel because typically when you're doing co-creation you're building a couple of other different markers into the panel right and you know if any of these are more or less sensitive to fixation more or less sensitive to fixation that I am I'm not super aware of I'm not sure if anyone else in has experience with that if they want to chime in I'm more than welcome to that to those recommendations but I don't have that myself you know all I know is that yes you can fix these um these samples with a fixing firm yeah kids but I don't know I don't know if there's data showing you know if some are better than others more and more sensitive to fixation or not and the other thing there that it's important to mention you want to titrate these dyes to is you want to make sure that as you're doing this you're you're titrating or optimizing for your assay and for yourselves make sure you're not overloading and in causing cytotoxicity and the other thing that you have to be cautious of that um you know we want to be mindful of is that there might be certain scenarios where the cells pump this dye out and you might have to take that into account as well so no the cells that you're working with know the biology understand that you might run into circumstances where the cells are pumping out you might have to treat with a certain drug to reduce that to be able to get reliable data so all of this does come with some caveats and you know will absolutely help as much as we can with them with helping out with that I suppose so another question here and I think it's um an interesting question what the bright btv from QC be inaccurate thallium for city of the proliferation populations I would say no it's not an accurate you know the CVS that you find in the beats are going to be different from what you find biologically due to the different distributions of the dye but it definitely you want to do you see just like you mentioned Kathy right with the NASL cycle you want to have the sharpest CDs as possible so so you do want to run you know these beats as a QC to make sure that your instrument is performing well yes absolutely yeah and and the reason why that you might not see or won't see the same CDs and beads as you was in full in cells is because those beads are are typically hard dye they have a very specific amount of a mission that's given off that's very allows it to be wonderful for us you can see our instruments so nice and tight and we know that we shouldn't expect variation in those beads so we have a nice tight signal a nice tight tight coefficient of variation where the cells are not beads right they're not hard dyed they don't have an exact number of molecules on there of of light that are given off or anything like that or photons of light that are given off as soon as the laser hits it so you have to be thinking all right beads or beads cells or cells are going to behave differently it's a great question but the CDs are absolutely going to be a bit different right right so so if we have a hundred cells that are all the same they wouldn't take in exactly the same amount of dye and that distribution or that variation would be typically larger than you would find in a bead yes I want to show a couple of other things and there's one thing I left out of cell cycle with a bit it's very easy to show you the proliferation as well so I just want to show a couple of different things before I show you the next dataset just to show you the cell trace quickly so we already talked about the model sum and the peak numbers right are you yeah because I think there's a here a couple of questions that I think are important too before you move on the you know one of the questions is why do you count or where you have six peaks were chosen rather than five don't counted that's a that's a great question on what winds up happening at the end is you see how it kind of tails off there so I use my hand but you can see kind of there this would not be one one peak and it starts to get a little bit harder at that low end to resolve so what you want to do is you want to say alright this is the number of peaks and I can very clearly define and then typically add one because the reason for this is you'll see this is not going to be this this is a low number of cells down here and it's harder for its results we have to kind of guide it and say alright you know that it's not going to be very easily visible for us but we know that this isn't just going to tail off like that what makes it a little bit easier for us to also do to define positive versus negative of that dye which would have been wonderful as if we had a negative so it didn't have that efore 670 you know but we have to remember that our eyes aren't going to necessarily pull out slight differences in those Peaks and I could also show you if I look at that um can I see maybe maybe here it's gonna be a little bit harder 1 2 3 4 5 and you can see how these are nice and tight and have that TV of around 0.3 3.3 you know I'm saying it's a nice tight CB I can't tell you that I think you would know that that's 3.33 but this population right here it's very real and you wouldn't expect this last population just to be as schmear and spread we assume that that's going to be a similar CV of 3.3 given the the way that the cells distribute their data distribute the dye and opposing in half so here you can see a little bit easier why we would put in six and not five right because we have this B cells right here and that's a lower number of cells that are proliferated and that are at that generation five and it's harder for us to see that via a univariate histogram but it's a little bit easier to see if rate of the doclock yeah and and and why so what if you don't have Peaks that are so well-defined so that's one of the questions here you know how do you feel confident in the modeling when you cannot see you know the fit that it fits so well that might require some some optimization um so if if the modeling does not look correct what I'd actually encourage you to do is understand that there are different even different packages out there so there might be different software programs out there that might fit the data a little bit better there might be biologically or technically some modifications that you can make to your experiments optimize it a little bit feel free to send us some data and we'll do the best that we can to help you or even if we're struggling more that we can also reach out some subject area experts what I'd first suggest to do is see if maybe another model at modeling platform pulls it out a little bit better or try and optimize the assay a little bit um via titration of the dye to pull it out right so it's very important that you know when your data doesn't look good and this is assuming you know that you've done everything correctly sometimes you know biologically you just don't get that those nicer TVs like you're seeing here but if it's something you know that you can improve in your in your sample prep and even during acquisition then definitely it's it's um it's much more important to focus on that and then get better dated than to try to then model you know bad data let's put it that way right because the models have their their limitations limitations exactly so it's going to be you know you can't you can't ask for for a miracle if the if the data doesn't look that good but yeah Cathy you're absolutely correct you need to try and see which constraints etc which parameters of the model give you a better fit and and look for that that's your your criteria right how good my fit can be and then just just go with the best fit my first my first first rates of optimization would be take a look at your your titration and and take a look to see if your cells are actively pumping that dye out whatever it is and you might have to look at add some reagents that you can add or drugs that you can add to prevent that I know that I've had experience working with polyploid cells wording of of live cells pata sites for some users and the name of the drug is escaping me at this point but you know we used host to be able to or the research or news host I sorted them but just worked with them to optimize their assay without the addition of of a certain reagent to prevent the II flocks of the dye we were not able to see the ploidy populations at all and that was no more for cell cycle or not philippa raishin but the similar [Music] can take the word it's it's a similar idea that we want to prevent this dye from escaping let me go ahead now and show you how to export some of these stats and again I want to stress that I didn't show you this exactly for a cell cycle but you would do it in the same way so first what I'm gonna do in here because I'm kind of done with this proliferation window once I select create gates I kind of love doing it because once we have that population and once we create the gates it automatically gates those populations automatically for us in the workspace I'm going to show you why I like that okay I'm going to close out this window I'm going to open up my table editor and what I can do is I can drag this table up or down and I can drag in the proliferation node once I do that it goes ahead and it gives me all of the statistics that I might want for the proliferation if I had this applied to a multitude of samples what it would do when I treated the table it would give me all this information and give me all of these stats what statistics you decide to use is up to you based on the biology of your experiment if I was in the cell cycle experiment again previously had been I just dragged in cell cycle and it would give me the same information okay I'm going to close that out I just want to show you that's an option what I can also do is I can come into the layout editor okay I can come in here and I can drag in that proliferation it's also automatically going to go ahead and it's going to give me the report where it's telling me it's showing me all the populations it's showing me the modeling and it's showing you the stats we've discussed this in previous sessions but I can come in here I can change the annotation and I can call this proliferation by floor 670 I can go and I can change what's showing up the fonts all of that I can make any changes here the other thing that I like showing based on this is I can go ahead and I can dragon proliferation population zero okay I'm gonna expand this a bit and I know everyone loves a good overlay so that's why I want to show you and then I can show you population zero and then if I hit shift and I drag down and I take a hold of all the rest of the populations and I drag them in it's actually showing me all the different generations from undivided to generation five in an overlay again we've discussed this in previous sessions but if you right-click sorry again this is a phone I could not unplug unfortunately if we go to histograms and we go to a half offset you can make changes you can make changes to the coloring and the weight and the style stagger offset there's all these different options but by doing that proliferation whoever just called got a nice little lesson on proliferation even as a telemarketer you can go ahead and you can make those changes that overlay but I really like that you can create those gauge just like you did in cell cycle okay now I'm going to also show you briefly in a new workspace see this one I'm just going to show you what the sell trace file it looks like and then I can go back to some of those slides and we can review anything that you guys are looking to reveal after that so new workspace I'm gonna go ahead in and this sample that we have so the cell trace violet it only shows um the proliferating data so you know I just bring it in to show you an example of another flora problem we would ideally want the unsterile for that but just to give you an idea of what another dye looks like okay and again thank you to to thermal for providing this where they were very kind and doing that so I'm gonna double click and open this up and the other reason this data is nice is because oh man all of the events are on the chart edges why is that we're gonna use that handy-dandy little option right here for this little circle so we can look at the properties and what I see is it's from the attune and the range here is about 16,777,216 million seven hundred and seventy seven thousand and I'm just gonna set it not the exact number but close enough I'm gonna do that for forward and side scatter once I do that that looks much better right we're much happier with that so I'm gonna go ahead and I'm going to get here on my presumed live cells these parameters weren't labels but I do know quite a few of them are so I'm going to double click on that scatter and then we're going to look at forward scatter height versus area come in and customize and for anyone that wants me to go over changing this and the Preferences please let me know and I'll do that after we did go over that in the intro session and those intro sessions are available on our website and they're also posted on our YouTube account single cells now do you know that the sl1 channel was 54 cd4 or not FL 1 that's an old way of talking about it it's the blue one channel an area so I'm gonna go ahead just put a population right there and I'm gonna call those own it's my cd4 positive and when I double-click on that it's the cell trace violet so on the attune that's off of VL 1 and you can see here go ahead and customize this axis and adjust the width basis a bit close that what we're able to see here is we're seeing these populations but again we can't look at it just based off of a histogram and set gates or anything like that or rather a histogram and set gates the other thing I adjust the width basis but what I also have to do if I customize that again I want you to remember the max is 16 million and it's not this value of 1 million so I'm gonna go ahead and change that and you can see the data is not off scale which is what we wouldn't want we want to make sure that's all on scale okay so if I come in here and go to work space or sorry tools biology and I'm gonna do the proliferation modeling again remember what happens if it doesn't go to the right um parameter initially you can go ahead and select this drop-down and change it so the l1 doesn't look great when we start what I can do is I can count the Oh what I didn't do ah this is actually a great little mistake I made um no I didn't think about it sorry I threw myself for a loop for those cd4 cells what we see is we have our undivided right here which I'm going to make that I'm going to say that that's my undivided assuming that I had had an unstained control that I had set right there I'm gonna count 1 2 3 4 5 6 7 8 hopefully eight and I'm going to set that number of Peaks to nine okay I'm going to look at that root mean squared and it went from 20 to about three point six three okay now this little peak right there it's likely about um that's likely our another peak so I could always go ahead and add in ten with that assumption but I want you to be very careful if this is the reason why you want to go ahead and you want to make sure that you have an unstained this way you can define your background okay the reason I brought this data in was to show you that there are different options to show you how beautifully it pulls out but remember we always want the appropriate controls because we need to define where's our background where's the positive versus the negative and also where's our unstimulated and you can see this data pulls out nice and pretty beautiful without that much the way of modifications and the root mean squared is about two point eight five so just wanted to show you that another example of proliferation data quickly and how um pretty quickly we can get it right in there I would need to help maybe hone it a little bit with the appropriate controls or I would definitely want the appropriate controls but then I can hone it and model that a little bit better and I'm gonna close that out and then I just want to show you briefly if everyone wants to stick around you know an example of the numbers that we get from proliferation cell cycle is pretty straight forward so we don't really need them an example on that but if we go and we look at the proliferation stats example that was provided by Flo Jo if we look at the division index in the proliferation index when I mentioned earlier is that the the division index does not is the number of times you would expect a cell to replicate if you took into account the cells that had not divided as well the proliferation index is an example of a stat where you're getting the idea of how many times the cell would divide if you're only taking into account the cells that have undergone a division okay so it's telling us here I can actually go ahead and do the slide show now you had 15,000 888 at GMG zero our undivided generation 1 2 & 3 so on and so forth how you understand the number of cells the start of the culture is you do the undivided as is right because that's how many that were to start and then as you're looking at on the divisions if there's 32,000 roughly in that division 1 population our generation 1 rather the starting would be divided by 2 generation 3 for 4 divisions or do it divided by 4 and so on and so forth and I have an example of that on the next slide ok tell me about that so you have an idea of the total number of cells that you started off with ok so the division index what we're going to do is we're going to take the total number of divisions all right again divided by the total number of cells at the start of culture so that's why that number is 0.66 because we're dividing the number of divisions by the number of starting cells for proliferation index to get a better understanding we're taking that number of divisions and we're dividing it by the number of cells that actually went into division okay so that's going to be the the number of starting cells from the culture with that initial calculation of 35,000 872 minus the number of or 15,000 888 which brings us to 19,800 or 90,000 984 and by getting that number we're then able to calculate the proliferation index which is higher and that's 1.18 okay if you want to understand how we got this starting cell numbers a little bit I just made a little slide that people might enjoy might not a much more hopefully you find it useful but the starting right if we had a thousand in that parent population of undivided then if you had five thousand in this division one or generation one population you divide that by two so that would be 2500 Jenner Division three it's a typo or degeneration - it's a typo would be divided by four right so if it's eight thousand eight with an ad two thousand and then so on and so forth right so as you go along you're making all those calculations and then you add all of those and numbers all those numbers together and what do you wind up with you wind up with fifteen thousand seven hundred and seventy starting cells I just thought drawing that in there and getting an idea what the calculations and why we're doing what we're doing might make it a little bit easier for people to understand and feel free to use those references take a look at the slides that I send out and also take a look at full Joe's website for a detailed description of some of that some of those statistics and also know that in the slides that I send out we all have a reference to a paper or a paper by Mario Roederer that discusses some of those statistics so please feel free to reference those to be able to get a deeper understanding as well I think was that we can open up for any questions you guys have stuck with us again we went past an hour again um I think it's pretty safe to say we're probably gonna be about an hour and a half each time or so so yeah open up to any questions and thank you guys all so Thank You Kathy wonderful again so there's a question here that regarding young stink controls if you have the understan control would you get out the autofluorescence first and then to find the Peaks how would you do it so if we had the unstained controller what I would ideally like for proliferation is to do a gating of the scatter single cells cd4 and then have a sample that's truly an FM oh right so have an MMO sample that doesn't have that proliferation marker in it whether it's CFS see whether it's an anti beer to you or whether it's a cell trace whatever it is take a look at that population so say for example our don't know if this is gonna work no way say for example I can't do it at this data set I would I would take a look at the population that's gated on the cells of interest and then from that population I would go ahead and I'd set a gate so say this is where my negative cells are let me say this is a negative base on an FM oh okay what I can then do if this was the channel that I was using for my proliferation I can come into work space statistics and I can go to BL three 6180 seven it's a very high number cuz that's not really wasn't on what we're looking at here and I'm just showing a mock-up and then I can fix that background at six thousand one hundred and eighty seven and the modeling software would understand that anything it needs to be above that value to be able to be considered positive for that proliferation die if that makes sense this is it's not a great example for me to be working from but just to give you an idea so there's another so one of the questions was so regarding to going back to the cell cycle data do you suggest using the old-style DNA QC particles like like the chicken erythrocyte nuclei or the cow farmer site nuclei as biological controls for the cell cycle experiments I yeah yeah yeah but then you know because them so that the common here is that they can be used this biological control sustaining for double discrimination series and linearity so to set up the instrument essentially um I've tried working with those before they could be a little bit tricky to work with I don't know if it's just in my hands because it's been a little bit a little while since I've been on the bench staining samples and everything like that I do at intermediate or intermittently rather I don't necessarily suggest those to our users I've tried them typically what I asked is for a nice outline control that's something that we have users that come in for um sorting they have their tissue that they are using to see a variety of different populations but they have their cell cycle and the cell line is a nice control for us to be able to see you know that are we're in a linear range and everything looks nice and beautiful and there are peaks are nice and tight so that's usually easy enough to have a nice cell line that you can like a nice healthy cell line that'll have a normal distribution of g1 and g2 and I think that should be sufficient if you're having a hard time with that you can always explore um you know the chicken red blood cells and everything like that but it's not something that I typically tend to use so I'm actually a question here from from one of our float ex-partners Joel's Hedstrom he was asking if whenever we look at the attune data do we look at hike instead of area because it seems to you know to look better in that way I was actually looking for our sales rep our thermal sales rep but I think she left just as he lost that question okay Joel that's an awesome question I have to be honest that I've never worked on a new tune and I just got this on this FCS file from thermo we can take a look at the at the height and see if it pulls out a little bit better so if we open that up and take a look you can always explore that I just haven't had much experience on on that instrument so if we open up the negative and we take a look at the VL one in height let me just adjust that axis there as well I have to adjust their sorry basis as well we can see how this TV's look there so it was about three point on our VL one in area it modeled it with a CV around two point eight five in our VL one and it modeled it the Seabee around 3.5 - I can take a look at the stats and go in and draw some gates and see which one pulls out better to try and understand it myself but I don't have too much experience with the attune it looks like both are modeling the way they should but there might very well be a technical aspect to preferring height for the tune in some cases good yeah right yeah another person was asking about the cell numbers for FML controls do they have to be the same as that of the samples on it all depends rate so if you're trying to get an n population if you're just looking at the cd4 positives you really shouldn't have that much of an issue getting a nice robust population of cd4 x' if it's a nice healthy sample to be able to to get maybe five or 10,000 of of that gated population when possible it's nice to have the numbers match up for to be able to get an understanding of that spreading but it's not going to be for this application super super critical right if you have Ken cells it's not going to be ideal to set and get MFI values off of a very small number I would at least recommend a couple of hundred preferably a couple of thousand cells gated for the FMO of that final population to be able to define the background but does it need to be the exact same number not necessarily for this application though right not necessarily but you know one of the things that's really important is so when you're when you're labeling with antibodies you have to make sure that the number of pathogens is relatively the same but it's more important in that DNA cell cycle experiment or even promoted yeah right to have the same number of cells when you when you when you label them right absolutely in this case the FMO doesn't you know if it's the FMO without the dyeing then then it's not as critical but as in best practices yeah it should be yeah right staining the same number of cells but it's not yeah not not critical as long as the cells the number of cells doesn't change too much the other the other question is if BR DUP I cell cycle analysis is always better and more accurate than Pio me cell cycle analysis so what I can do for that that's a great question I actually wanted to show that last data set so for anyone that's sticking around I think we saw a couple of people what I can do is I can show you that data set and I'm gonna go through it very quickly not waste people's time I'm gonna bring in his bivariate data very quickly going to show you why I think that I would suggest whenever possible to look at well I keep getting that coming up sorry whenever possible I would suggest going ahead and taking a look at the brdu and in combination scatter that up this one does not have this is a an old FCS two data set that was kindly provided to me by by John plan from flo-jo so um he was great and giving it to me I just can't gate for single it's unfortunately which would be important here but if I just look at Daffy and then look at the histogram and I look nice control here I'm gonna go ahead and I'm gonna look at cell cycle on that scatter population so it was great out because I didn't select the population so I'm gonna select cell cycle all right very quickly let's look at our RMS our root mean squared it's okay could probably be a little bit better for our sake this is not too bad I'll try and optimize it a little bit if I can constrain the g1 I'll set this e we maybe try and optimize it a little bit needs to be about 10 nope but again this this RMS actually is not too bad the g2 Pete and I can come in I can play with this a little bit 1.7 is way too low 1.9 looks a little bit better seen if I can just make that bit better but I think it's actually okay where it was I'm just trying to make the modeling as best as I can a brief period of time to show you why I think the air to you is better so let me go ahead and bring that I'm cell cycle up I'm gonna go along the RMS it's okay let me use this one for an example since RMS is is showing us that's acceptable our g1 percentage is 40.5 our S phase is 34 and our g2 is 18.1 so I'm gonna drag that along to the side modeling could be a tiny bit better but for the most part some people might see this or some researchers might utilize this modelling but if I take a look at this scatter and I look at Daffy on the x-axis and I look at Deer to you on from the Y and I change that to log this is our control without brdu it was just a little bit of a typo there and then when I go to the next sample which is this one right here it's one hour to one I can very clearly define my populations I'm not going to include the polyploid like that I'm gonna be a little bit stricter here and I want to show this so thank you for the person who asked us that question I should have put s-phase there but everyone knows from gating and I could use a polygon too but I'm just doing it for sake of time because I tend to be a little anal let me change that to s face oh well you oh you don't get it s faj okay when we look at these percentages what do we see g1 went from forty point five to twenty seven okay so even though it's giving us a pretty nice distribution the actual percentage of that g1 is is a little bit off there right um in this modelling and what we're seeing by the incorporation on this nucleoside of brdu is we're seeing that that S phase is actually closer to about fifty percent as opposed to thirty four so this is a really beautiful example of why we suggest for our users to incorporate you know another parameter into their cell cycle experiments to be able to more clearly identify through two parameters their different stages of cell cycle so sometimes you pull it out really beautifully other times it doesn't um pull out as nice as you'd expect with univariate if you're questioning it please go ahead and add in the beer to you for you that is that a good example rethink or yes I do think yeah a good example I mean it does show that brdu if you didn't pull it yes face apart from that VR do you plot that there is a huge overlap you know some cells that would be considered as g1 or not yeah and some cells would be considered you two directions in yes phase and then if you look at the the fitting you do see that overlap you know what it models it shows you an overlap between those this population so the are you really pools that it's face apart and enables you to get a much better discrimination of these phases absolutely you know I could have spent a little bit more time trying to optimize that modeling a bit and reduce that root mean squared but I think regardless if I had spent ten minutes on it five minutes on it whatever I spend I still think we're I still know I'm not even gonna say thinks I'm incredibly confident and that the addition of that brdu is going to help us you know more than we can imagine yeah so I have a question here that you know the person is saying maybe this is a stupid and not technical question regarding the proliferation exactly there's no stupid question regarding the proliferation analysis why divided cells display multiple Peaks is it because that the dye is only in the parent cells and the constant mother dying gets diluted every time the cells split maybe this might seem a little bit silly I'm gonna try drawing something because I like drawing stuff out to show people I'm going to hold up to the camera as I talk about it so say you have one parent guy and it has I'm going to draw a bunch of X's and those X's are gonna equate to fluorochromes so this is I'm gonna draw a parent okay and also it comes up backwards so I apologize but that parent has 1 2 3 4 5 6 7 8 9 10 nice I drew an even number 10 molecules of that guy then what winds up happening is xsplit that parent then becomes two daughter cells now what winds up happening there's a limitation to the number of to the die that's in there so when that goes and that goes to two cells what do you have you have the daughter one that has five and the daughter two that has five what would that equate to when we're looking at MFI this is one event that has double the amount that it needs two events so if I had a histogram then and we looked at count on the Y because it's a histogram and we looked at intensity on on the x axis and say the count was just one or two you would have and intensity so this population is parent population would be the higher intensity and if it's backwards I apologize and these two right here which have half the amount or they're there to count right and that's gonna show up a little bit lower in intensity because each of those individual cells has half the amount of fluorescence as that original so it's doubled in number but it's half the number of flora Prime that's in there because of the division of the cell I hope that's if that doesn't clarify it for you I'll try and on okay yeah but I think that's it for in terms of questions okay awesome we'll go ahead and we'll again did we've recorded this session so we'll upload it on YouTube today and we'll get it out to everyone we'll share the slides with everyone who registered regardless of whether or not they attended and we're working on next week next week's topic so hopefully this week will be a little bit better about getting out to what our topics may be for next week remember that that zoom link that we're sending out if you already registered for future weeks you're good to go if not that one zoom link is good for registration for whatever day you're looking to sign up for but we're going to continue to send that out in case anyone's forgotten to register for any days and and we'll distribute all of the information so thank you I hope everyone stays safe and thank you for being patient with all the phone calls and everything like that and have a good day okay thank you
Up Next

96:18
1948 Film The Luck of the Irish | Classic Romantic Fantasy Analysis
@UNIQUETIME_BD
22.2K views•2026-01-12

12:54
Triumph of Orthodoxy Icon: Byzantine Art & History Explained
@BenCallan
2.1K views•2024-08-06

9:49
FastAPI vs Flask vs Django: Choosing the Right Python Web Framework
@TechWithTim
302.5K views•2024-05-26

1:42
Game of Thrones Opening Credits: A Cinematic Analysis
@gameofthrones
46.3M views•2011-04-18
Related Study Plans & Knowledge Roadmaps
Structured learning paths in General & Interdisciplinary Studies
general-studies
Elevator Engineering: History, Physics & Cities
01From Hoists to Safety Brakes: The Dawn of Vertical Lift
02Hydraulic vs. Traction: The Engineering Physics of Elevators
03Modern Speed, Safety, and Algorithms
+ 2 more learning modules
12h5 modules
Explore Roadmap
general-studies
Rubber: Material Science, History & Geopolitics
01Origins of Natural Rubber & Mesoamerican History
02The Chemistry of Natural Rubber & Vulcanization
03The Geopolitics of the Rubber Boom & Colonization
+ 2 more learning modules
12h5 modules
Explore Roadmap
general-studies
Containerization: Evolution, Logistics & Trade
01Ancient Trade & Bulk Cargo: Amphorae to Barrels
02The Industrial Revolution & Cardboard Packaging
03The Containerization Revolution: Malcom McLean
+ 2 more learning modules
12h5 modules
Explore Roadmap
general-studies
Textile Tech: Evolution, Labor & Global Impact
01Pre-Industrial Textiles: Handloom & Cottage Industry
02Mechanization: The Spinning Jenny to the Power Loom
03The Factory System & Global Labor Transformation
+ 2 more learning modules
10h5 modules
Explore Roadmap