






















Automated Short Tandem Repeat (STR) DNA profiling is the current state-of-the-art method for generating forensic DNA profiles, which works by extracting DNA from biological samples, amplifying specific genetic regions using PCR (Polymerase Chain Reaction) with fluorescent labels, and separating the resulting DNA fragments by size using capillary electrophoresis; the technique can generate profiles from as little as 100 cells, produces results in just a few hours, and offers extremely high discriminating power with statistical weights described in quintillions and quadrillions, making it far more sensitive and faster than previous RFLP-based and PCR-based methods while maintaining superior ability to distinguish between individuals.
How Forensic DNA Profiles Are Generated: STR Analysis Explained
Added:Basic structure of DNA, including nucleotides, base pairing, and the distinction between coding and non-coding genomic regions.
The mechanism of the Polymerase Chain Reaction (PCR) and how it is used to amplify specific target DNA sequences.
Fundamental physical principles of electrophoresis, specifically how electrical charge and molecular size are used to separate fragments.
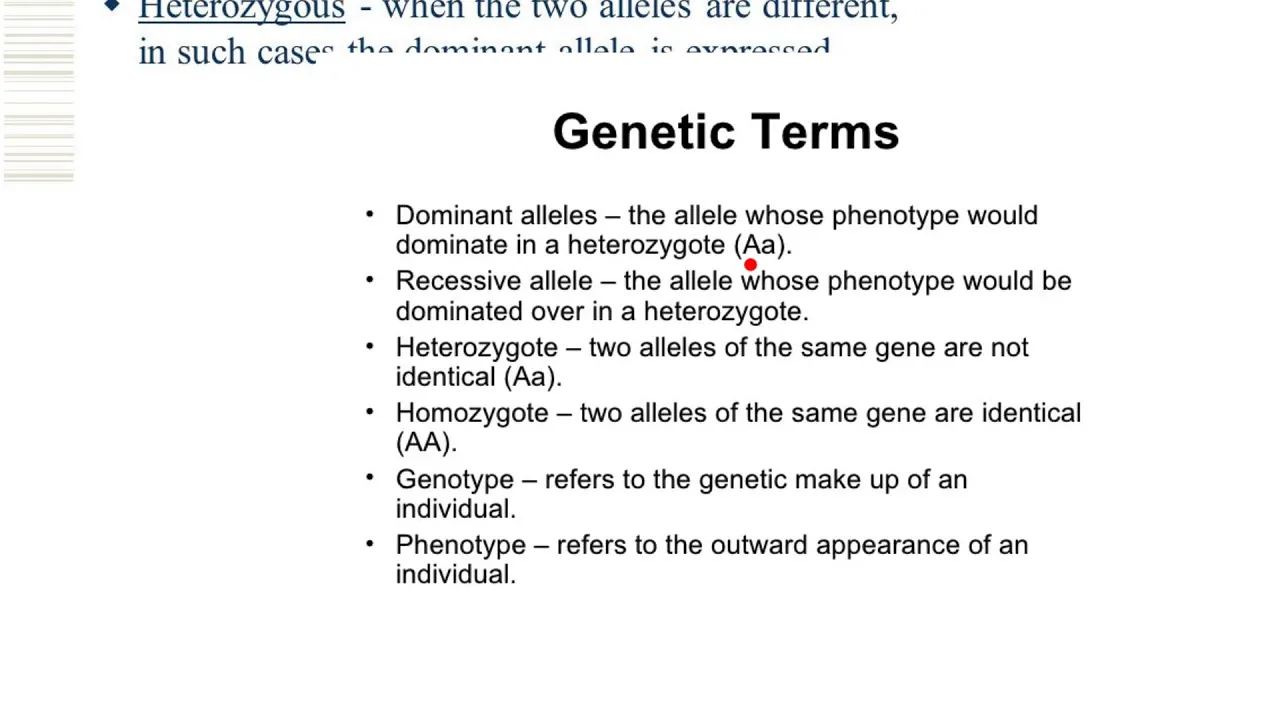
Basic concepts of genetic inheritance, including chromosomes, loci, alleles, and homozygosity versus heterozygosity.
Statistical interpretation of DNA profiles, including random match probability calculations and the use of the product rule.
The structure and function of national DNA databases, such as the FBI's Combined DNA Index System (CODIS), and how database searches are conducted.
Advanced molecular techniques in forensics, such as Next-Generation Sequencing (NGS) and Single Nucleotide Polymorphism (SNP) analysis.
The application of Investigative Genetic Genealogy (IGG) using consumer genomics databases to resolve cold cases.
Complexities in DNA interpretation, such as analyzing degraded samples, low-copy-number DNA, and multi-contributor DNA mixtures.
25.9K views248likes46:41Original Release: 2013-04-08
Hi, I'm Dan Crane. I'm a professor of biological sciences at Wright State University in Dayton, Ohio. And I'd like to talk with you for the next 50 minutes or so about how it is that you go about generating forensic DNA profiles. If you'd like to see this PowerPoint presentation on its own, you can find the file associated with it at www.bofforensics.com.
And you'll also be able to find there are quite a few additional materials that might give you greater understanding of what it is that I'll be talking with you about uh in the next short while. But with that out of the way, let's just get right to work and talk about how it is that crime laboratories generate DNA profiles for use in courts both within the United States and around the world these days.
Perhaps the best place to start is just with a quick overview of how it is that DNA tests have been generated for the past 20 or so years since DNA testing first appeared uh in criminal courts. Uh there have essentially been three different types of DNA tests that have been used over the course of the past few years, 20 now, uh for generating DNA profiles. In the very start, the first DNA tests were generated with a methodology that's hardly ever seen these days except in postconviction appellet cases. It's a RFLPbased test. It's a restriction fragment length polymorphism type of test. The type of evidence that was generated and shown to jurors was called an autorad or an autoraiogram. And it looked like these barcode patterns that you see on this particular example. In here, the relevant bit of information was associated with where these bands move.
That's what told us if an alil was present or not. And don't worry if you're not sure what an alil is. I'll be defining that sort of thing for you in just a few minutes. But that's what the original DNA tests looked like back in the late 1988s and early 1990s. Uh these tests took about a month, sometimes two or three months to generate results. and uh they needed a blood stain about the size of a quarter uh to be able to give rise to these types of results. Uh took a long time. Nowadays, at least in comparison, needed a large amount of starting material. And so there was clearly some room for improvement and essentially that left the door open for a second generation of DNA tests. These are the very first PCRbased tests.
Again, don't worry if you're uncomfortable with what PCR means. We'll be talking about that more in just a few minutes. But these very first PCRbased tests were called DQLpha or polyarker tests. Here the critical bit of evidence was coming not from an auto radiogram, a piece of X-ray film, but rather from a series of strips known as test strips.
And what we were looking for here was the presence or absence of these bluish dots. You can see in some spots the blue dot would appear in other spots they don't appear. the particular pattern of dots would give us some insights in terms of what sort of DNA molecules were present in a particular sample. Here's the thing, right? The first generation of DNA tests took about a a blood stain about the size of a quarter to generate a result.
Would take months.
These second generation tests could work with about a hundth that amount of material. Blood stains that were almost too small to be seen with the naked eye.
and results could be generated in the span of an afternoon. Right? So much faster and much uh more sensitive in terms of how much starting material was necessary. But there's a third criteria by which we judge DNA profiling tests.
That third criteria is discriminating power. And so while the first tests weren't very good in terms of their sensitivity and they weren't very good in terms of how quickly results were generated, these first two criteria, they were very discriminating. And it was possible to assign statistics in the ballpark of one in a million or one in 10 million is the chance of a coincidental match between a suspect and the true perpetrator of a crime if the suspect wasn't the source.
The second generation tests did very well in terms of sensitivity and in terms of uh the time needed to generate a result, but they didn't deliver as much in terms of discriminating power.
And statistics would frequently be described in terms of one of one in a few hundred or maybe one in a few thousand.
And that in turn left open the opportunity for a third generation of DNA tests. these automated STR tests, they're hitting a home run on all three criteria here. DNA profiles can be generated with samples that are literally described in terms of cells uh in the ballpark of a 100 cells is sufficient for most of the commercially available kits to generate a DNA profile much less than what could be seen with the naked eye and in fact verging on what it is you can see with a microscope. And they're also really fast from beginning to end. It takes just a few hours to generate one of these types of DNA profiles. And they're really hitting a home run also in terms of discriminating power. You'll see that these types of test results are often associated with statistical weights described in terms of quintilians and quadrillions. Literally billions of billions is the chance that a sample might coincidentally match a randomly chosen unrelated individual. So, this is still state-of-the-art to this day. They became popular tests in the mid 1990s, and they sure look as if they're going to remain popular for at least the next 5 to 10 years uh before they get supplanted by a new methodology.
STR tests or automated STR tests are what it is that I'll be talking with you about how they're generated for the rest of this particular video and it's also going to be the basis for all the other discussions that we'll have for the following videos in this particular series. But again, that's state-of-the-art for today. We'll talk about how it is we get those automated STR test results as we move along here today. But before we do that, let me also draw your attention to two newer kids on the block, so to speak, uh, as far as DNA testing goes. Um, these two other tests have been be increasingly popular and increasingly commonly used in forensic investigations. Uh, they are mitochondrial DNA testing and YSTR testing. Mitochondrial DNA testing.
these test results, these tests are actually more sensitive even than the automated STR tests. The principal reason for that is that while every cell contains within it two copies of all of our genetic material, one copy we get from our mother and one from our fathers, each cell that has one of those nuclei will also have associated with it thousands of mitochondria. And each mitochondria will have within it multiple copies of what's known as mitochondrial DNA.
The thing is the mitochondrial DNA is relatively small compared to the DNA that's present inside of the nucleus. So there's not as much information there for us to look at, but it is present in very high copy number and so it gives us the chance to even get results from a tiny fraction of a cell. The other drawback with mitochondrial testing is that all mitochondria are maternally inherited. And what that means in simple English is that an individual inherits all of their mitochondria from their mother and her mother in turn got all of her mitochondria from her mother. uh that in turn causes the tests to be very sensitive but not as discriminating because we know when we find one particular kind of mitochondrial DNA that there are probably many other maternal relatives at the very least who would have the very same mitochondrial DNA. In other words, mitochondrial DNA sequences aren't likely to be unique within the broader population.
The other new kit on the block are YSTR tests. Uh there are some parallels between YSTR tests and mitochondrial DNA tests. The YSTR tests are paying attention just to the STR markers, the particular locations that reside on the human Y chromosome. And I'll tell you what, you probably don't need a biology professor to to mention this or to explain this to you, but I can say with some authority that men and women are different. And the basis for the difference is ultimately in their DNA.
Women, I think we all appreciate, have two X chromosomes. Men have an X and a Y chromosome.
There's information on that Y chromosome that we can look at. And when we think that there's evidence, well, that there's a a male contributor to an evidence sample. why STR testing is something that might give us some insights in terms of what that male's DNA profile looked like without being distracted by things that may have been contributed by a female. That can be a very helpful feature when we're talking about a mixed sample such as those that might come from a rape investigation where you have a large amount of female DNA mixed with a small amount of a perpetrator males DNA.
But I said there are parallels between the YSTRS and mitochondrial DNA testing.
Here they are. Um whereas mitochondrial tests are matern whereas mitochondria are exclusively maternally inherited Y chromosomes are exclusively paternally inherited. I got my Y chromosome from my father. He got his from his and his father's father got his Y chromosome from my greatgrandfather.
uh there's a reasonable expectation that all four of those individuals, myself and those three progenitors of mine uh would have exactly the same YSTR profile. So the paternal inheritance causes us to have some concerns about just how discriminating YSTR test results are. Uh but again, they can be very useful when we're talking about a mixed sample where there may be a prepoundonderance of a female's DNA and we just want to get a good look at what was contributed by a male. But enough about those two new kids on the block, mitochondrial DNA testing and YSTR testing. Let's get to work talking about the automated STRs.
To do that, I have to start by talking about some background material. I want to get some definitions out of the way so that later on I can just use the jargon and the shorthand and not slow down to explain it as we go. So the next couple of slides are going to be talking about just some vocabulary terms. Let's start by talking about the kind of quantities of DNA that are necessary to generate a DNA profile. The bottom line is not very much. All right. And we'll cut right to the chase with this particular slide. Our bodies are made of trillions of cells. We leave cells behind in things like fingerprints all the time without thinking about them.
The kind of DNA that you leave behind in a fingerprint is plenty enough to generate a DNA profile using widely available commercial DNA testing kits. Most kits recommend that uh the starting material correspond to about the amount of DNA that you would get from as few as 100 to 200 cells. All right. And again, that's about the same number of cells that you might find associated with a typical fingerprint. So the bottom line here is we don't need a lot of material to start and we can get it from just about anything that's come in contact with an individual.
But it raises the spectre of just what a pogram is. I said that a typical cell has in the ballpark of 6 to 7 pogs. The minimum amount that's recommended by the manufacturers of the test kits that are used is about 500 pog. Let's talk just what that means in plain English. From our day-to-day lives, we know that a gram of sugar is about a quarter what it is you'd find in a sugar packet. like the ones you might get at a restaurant uh over the course of your lunch. So, a typical sugar packet weighs four grams.
A quarter of that is one gram, right?
That's a quantity, a weight that I think we're all very familiar with from our day-to-day lives.
A single crystal of sugar from within that packet is typically about a millionth of a gram. And if you took a millionth of a gram or a milligram and you split it up a thousand times, you would find that you're talking about a nanog. So a nanogram is actually a millionth of a gram. It's a thousand thousandth.
And if we took that millionth of a gram, a nanog, and we divided it up a thousand times again, what we'll find is that now we're talking about one of those pogs.
In other words, a pogram is literally 1 billionth of a gram. One millionth of one of those specks of sugar that you would find coming out of a sugar packet.
In normal human terms, an unimaginably small amount of starting material, but for DNA tests, that's plenty enough to get us started. Okay. Now, at the same time that we talk a lot in DNA testing about pograms, I'm also going to be using volumes. Pograms talks about mass, about weight.
Volumes, we need to talk about micro liters or millionths of a liter. So, this next slide gets us a little bit of an insight, a worldly sort of perspective on what's going on with a a microler. I think we all have experienced dealing with 2 L bottles of soft drinks, right? If you cut that in half, then obviously we're dealing with a liter. If you took just a thousandth of a liter, you would find that you get a milliliter. And you know, in practical terms, that's about the same amount of liquid that would that you would use to fill a thimble, maybe a smallish thimble. Okay, so a milliliter is a thousandth of a liter.
Interestingly, chemists will often have a precise meaning when they say add a drop of something to a solution. A chemist is often trained to know that that corresponds to 100 microl, right?
And a microl is actually 1 millionth of a liter. Okay? So a microl is something that you can see with your naked eye, but it's awfully small. So when a molecular biologist is talking about DNA in that context, we're usually also talking about poggrams and we're talking about microlers. And for better or worse, to follow what's going on with DNA testing, we need to be comfortable with those terms. Bottom line, a pog is a billionth of a gram and a microler is a millionth of a liter. Okay, now that we've got those vocabulary words under our belt, let me move on to talk with you about a few other very basic vocabulary terms that molecular biologists use when they're talking about DNA testing and forensic DNA profiling. So, let's start with talking about what is a DNA polymorphism. And I understand the word polymorphism may seem a little bit unusual and intimidating at a first glance, but it's really very straightforward. Uh the translation here is simply this poly is the word that we use for many in morphism. Morph is form. So what we're talking about here with a DNA polymorphism is quite simply a region of DNA that's very likely to differ from one person to another. And why does it differ from one person to another?
Simply because the DNA in that region is likely to come in many different forms.
literally later you'll see in many different sizes but for now let's just leave it at that. So DNA polymorphisms that's where the action is going to be when we're talking about DNA profiling.
There are many places where DNA between two individuals is likely to be the same. That might be important for giving us eyes and hair and fingers and so forth, but it's not going to be useful for distinguishing between people. We want to look at the spots that are likely to be different. the DNA polymorphisms.
Here's another word that's going to come up frequently when we're talking about DNA testing and DNA testing results.
This idea of a locus or in plural is a Latin word lossi. Okay, a locust is simply a specific location on a chromosome. In fact, the root words are are the same, right? Location, locus, right? There's some commonality in the sounding there because they have the same Latin root. All we're talking about is a specific spot that we're paying attention to along the length of an individual's DNA molecules.
And one last vocabulary word for this slide. When we're talking about a polymorphic region, right, a locust that has polymorphisms, what we're talking about is a region where we can distinguish between one version of the DNA that we might find in another version. In those circumstances, we're talking about two or more alals. An alle is simply a recognizable variant of a DNA molecule that you might find at a particular locus. Okay? So again, I apologize for the vocabulary, but it'll make things easier down the line if we're all using the same words to mean the same things while we're talking about DNA profiling. And these three come up time and again. There are two others I just want to go over quickly right now and that is this idea of PCR.
I've already mentioned PCR uh a little bit earlier in in this particular video.
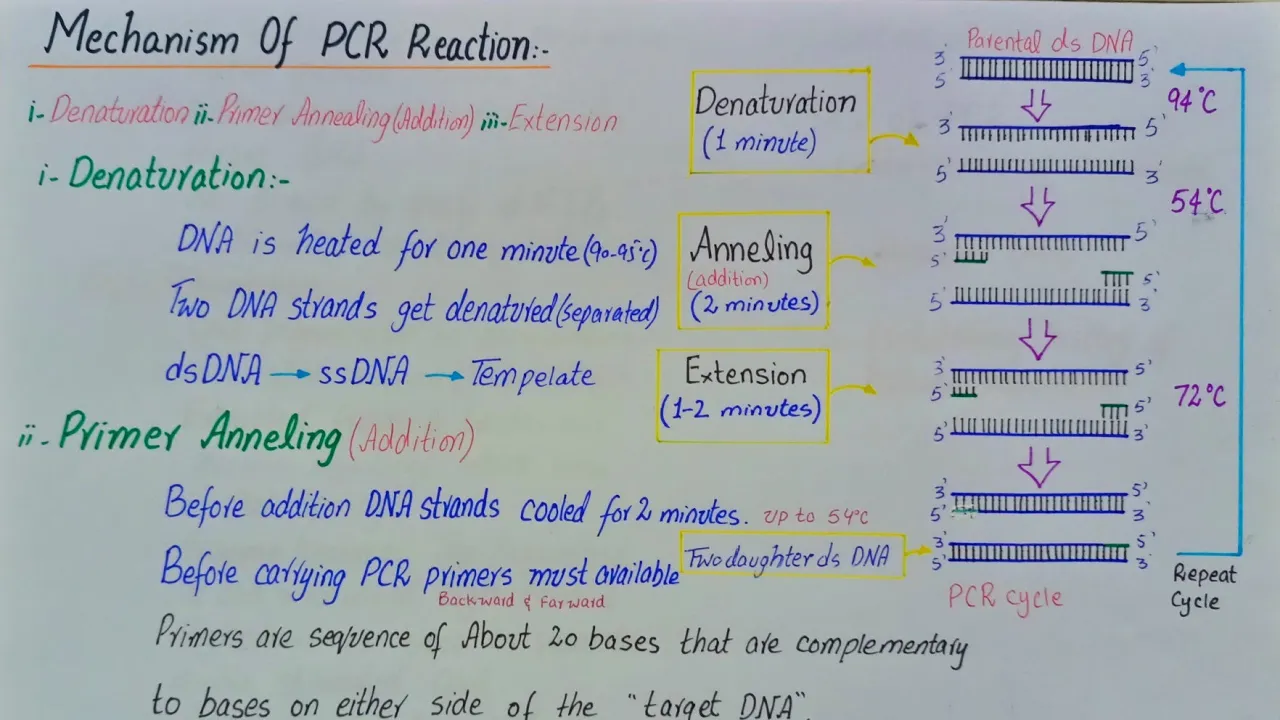
You'll find that molecular biologists like to use abbreviations, right? It all starts with DNA, an abbreviation for deoxy ribboucleic acid. I already mentioned to you RFLP. Well, here's another one that molecular biologists are fond of. We like abbreviating things like this, giving them fancy names and then breaking it down. PCR is short for the polymerase chain reaction. And the long and the short of it, PCR is a very clever trick that molecular biologists can use to amplify DNA in their laboratories. Not just any DNA either, but specific regions of DNA that we can choose which ones we're amplifying by deciding what kind of primers we add to the mix. In very simple terms, many people refer to PCR as molecular Xeroxing. In the same sense that you can use a copy machine to make many copies of a particular piece of paper, you can use PCR to make many copies of a particular fragment of DNA. And here's one last fancy sounding word electrofpharesis.
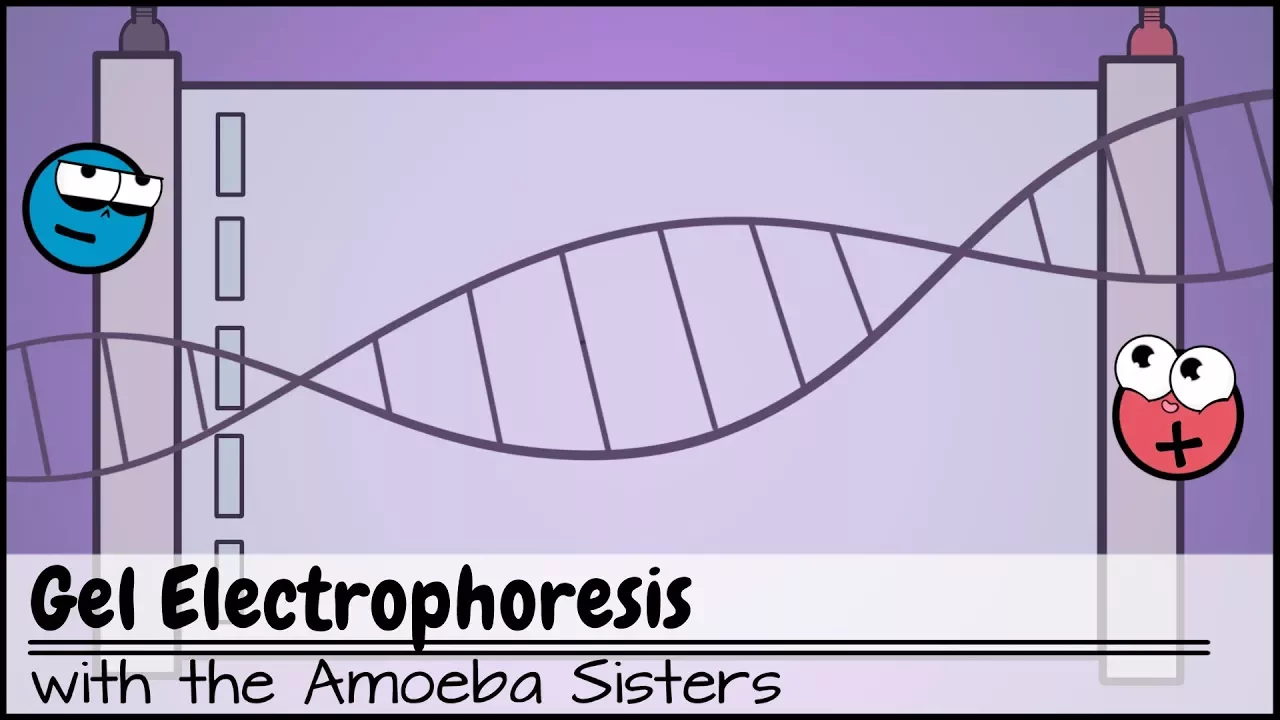
The bottom line for electrofpharesis is this is it's the way that we're going to separate DNA molecules on the basis of their size. The electro means we're going to use electricity. The feresis is talking about movement. We're going to pull DNA molecules along. Big molecules will have a hard time moving. Small molecules will zip along. We can separate DNA molecules on the basis of their size using this technique of electropharesis.
But enough vocabulary. Let's get to the topic at hand. Let's get to work talking about how it is that automated STR testing actually works. Okay.
So, here's the name of the game. Ultimately, when we're doing DNA testing, be it automated STR tests or any of its preceding varieties, the objective is to get DNA, some genetic material from a reference sample here, shown as a vial of blood and compare it to that same genetic material that we get from an evidence sample here, a bloody handprint. And so the first step in this process is quite simply to extract and purify DNA from both of these two different kinds of material. I'm not going to get into the details in this relatively short video about how it is that that's accomplished, but I hope you'll take my word when I tell you that it's actually a very simple, straightforward procedure. It's rooted in the very same principles that work for getting stains out of laundry.
Right? I'm not exaggerating. There's no hyperbole there. The way that DNA might be lifted or taken out of a bloody handprint is exactly the same principle.
Warm soapy water, a little bit of agitation, put a little bit of salt in to move things along is the first step in actually getting DNA and cellular materials off of a substrate that it might be associated with. It's the first step in an extraction. The purification steps are not that much more complicated. There are kits that can help move that along very quickly, but you can do it old school and just use a couple of chemicals. Phenol chloroform is one, and then follow that with an ethanol precipitation. You know, it sounds fancy, but in practice, first graders can do these extractions and purifications easily without any risks to themselves using just a couple pennies worth of reagents in the span of just a few minutes. Extraction and purification of DNA is nothing that anybody should be afraid of. Okay, there's one thing to bear in mind when we're talking about extracting and purifying DNA, and that's this.
It turns out that sperm cells are a little bit different than all the rest of the cells in our body. They have tough protein coats that allow them to stay behind in certain solutions whereas other skin cells or other cells like skin cells might have gotten broken up.
That in turn allows this idea of a differential extraction. In sexual assault cases, you'll sometimes find that a testing laboratory has taken some pains to try to separate the sperm cells from the other cells in a in a particular fraction. When that works, it can give us a nice clean look at the contributor of male DNA to a particularly mixed sample. But uh when it fails, we're typically in no worse shape than we would have been if there hadn't been an attempt to do that differential extraction. So there is some slight variation that you can do with the extraction techniques, but for the most part, most extractions are done the same for all samples regardless of the crime or their likely sources.
All right. Where are those extractions and purifications going to take place?
The short answer to that particular question is in one of these kinds of test tubes that you see here on this particular slide. They have a fancy name. They're called eponorf tubes.
Sometimes called microfuge tubes. But this slide doesn't do justice to just what it is we're talking about here with an ependorf tube. Let me show you an actual eporf tube here in my hand.
Right. This particular epidorf tube is one that's designed to hold 200 microL within it. Right? So a fifth of a milliliter, much more than you would typically use for a typical DNA profiling experiment. So this is the kind of test tube. I know many of you watching these videos have probably taken high school chemistry labs and such. The test tubes that you worked with in that setting are very different than the kind of test tubes that a molecular biologist will work with. And so you can see the test tube here has a little lid that's attached to it and we can seal it and reopen it and put things in and take things out of such a tube during the course of doing a DNA extraction and purification. Okay. Now, what is it you use to move materials around to and from a tube like this?
Well, the answer to that question is a fancy instrument that we call a pipeter.
All right. While we're on this slide, let me point out that we're talking here ultimately for a typical DNA test in the ballpark of 10 to 20 microllers is the final volume of liquid. And remember, a microller is a millionth of a liter.
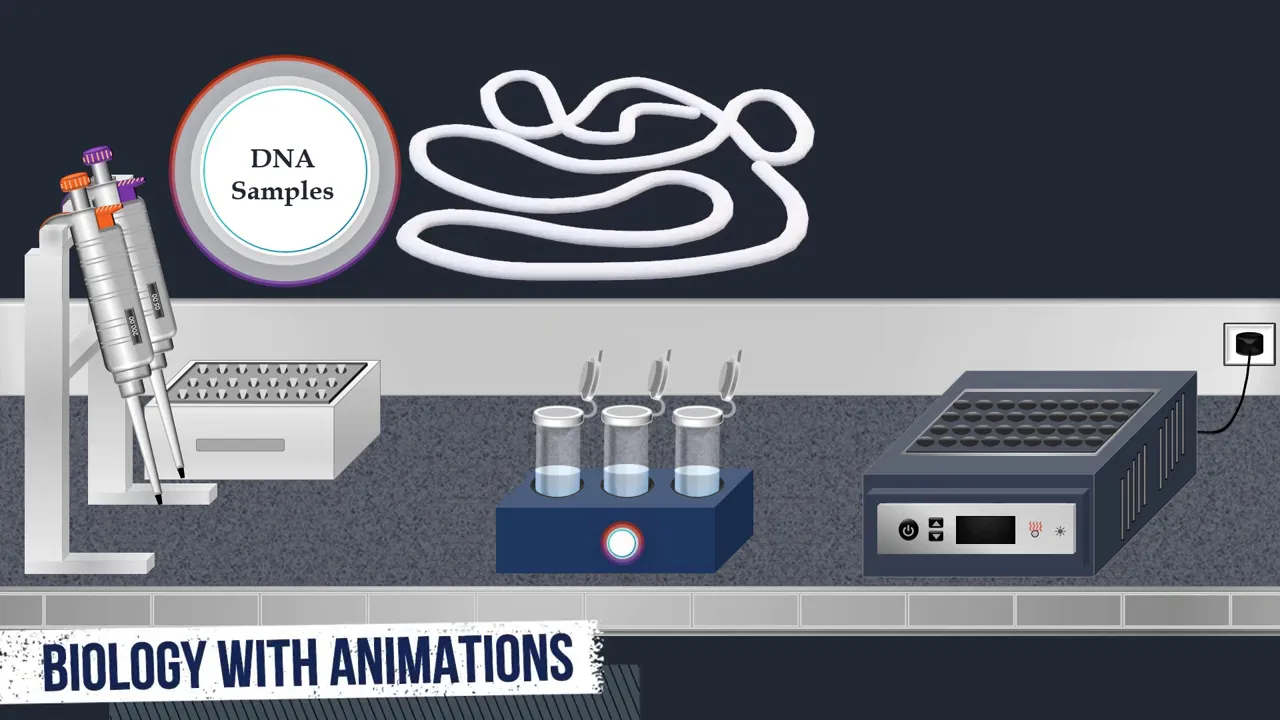
Barely, a microL is barely visible to the naked eye. 10 microL you can see unless you've got really bad eyesight, but it's still a really small amount of material. And it's important to bear in mind that DNA doesn't have any special color associated with it. We're often taking as a matter of faith that we've succeeded in moving DNA from one tube to another or that a particular reaction is working the way that we had intended it to be working. It's often only at the very end of the process that we know if things have worked out quite right. So I have here with me an actual pipeter just like the one pictured on that previous slide. And uh you know I think it's worth pointing out that this is a fairly easy to handle instrument. You'll find these literally in every molecular biology laboratory. You can't do molecular biology, let alone DNA testing without one. Um and there's really not that much to the instrument. There's a plunger up here at the top that you can press down upon. And if you look really closely, you can see my thumb is just barely moving. That's enough pressure to cause the tip of the tube now to be ready to accept one microL of liquid from a tube like this one. So when I lift up on the plunger, the tip of the pipeter now has within it one microl of liquid. All right? And so that's how it is that we would move around such a tiny amount of material. It's obviously important to calibrate an instrument like this. If you're off by a factor of two or three when you're dealing with only 10 or 20 microL of total volumes, that can obviously have some important consequences. And one other feature of a pipeter that's going to be helpful to bear in mind if you have concerns about contamination and things of that nature is this tip. The very tip of the pipe header is actually a disposable piece of plastic and it can come right off. So in one hand I've got the tip, the other hand I have the pipeter and I can always use this pipeter again now without worrying about crosscontamination by getting another tip such that we can do the whole process one more time and the tip can come off and is disposed of after each use. All right, so that is the kind of instrument that we're going to use to move around these small volumes of liquid. Let's talk now about the machines that are used in the lab to do the PCR amplification process itself.
Here on this slide is an image of a thermosycler. That's the name of the particular instrument that would be used in a a laboratory interested in doing PCR amplification. Let me tell you that an instrument like that isn't that large, right? It's about the size of your typical bread box. Uh they're very widely available. They've been used in molecular biology laboratories for going on 20 years now. Uh you can purchase used ones of these for a few hundred off of uh the internet if you were so inclined to do so. They don't take up a lot of space and they're not that expensive. The bottom line is this instrument does a good job of cycling a sample, the eponorf tube through three different temperatures and that in turn is what get drives this PCR process.
This next slide actually gives you a little bit of a closer look at a molecular level to what it is that's going on during the course of PCR.
As I said before, PCR is essentially a molecular xeroxing machine. What's going to be happening is that with each round of PCR, you will double the quantity of a particular region that you might be interested in. Okay, this slide actually shows you some of the specifics of how it is that that plays out. But for the purposes of this video, let me simply say that with each round of PCR amplification, we double the amount of material that we were starting with that we might have been interested in. And if you look at this part of the slide, you'll see that for a typical forensic investigation, the test kits that are used recommend that there be 28 rounds of amplification. You know what that translates to? 28 rounds of doubling of a region of interest. Quite simply, we go from talking about looking at a particular region of DNA that's like a needle in a hay stack to at the end of 28 rounds of amplification two to the 28th times copies of that particular region to finding ourselves to having a stack of needles with maybe a piece of hay hidden somewhere within it. That's the advantage. That's the power that comes from PCR amplification.
Along the way, as part of the PCR amplification trick, it's also possible to fluorescently label the fragments so that they glow in different wavelengths of light when we shine a laser beam at them. That's going to come in handy in terms of tracking where these fragments have gone uh in the next step of the process. And speaking of the next step in the process, for that we're going to need another instrument still. This is the one that might break your bank if you're thinking about setting up a crime laboratory in your own garage or basement. Uh this here is a picture of an ABI 310 genetic analyzer. There are other variants of this machine that are now available, a 3100, a 3130, but the basic principle is all the same. And this particular instrument is still the workhorse for most crime laboratories.
The principle is pretty straightforward.
The business part of the instrument is going to be right here. If you look very closely, you might be able to see a very faint gray line. Uh that is the capillary in which capillary electropharesis will occur. Don't worry, the next couple slides will help you get a better understanding about what's going on there. But again, the most important part of the slide is right there. And this next slide shows us a cartoon um that comes from the users manual for an ABI310 genetic analyzer that lets you see things a little bit more clearly.
When I, as a molecular biologist, talk about DNA, the very first thing that actually comes to mind to me is that it's an an intensely negatively charged molecule. And I think we all appreciate that opposites attract, right? And so what we can do is if we start our DNA off at one end of the capillary and put an electric charge down there by applying an electric field, what we can do is if we start our DNA over here at this end of the capillary, it's naturally going to be drawn to the positive electrode. It's going to go with that electric current. And that's exactly what's happening during capillary electropharesis.
So DNA is going to get pulled through this very thin hollow tube from negative electrode to positive electrode. And along the way, big molecules of DNA are going to have a hard time fighting their way through that little narrow tube in the matrix that's within it. Medium-sized ones will get through a little bit more easily, and the ones that move through the quickest of all will be the smallest fragments of DNA that there are in a particular sample.
Eventually though, regardless of their size, small, medium, or large, they're all going to parade past this one part of the instrument that's called the detector window. And the detector window is very simply a CCD camera, probably much like the one that you have in your cell phone, um, paired up on the other side of the capillary with a laser. And as DNA fragments are moving past the laser, they get excited. that they fluores in a different color because of the labels that got put on during the PCR amplification. And those colors get picked up by the camera. And so again, eventually all the DNA moves past that detector window and all of that information gets transmitted to a computer. And this is what it is that that data looks like as it's being captured by a computer. Let me tell you what it is these axes mean. This vertical axis here is described in terms of relative fluorescent units or RFUs.
Again, molecular biologists like their abbreviations. And all that we're seeing here is a measure of the intensity of light that that CD camera picked up upon at different points in time. And the horizontal axis here is measured in terms of minutes or seconds if you prefer. It starts at time zero and it proceeds all the way through to about 30 minutes. From beginning to end, it takes about 30 minutes for even the largest fragments of DNA to run that gauntlet of the capillary in a capillary electropharesis machine. If you look at what we're seeing with the data here, you'll notice that not much at all happens for the first dozen mi minutes or so of the whole electropharesis process. Then we see a lot of light in a lot of different colors. Each line here corresponds to a different wavelength of light that the camera is detecting.
These are small bits of DNA. They're actually the primers left over from that PCR step earlier in the process. And after they've moved through, then we start to see this pattern of peaks, spikes, and valleys essentially. That's where the information is. That's where we're going to be able to see some DNA profiles. So this information gets captured by a computer and then computer software is used to tease apart these peaks into their component colors.
Software also then is used to attach names to each of these different fragments or peaks that you're seeing along the way here. And the next couple slides are intended to help you get a feel for what it is these electrofaroggrams mean. Each of these graphs corresponds to an electrofaroggram taken together. This is a DNA profile and in fact this is the DNA profile that's generated from the raw data that you saw on the previous slide.
So what do we see when we're looking at one of those electrofaroggrams? Well, let me tell you here's how we read electrofpharoggrams. Those peaks that you saw on the electrofpharoggrams, those each correspond to individual alals. And there's actually nine different loi at which we're going to be getting information from that particular test kit that we used on the previous slide. Each of those can have information, some peaks that that tell us what alals are present there. And those end up showing up as peaks again on the electrofpharoggram. This is the same electrofaroggram that you had seen in the previous slide. But let's take a closer look right now at the electrofpharoggram. It's easy to see that the computer has separated the peaks into three different kinds of colors. We have some peaks in blue, some in green, some in yellow shown in black because yellow doesn't print or or show up well on computer monitors, and also some in red. All right. So, four different color fluorescent dyes were used to label the DNA in that PCR amplification.
And within each of the three first colors, the blue, the green, and the yellow, you can see there are actually clusters of peaks, three clusters, three in blue, three in green, three in yellow. These are corresponding to the fragments of DNA that have been amplified from specific lossi that are part of this particular test. And each of those lossi has a name. Okay, here are their fancy names, right? The first one is often referred to as the D3 locus. The second blue one is the VWA locus. The third one is the FGA locus and so so on. But the names, well, they're important and they help us keep track of what's going on. Nobody expects uh an attorney to have committed this sort of thing to memory. Here's the thing that we think is interesting when we look at these electrofpharoggrams.
Again, each of those peaks corresponds to an alil that was present with the DNA sample that was being tested. Okay? And here is exactly what I mean by that.
Here if we have it the D3 locus which actually has an even longer formal name uh but if you look at the D3 locus in this illustration you can see there are two alals present one that's a 16 one that's a 17 that's the name that we gave to it with the computer software and at the D3 locus on the electrofaroggram that in turn causes us to see two peaks a 16 and a 17 and by the same token at the D13 locus one of the yellow loi here you can see an 11 and a 13 that corresponds to alals 11 and 13 that were present in the underlying DNA sample.
There is one other locus that you may have noticed. It's this one here in the green, the leftmost on the electrofpharoggram. This is from a locust that's not polymorphic. Right? So there are nine polymorphic loi for this particular test kit. One not so polymorphic locus. The amalogenine locus is a this is a gene that resides on the X chromosome and the Y chromosome. The X chromosome version is a little smaller than the Y chromosome version. And the long and the short of it is this. If you find a DNA profile that has two peaks at the analogenine locus, guess what you found? You found a DNA profile that came from an individual with both an X and a Y chromosome. In other words, we're talking about a male's DNA. In contrast, if you only see one peak, just the X, then that means that we're talking about an individual who has no Y chromosome.
In other words, a female. And there are one last set of peaks to look at here.
These are the ones labeled in red. These aren't actually amplified during that PCR amplification step. Instead, these are already pre-added to the mix. They are internal size standards. And it's by comparing where peaks move in the yellow, the green, and the blue to where peaks moved in the blue that we're able to make size determinations uh for these samples. We know how big each of those fragments are. If a particular piece of DNA moves just a little bit further than that 100 does, that tells us it's probably an X, especially if it's labeled in green. So that's the sort of thing we're looking for in an electrofaroggram.
There's more information that we can get out of an electrofpharoggram than just the DNA profile. I'll be talking with you about some of these specifics in greater detail with some other videos.
But for now, let's talk about some of the basics.
Remember, we're looking at nine different polymorphic lossi plus the amalogenine locus. Here's a quick insight that you can get just at a glance. If at a locus you see two peaks, what that means is we're talking about a locus that we would call hetererozygous.
Very simple direct translation. If there are two alals, two peaks, that means we're talking about a hetereroygote individual at that locus. And that's in contrast to what you might see at a locus where there's just one peak. In that circumstance, we call that a homozygous locus or the individual is a homozygote.
If ever you find a locust that has more than two peaks, in other words, three or more, the simplest interpretation is that we're talking about a mixture of DNA from more than one individual. The bottom line is as human beings, we're diploloyid. We have two copies of our genetic instructions. Sometimes we get the same instructions from both our mother and father. That makes us a homoygote. Sometimes we get something different from mom than what we got from dad. That makes us a hetereroygote at that locus. It's very unusual to find that we had information that's more than just from mom and dad. There there are some known instances but those are rare.
All right. So those boxes are showing you a hetererozygous and a homozygous locus respectively.
Now the position of peaks also tells us something. The peaks that are on the left side of a set of electrofaroggrams correspond to smaller fragments of DNA.
The ones that are on the right side correspond to larger fragments. Because remember what's happening here is all of these peaks correspond to DNA. Those being pulled through one of those capillary tubes during capillary electropharesis.
The first things that get recorded show up on the left. That corresponds to a smaller set of DNA fragments than these.
they come up further on the right. So if you're looking at an electrofaroggram, size is always described in terms of small on the left, large on the right.
And the heights of the peaks is something that can give us some interesting insights into a sample.
Ultimately, the height of a peak is proportional to the amount of DNA that gave rise to that particular peak in the PCR amplification. So let me draw your attention here to this locus. This is a homozygote. The individual contributed two copies of the 16 alil. Over here they contributed one copy of the 14 and one of the 15. Notice the difference in the heights of the peaks. The homozygate locus is twice as tall as the heights of the peaks at the hetererozygous locus.
Okay.
So let's move on.
Here in a nutshell are all the peaks that you might see with a DNA profile test like profiler plus. Okay, this is just showing you all the most commonly observed al. So you can see there's quite a few that you might be able to find for any given sample. Again, for an unmixed sample, you would expect to find at most just one or two, but these are all the ones that you might find with the profiler plus test kit. One that's been very commonly used by crime laboratories over the years. Here's the kind of peaks that you might see if you used a different test kit. This is called SGM Plus. It's from the same manufacturer, but this particular kit is more popular uh in Europe and especially in the United Kingdom. But ultimately, again, this is the kind of DNA profile that you'll see when you are generating uh a DNA profile with the profiler plus test kit. And it brings us then to asking questions like how impressed should we be if we find that the DNA profile for an evidence sample is the same as the DNA profile that you found in a reference sample. In other words, what do we mean? How impressed should we be if we find that two samples match?
What is the weight that should be given to a DNA profile match? To answer that question, we need to actually consider three alternative hypotheses. All right, the first hypothesis is the one that the prosecution in always gravitates to and then that is simply this. The reason that the DNA profile between an evidence sample and a reference sample match is because they have the same source.
Right? That's that's the beauty that's the power of DNA profiling. But there are two alternative hypotheses that need to be considered as well. One is maybe it's just the result of coincidence.
Maybe the perpetrator of the crime just by chance happens to have the same DNA profile as some hapless suspect who has been uh incorrectly charged with the particular crime. I said at the very beginning here for this video that the chances of that happening for a good clean unmixed sample with these automated STR results is vanishingly small. These days it's described in terms of quintilians or quadrillions. So the chance of a coincidental match in many instances can pretty effectively be ruled out of consideration. But I've said there's a third possibility and that third possibility is that maybe there's been some sort of mistake in the process. Maybe there was a mistake in the collection of the evidence. Maybe there's a mistake in the handling after the collection. Maybe there's been a mistake in the manipulations within the laboratory such that there's been some type of contamination. Maybe there was a mistake that was an accident. Maybe there was a deliberate mistake, right?
All of these things are possibilities and all of those things need to be considered when we're deciding just how impressed we are with a DNA profile match. That's more than I think we want to get into for this particular video.
Uh but instead, it's something that we'll be talking about in subsequent videos in this series. uh soon I'll tell you all about how it is that uh we would generate a statistic for a straightforward sample and then not long after that we'll talk about how it is we generate a statistic for a more complicated sample uh where a mixture may have occurred or where there may be some other complicating factors but for now I think we can wrap this particular video up and uh simply uh thank you all for uh for listening in and encourage you to come back so that we can talk some more in a little while about how it is we answer those questions about statistical weights. I'm Dan Crane and uh I hope that you've enjoyed this video about how it is that DNA profiles are generated.
Up Next

71:33
Molecular Biology Techniques: PCR and Hybridization Methods Explained
@BoyneatBradford
45.4K views•2012-03-26
50:12
Bacterial Communication: Quorum Sensing and Biofilm Formation Explained
@JHUAAP
12.6K views•2011-06-28

5:35
Enteric Nervous System Explained: The Gut's Brain | Neurobiology Lecture
@alumniu6029
438 views•2018-09-12
7:08
Bacteriophages: Earth's Deadliest Killers and Future Antibiotics
@kurzgesagt
34.6M views•2018-05-13
Related Study Plans & Knowledge Roadmaps
Structured learning paths in Biology
biology
RNAi: Biogenesis, RISC & Gene Silencing
01Molecular Biology Foundations: DNA to Protein
02Introduction to RNA Interference (RNAi)
03Molecular Biogenesis of miRNA and siRNA
+ 2 more learning modules
10h5 modules
Explore Roadmap
biology
Mycorrhizae: Signaling, Biophysics & Ecology
01Foundations of Mycorrhizal Symbiosis
02Molecular Signaling and Root Colonization
03Biophysics and Bioenergetics of Nutrient Exchange
+ 1 more learning modules
11h4 modules
Explore Roadmap
biology
Circadian Clocks: TTFL, SCN & Periphery
01Foundations of Molecular Biology & Gene Expression
02Introduction to Chronobiology and Actograms
03The Core TTFL: Molecular Architecture of the Clock
+ 3 more learning modules
14h6 modules
Explore Roadmap
biology
Population Genetics: Math, Drift & Selection
01Genetic & Probability Foundations
02The Hardy-Weinberg Principle and Baseline Models
03Mathematical Modeling of Natural Selection
+ 3 more learning modules
18h6 modules
Explore Roadmap