



















![Plenary Talk by Nobuhiro Kiyotaki on 18.12.2015 [2/3]](https://i.ytimg.com/vi/GCfvROyhF-w/maxresdefault.jpg)




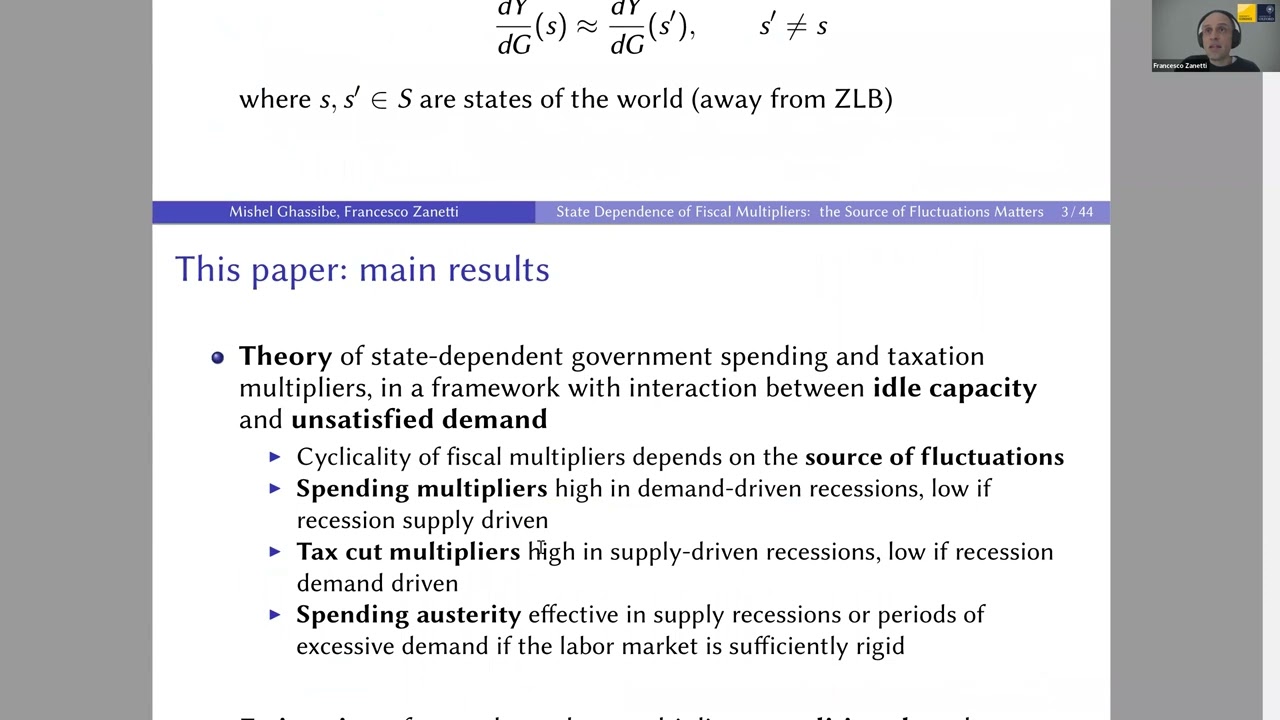




The famous Blanchard-Leigh (2013) finding that fiscal consolidation projected in Spring 2010 was linked to subsequent growth forecast errors does not indicate that forecasters used multipliers that were too low; rather, the real problem was that forecasters failed to anticipate the Eurozone crisis, which caused growth shortfalls independent of planned fiscal adjustments. The relationship between planned consolidation and forecast errors is spurious, arising from omitted variable bias where countries with weak fiscal positions were both more likely to plan consolidation and more likely to be hit by the crisis.
Fiscal Multiplier Debate and Eurozone Crisis Analysis
Added:The concept of the Fiscal Multiplier and Keynesian macroeconomic theory regarding aggregate demand.
The origins and structural vulnerabilities of the Eurozone Sovereign Debt Crisis, including the limitations of a shared currency without fiscal integration.
The debate between fiscal austerity (reducing government deficits) and fiscal stimulus to counter economic recessions.
The role of international financial institutions, like the International Monetary Fund (IMF), in economic forecasting and policy prescription.
The methodology of the Blanchard-Leigh paper (2013) and its impact on subsequent IMF policy guidelines.
Joshua Felman's specific counter-arguments, focusing on how credit supply shocks and banking sector distress (balance sheet recessions) contributed to the output drop.
Empirical techniques and econometric models used to estimate state-dependent fiscal multipliers (such as during expansions versus deep recessions).
The long-term structural consequences of the Eurozone crisis, including hysteresis in labor markets and institutional reforms like the European Stability Mechanism (ESM).
270 views3likes46:51Original Release: 2016-07-01
[Music] okay so uh you you have a uh a paper in front of you and um a title on the screen that has someone else's name on it uh I have a long tradition of U working on papers without putting my name on them so so this is another one of these papers um uh and uh this the the origin of this paper uh as as a was saying lies lies in absolutely huge debate that that erupted in October of of of 2012 but but all since since a lot of you don't know any any of the background let let me sort of ease into this uh slowly uh but uh basically I'm uh this is this is an analysis of perhaps the most famous macroecon and important macroeconomic paper that it's that's appeared in the past decade um all right so so uh the paper is about forecasting errors and uh before the global financial crisis uh forecasting was pretty easy for for for just about anyone and the the reason was because the world had entered into what was then called the Great moderation which which meant that there was they seemed to have abolished the business cycle uh growth was high and steady in just about every country inflation was low and steady so so if you have that combination it becomes really really easy to forecast and nobody really even talked about forecast errors but ever since the global financial crisis uh forecasters have been making very very large errors and repeatedly always on the in the same way they've been consistently overestimating growth uh and it it's become a sort of fun ritual uh at uh every 6 months the IMF has a meeting uh where everyone from the world attends all the finance min and Center Bank Governors attend and at that meeting the first thing that the IMF says is oh we're really really sorry that our forecast we're going to have to mark it down because it was too high and it just this game goes on every single time the past 6 months ever since the global financial crisis um now there are three broad theories about why we've run into this problem and one is that that we we've underestimated the balance sheet constraints holding back growth that's a sort of fancy way of saying that that there something's gone wrong the the uh corporate corporates are under tremendous stress uh or the banks are under tremendous stress and they have to fix their own problems before they can start investing and the economies can start growing that's one Theory uh uh uh basically that the global financial crisis ruined the banking sector and in some countries the corporate sector and we still haven't got out from under that mess the the the second prominent theory is um uh uh secular stagnation uh there are two variants of secular stagnation in this uh one that uh I put up on the screen uh I'm talking about the the collapse of productivity so that that's that's to say the idea there was that that there was very good growth in the early mid 2000s because there was a lot of innovation and countries were deriving the benefits of the it Revolution but those benefits have largely been exhausted and so so growth has has slowed and it's going too likely to remain slow for some time the third idea was that now the problem is just aggregate demand is weak and that's just an idea that that Olivier vanan Shard who was the chief Economist of the IM believes very very strongly in and so he ever since these forast error started to materialize he was determined to prove that this was the problem and so he started to look at the data and he discovered something absolutely remarkable and I I I've put this discovery up on uh on on the screen I know you can't read it too well certainly I can't read it this shows you this shows you for the Euro area uh on the Y AIS you have the GDP growth forecast errors and on the x-axis you have the projected fiscal consolidation so in other words the the the the countries which tried to to cut their budget deficits wound up with the worst growth performances even relative to what was being forecast right now it's it's just remarkable how good the fit is of of of of a line like this and the reason why it's so remarkable if you think about it is that there should actually not be any relationship between planned fiscal consolidation and growth forecast errors because by definition planned fiscal consolidation is known so it should be incorporated in the growth forecast there shouldn't I mean growth might be higher than forecast growth might be lower than forecast but there shouldn't be a systematic relationship between your forecasting error and something that you knew at the time of the forecast that makes no sense the only the only way that you can you you can understand something like this is that if the the forecasting technique is wrong that you're not using your information efficiently uh and you're using it in in in a biased way so so if there's if what happens is that you know that there's fiscal consolidation and yet you still under overestimate growth that means that the fiscal multiplier that you use which is the the sort of variable that goes between consolidation and growth that that multiplier must be too low that that you thought that the fiscal consolidation would have a small effect on growth uh even though you should have actually used a much larger number and and put in your forecast that it would have a large effect on growth and that's the that's the bottom line of of of of his paper uh and so what spe specifically what he found was was something absolutely truly shocking that that for every one percentage Point increase in the projected fiscal consolidation there was a 1 percentage Point growth forecast error uh that's basically the slope of the line that I showed you earlier and what that means is that the forecasters use a multiplier that was way off right they use a multip lier about three uh uh sorry sorry uh I put two and 3/4 that's a typo should be 1 and 3/4 um the use multiplier of about 3/4 the real multiplier was about 1 and 3/4 right that's a huge huge mistake and uh when he he originally published this uh in uh in the fall of 2012 uh uh in in the world economic Outlook that was was published at one of these six-monthly meetings of the IMF and I was there when the publication was released and it was it was like a shock wave was felt throughout the building uh uh people people people uh there there was one article in in in the financial times that said there is nothing more powerful than an idea whose time has come and finance ministers were absolutely bowled over by by this reaction some of them were were were were Furious because it was an implicit criticism of the policies that they've been pursuing particularly in Europe uh uh there are a lot of arguments there was a lot of drama uh but in the end the the the finance ministers backed down in the face of this evidence and they changed their policies so that's why I called it at the beginning that saying that this was probably the most important paper of the decade it was important because the finding was was dramatic and the reasoning was very elegant and spare you can summarize it very easily uh uh there was some academic rigor they took they they took their time they actually were very careful and didn't publish the paper until 2013 even though they had their findings already out in 2012 and it had a major major policy impact as I just said so uh so of course you you you know you know where I'm headed uh I I'm I'm I'm going to attack this paper right uh the most influen IAL policy paper of the past decade and I'm here to tell you that it's wrong okay all right so let me I I I I want I need to go slowly and carefully over my argument just checking were you a team in that team member of that paper I was not a team member of the paper but I obviously yeah sorry I should have explained this I I was in the research Department of the IMF at the time and I was I was there when all of this was happening and the the the person the person who discovered the relationship was of course not Blanchard it was the other guy Lee right that's the way it always works in the world right and uh uh uh uh lee is a good friend of mine uh but he was wrong okay uh and Blanchard was wrong um uh uh even though Blanchard uh hired me uh but that still doesn't make him always right now but it's one reason why I'm not putting my name on this paper now all right so so there there two questions that you can ask right one is was was the finding correct can we replicate the result right and the second question I want to ask ask is is the interpretation of the finding correct all right all right so the answer to the first question is really simple I'll do it on one slide the results are perfectly replicable so so I don't want to you don't have to stare too hard at this slide you can just trust me because not really the point here uh we we we used the 2012 data we went back and we replicated things using the 2012 data uh uh splitting the sample different ways and then we also used the 2016 data and we did that because of course there have been large data revisions since 2012 even for historical date Blanchard's uh work really focused on what happened between 2009 and 2011 and uh believe it or not since since in the intervening years the data has been revised pretty radically even since you would have thought in 2012 the data would be pretty final but but it turns out it wasn't it doesn't really matter uh uh in a way it strengthens you can look at uh take a look at the last line of that table uh or the first line the first line uh gives you their their their one uh coefficient of one that I mentioned earlier and if if you do it with 2016 data on the Euro area uh you get uh uh 1 1.48 which is an even stronger uh uh coefficient okay I don't want to go go through this too much uh because it's really not the point the point is results are replicable the second question is the interesting one right is the interpretation of is find incorrect um and the two reasons why I want to argue that the interpretation is wrong uh and I want to argue it because the first point is that if you if you play with his data some more you get results that are inconsistent with his interpretation all right so here's here's one uh uh that I want to show you so so if you uh what uh what this shows uh is this is a a regression of the the growth forecast error on projected consolidation and you see that the look at the first line the the higher the consolidation the more there's a negative growth forecast eror that um uh and the the coefficient is 1.48 so that that suggests again that you've really underestimated the multiplier uh and uh that's that's if you that's if you if if you look at uh this is this is if you do it uh using you uh uh using uh uh the spring 2010 forecast so so what what Blanchard did was he used the spring 2010 forecast he was sitting in 2012 and he was looking looking at what had been done in Spring uh uh uh 2010 and then looking at the outcomes for 2010 and 2011 all right uh so if you look at the spring 2010 forecast you see that yes there is this association between projected consolidation and forecast errors you see that same uh thing happening again in in in in 2011 now in Spring 2012 now remember this is before he's he's published even the box in the wheel box in the wheel was published in late 2012 right but in Spring 2012 you don't see any uh uh the the the coefficient on projected consolidation essentially disappears it becomes close to zero and and and it's not significant so so what what that seems to suggest is possibly that that maybe they made mistakes in 2010 and 2011 but they didn't make mistakes in 2012 even before Blanchard told them that they had made a mistake right that seems a little bit odd okay much more worrisome is if you look at the forecasts that were made in Spring 2010 for consolid validation going through 2011 or through 2012 or to 2013 or two through 2014 because the IMF makes 5year forecasts right if you look at the shorter term consolidations there's there's a link the the uh the minus 1.48 that we keep seeing but if you look at the longer term forecasts there is the co is is not significantly different from zero which suggests that they made bad mistakes on the shortterm multipliers but they didn't make any mistakes on the long-term multipliers now how can you do that normally it's much easier to forecast in the short term than the long term okay now here's but that's just reason to to sort of Wonder a little bit okay now the the basic thrust that I want to really pursue is that he's he's made he's made a link only between two variables he's saying I know what the reason for the growth forecast errors is and it was one thing that's that that that that's systematically responsible and whenever you get a mon monocausal explanation you always start to wonder right is this is this right or not and so this is what we did we we we put we put higher multipliers as Blanchard recommended into into the forecast the the short-term forecast and we asked well what what would have been the growth forecast errors if we put the proper multipliers in according to Blanchard and the answer as you can see from the the the uh red dots is that the forecast errors would have been large even with the multipliers that Blanchard suggest and that suggests that there's something going on besides perhaps multiplier errors right now what what would could have been going on besid multiplier errors let's go back to the first table that I showed you if if you look I I've broken things down look just at the the top four lines using 2012 data I've broken it down at all 26 countries that Blanchard looked at these are the advanced countries uh look at the last line Euro area Euro area you you get a coefficient of minus 1.1 which is 1 n which is about the the same as uh uh the overall but now look at the non Euro area the non-o area the coefficient is again very close to zero so what you can see from this is that his result derives from really what was going on in the Euro area and we know that something special was going on in the Euro area in 20 10 2011 the period that he was looking Nono area you mean the whole world other than the the advanced countries so US US Canada uh all of them in some kind of zero interest rate regime right yes so the planchard type argument that monetary policy has stopped working at zero and we need fiscal that kind of argument could have been reasonably made about the entire yes right what is non Euro area yes right so it really is a problem for Blanchard's argument yes that that Nono area C is zero yes because because his argument is only applying to the euro countries was his argument was meant to be a very general argument about big multipliers in countries at the zero lower bound and uh and and uh with poor growth and weak demand uh you know output caps and and um uh so that is a problem problem for his argument and also it's I mean it's it's a problem that you don't get a consistent result across the sample and it's another problem that as result particularly applies to the euro area when we know that during that period the Euro area had a crisis okay now um and maybe that crisis had an independent effect on the forecast errors that that that is not in his equation right because his equation is growth forecast error depends solely on your planned fiscal consolidation there's no other variable for crisis in in in here um now uh in fact some of the interest rate forecast errors one of the way that you can how do you measure the crisis well one way to measure the crisis is to look at what you projected for interest rates and this is this is I just took Ireland as an example this is the projected long-term interest rate for Ireland which was about 5% and the that's a blue line and the red line shows you what actually happened so it shows you that in in in 2011 interest rates went up to to 9% this is long-term Sovereign interest rates of course private interest rates went up much more sharply and to much higher levels so so so clearly there there was a forecast error not not just in terms of growth but in in terms of uh forecasting interest rates uh in the economy and the question is did did this forecast error have anything for interest rates have anything to do with the growth forecast era right another reason why to to to sort of take a step back and look at the argument again let's let's think about the East Asian crisis in the fall of 1997 the the IMF uh said that between 96 and '98 Korea would grow by 12% and it would have some adjustment of its fiscal balance by half percentage point right now in fact GDP did not grow by 12% it declined by 2% over that period and in effect the question that I'm asking asking is was that shortfall because they underestimated the fiscal impact of that half percentage point adjustment or was that because they didn't know about the Asian crisis at that point all right now BR sh Lee of course knew that there was a Euro Zone crisis and so they they tried to test to see whether the rise in interest rates had an effect on the growth forecast errors and the way they did this was they they they looked at the rise and CDs spreads and they discovered that actually they weren't very important uh so they they they then added a second variable to their equation and they discovered that no rise and CDs spreads weren't very important and that fiscal adjustment basically remained exactly as significant as before you still get to the conclusion you underestimate the multiplier by one so this um uh uh the the uh if you look the first line uh you see our attempt to replicate that and what you can see what you can see is uh that um the projected consolidation the coefficient goes down a bit but it's still significant and the CDA CDs increase it it's significant in our equation but the the the economically it's completely insignificant now uh if you if you look at the problem problem there is that as I mentioned earlier the data has been revised and if you look at the revised data uh and you run the same uh regression in the second line using revised data projected consolidation disappears it's not it's not significant anymore all right all right so the next step that they said was well maybe the Euro Zone crisis wasn't an independent event maybe it's not not not right to to think of these uh uh this way as as two different factors interest rate shooting up and plan consolidation maybe the two things were related because the higher interest rates were caused by the fiscal adjust and the the the argument goes like this fiscal consolidation depresses growth then growth worries make investors worry about fiscal sustainability and then they run so everything is in the end explained by the plan fiscal consolidation the problem with that argument is that It suffers from from sequencing problem so the actual sequence goes like this that Greece suffered their their sudden stop in remember this uh the the forcasts are being made in Spring 2010 right Greece suffered its its sudden stop in the last quarter of 2009 after that the countries formulated their fiscal plans for 2010 then in Spring 2010 the forecaster made and it was assessed that that that the the the growth was still reasonable and then the sudden stop occurs so the the sudden stop occurred while people not just the IMF but all forecasters were still projecting reasonable growth maybe rightly maybe wrongly but the growth projections were still quite reasonable at that point when when the the the sudden stop when the investors panicked right here's here's here here's a a chart for Greece which shows you the absolutely tremendous uh uh uh degree of the sudden stop that that that um I I can't show you all the countries but the Greece experienced these are are foreign Bank claims on Greece um foreign Banks had very very roughly uh you can see from the graph they had lent Greece about 100% of GDP and within two years they taken almost all of that back right and and foreign Bank claims essentially went to zero so this is a tremendous powerful on Greece on Portugal on Ireland to leester extents on Spain and Italy uh even to a certain extent on France uh uh you you see this and it it it uh uh it's it wasn't really the result of of growth prospects it's really the result of a deterioration in the structural fiscal balances so here's here's um uh here's an illustration of this so so the Top Line the green line shows you that what the the IMF was projecting for Spain's fiscal bounces in in uh 2008 which was continued surpluses stretching out as far as the eye could see in Spring 20 2009 uh the IMF said well there's a deterioration but things are going to get better over the medium term they'll bring their budget back into balance by Spring 2010 the IMF had to admit the deterioration is large and it's going to stay large forever that's really that's really where the action was for for all the countries that were hit uh now uh if if that's the case then then we we can we can treat the sudden stops as an independent event and uh that's not caused by the planned adjustment and what I want to argue uh is that this is really going to affect the interpretation of of the results in this paper yeah okay so here's some Goble de cook but it's it's actually pretty it's it's it's it's pretty easy so I'll I'll I'll I'll go through it the the first equation which I've written very conveniently is equation five says the the the change in output depends on the the fiscal balance so so so if you have a larger deficit grow if um sorry if you if you have austerity uh you try and correct the deficit your growth Goes Down And if interest rates rise uh growth goes down as well so you have this you have this model of the economy the growth depends on what you're doing to fiscal policy and on interest rates and equation six just says we know this model and therefore we use it to make our forecast that's what the f is so the forecast error is then 5 - 6 and that splits down into to three three terms one is the the the forecast change in the fiscal balance that multiplied by uh the error in the fiscal multiplier that's beta minus BF and then it's also the the actual multiplier um uh uh multiplied by the error that you made in forecasting the fiscal consolidation and then it it also depends on the change in interest rates uh compared to what was forecast so you have three terms there and essentially what Blanchard and Lee are doing is they're only looking at the first term uh of of this and so you can see that that from the perspective of this very very simple model they're they're they're omitting to key variables and that's going to bias the results very very badly uh uh in particular if it's the case that the plan adjustment is correlated with fiscal adjustment forecast error or the interest rate forecast error in other words if if the first if the if the the the the first variable if the variables are correlated in these equations then omitting two of them is going to get you into deep problems and what I'm going to claim in the rest of the time I have available is that these variables are completely correlated all right so now and I'm going to show you this by taking an extreme example let's say the forecasters use the correct multiplier that they absolutely the multiplier and what I'm going to do is I'm going to say that that on the basis of of certain assumptions uh you're going to get a relationship of the type that Blanchard got even when the correct multiplier has been used right and now he's then going to turn around and use that to to claim that people use the incorrect multiplier all right now what are the assumptions I I need to do in order to prove this I need to assume that I need to make some very reasonable sounding assumptions first I want to assume that plan adjustment depends on the existing fiscal balance in other words if you've got a large fiscal deficit you're going to want to reduce it right sounds plausible right the second I want to claim is that the intensity of the crisis depends on how bad your fiscal situation is that sounds plausible too and the third thing I want to claim is that that countries when they get into a crisis which is generated by the large fiscal deficits they're going to try and respond by tightening their fiscal policy so I make these four the the first is just a maintained hypothesis but the the the three are are are key plausible assumptions and I'm going to show you that just using these plausible assumptions you can get a bland Shard result even if the multiplier is correct all right so here we go the first equation is just the equation that I I I showed you before but I've omitted the first term because by uh construction I've assumed there is no multiplier error right so so the equation is the growth error depends on the error in forecasting the fiscal balance and the error in forecasting interest rates and then my equation one is the equation that I mentioned earlier to you that if you have a bad fiscal balance you're going to try and correct it equation two says if you have a bad fiscal balance you're going to get an interest rate attack and then equation four says if you have an interest rate attack you're going to correct try and correct the fiscal balance uh if you actually plug 1 2 and 4 into equation 9 I won't show this to you you can get equation 10 equation 10 is Blanchard's equation and I'm not going to prove this to you but I'm I'm going to I'm going to handwave uh a little bit so so that you can see this right uh you if you if you look at if you look at uh the equation nine you you you you see a term Delta fiscal balance forecast right uh that that depends on in equation one on on on the phisical balance uh sorry uh sorry uh take um take the other way around the first term that you see on the right hand side is the Delta fiscal balance from equation one you can see that that's linked to the fiscal balance forecast uh uh so so then in in you have the first term that's that's Delta fiscal balance in in uh uh in the first you you've substituted out you've got the Delta fiscal balance for Delta FB and then you've got Delta if phisal balance and then then after that you've got R minus RF but in equation two that's related to the fiscal balance but from equation one uh fiscal balance is related to the Delta fiscal balance forecast so basically what I'm saying is through substitution you can get everything on the right hand side to to be a Delta FBF and therefore you get equation 10 which is the growth forecast error depends on the Delta fiscal balance that's forecast so so you see I started with the assumption that the multiplier correct and I got the Bland chart equation right even so what I want to say here is that okay you can estimate this equation you can get you can get a coefficient for Lambda but you cannot necessarily interpret that as as a mistake in the multiplier it under the set of circumstances that I described which seemed quite plausible actually this is just this this is just Association there's no there's no there's the you you you cannot possibly interpret it this in the way the pl Shard uh uh interpreted it okay um what I want to do next and and then I'm going to end is is to show that that these uh uh assumptions that that I claim seem reasonable are actually factually correct so so so let's start uh let's start with the equation 1 2 and four the first equation says that the change in the fcal balance uh that was forecast the planned adjustment depends on how bad your fiscal deficit is right um so we tested that and we tested it on uh data uh uh saying we started with your fiscal balance in 2009 like planchart did and we said how did your structural balance in 2009 affect what your fiscal consolidation plan was for 2010 and 2011 and the the the answer you can see from the T values uh we did this for for going through 2012 going through 2013 going through 2014 every single year we get basically the same result for for every one percentage Point by which your your fiscal situation was worse in 2009 you plann to have an adjustment of about half percentage point every year uh T values are very high so yes indeed there was a a relationship between how bad your fiscal situation was in 2009 and your planned fiscal consolidation second equation was there a link between your fiscal balance in 2009 and the interest rate attack yes uh uh uh uh first time going to handwave uh in in 2014 uh Greece Greece be because of of what I just showed you uh sorry in in uh uh the the fiscal the the reason the reason there uh there was this link was precisely because as I showed you the corrections that were planned were very were very minor compared to the fiscal problems that that that they had they were only planning to correct half their problems so for example Greece they were projecting in uh uh in in Spring 2010 that they even 5 years out were still going to have a structural deficit of 8 and a half percentage point of GDP all right so when you make a projection like that is really not surprising that the markets Panic all right now I'm going to show it to you a little more formula which is that yes the interest rate errors have a strong link to the 2009 structure balance if you had a bad situation and you weren't planning to correct it the markets going to react badly and they did uh uh uh during this Peri period now now let's now let's look at the the relationship between that the interest rate increase and the extra adjustment Beyond What was forecast uh the claim is the countries responded to storing interest rates by stepping up fiscal consolidation and here's the evidence uh uh very strong correlation between the interestate errors and the additional fiscal consolidation that that the countries did over every single time period all right so what I just showed you was two things first I showed you that under some plausible assumptions the Blanchard Lee result has absolutely cannot be interpreted in the way that they interpreted that and then I showed you that these plausible assumptions have evidence be behind them and so what I what I want to claim is that in fact the finding the the interpretation is not correct and that the problem is that it's only it's only true if the countries that plann large fiscal adjustments in 2009 were random samples but they weren't they were countries with weak fiscal positions and therefore they were hit hard by the Euro crisis and therefore they suffered huge growth shortfalls and so that there's a huge omitted variable bias in in his presentation all right now one last thing and then I'll finish which is okay but the under but the underlying question was was was really was it was it the fiscal adjustment that killed or the Euro crisis that kill growth so let's as the last thing I want to do is I want to test that and uh I I do it I do it by just running a regression of the growth forecast errors on the plan consolidation and on the interest rate errors and I measure the interest rate errors in three ways increase in CDs spreads increase in long-term Sovereign interest rates increase in uh interest rate forecast ter no matter how you do it you you you you see something astonishing the interest rate increases are have large coefficients that are significant and the plan fiscal consolidations have insignificant coefficients you can get that with CDs spreads you get that by using interest rate increases on uh long-term sovereign debt uh and you get that by using interest rate forecast errors that that the the the the effects of the interest rate errors are very powerful and the effect of the plan fiscal consolidation is not powerful and so so I conclude that sure there was an association between plan cons consolidation in the gr forecast erors but the their interpretation was wrong the it was not the that the forecasters under EST multipliers it was that they missed the the Euro crisis and this is huge implications because if if if the multipliers aren't aren't so large then countries do not need to be as scared of f consolidation as they were in in 2012 when they saw the Blanchard Le results and panicked and stopped doing what what they were doing uh so uh that's
Up Next

6:00
Say's Law of Markets: Supply Creates Its Own Demand
@ashok.eco1481
9.9K views•2018-12-18

5:07
Impact of Yuan in Indo-Russian Trade Amid Sanctions
@WION
261.9K views•2022-07-01
10:33
Behavioral Economics Explained: Rationality, Nudges, and Risk
@crashcourse
1.1M views•2016-03-12

113:18
The Age of Easy Money: Fed & Inflation | Full Documentary
@frontline
21.2M views•2023-03-15
Related Study Plans & Knowledge Roadmaps
Structured learning paths in Economics
economics
Sovereign Debt: Defaults, IMF & Restructuring
01Introduction to Sovereign Debt & Government Bonds
02Debt Sustainability & Credit Ratings
03Anatomy and History of Debt Crises
+ 2 more learning modules
12h5 modules
Explore Roadmap
economics
Market Design: Matching Theory & Gale-Shapley
01Introduction to Market Design and Price-Free Markets
02Two-Sided Matching & The Gale-Shapley Algorithm
03School Choice Systems and Mechanism Design
+ 2 more learning modules
10h5 modules
Explore Roadmap
economics
Impossible Trinity: Forex, Capital & Policy
01Introduction to Monetary Policy and Central Banking
02Exchange Rates and International Capital Flows
03The Mundell-Fleming Model
+ 2 more learning modules
8h5 modules
Explore Roadmap
economics
Healthcare Economics: Market Failures & Systems
01Introduction to Healthcare Markets and Market Failure
02Asymmetric Information and Adverse Selection
03Moral Hazard and Insurance Design
+ 2 more learning modules
12h5 modules
Explore Roadmap