















![[Microeconomics II]Maximization of Welfare | Utility Possibility Frontier | Iso Welfare curves |17|](https://i.ytimg.com/vi/TjqAYex11NM/maxresdefault.jpg)


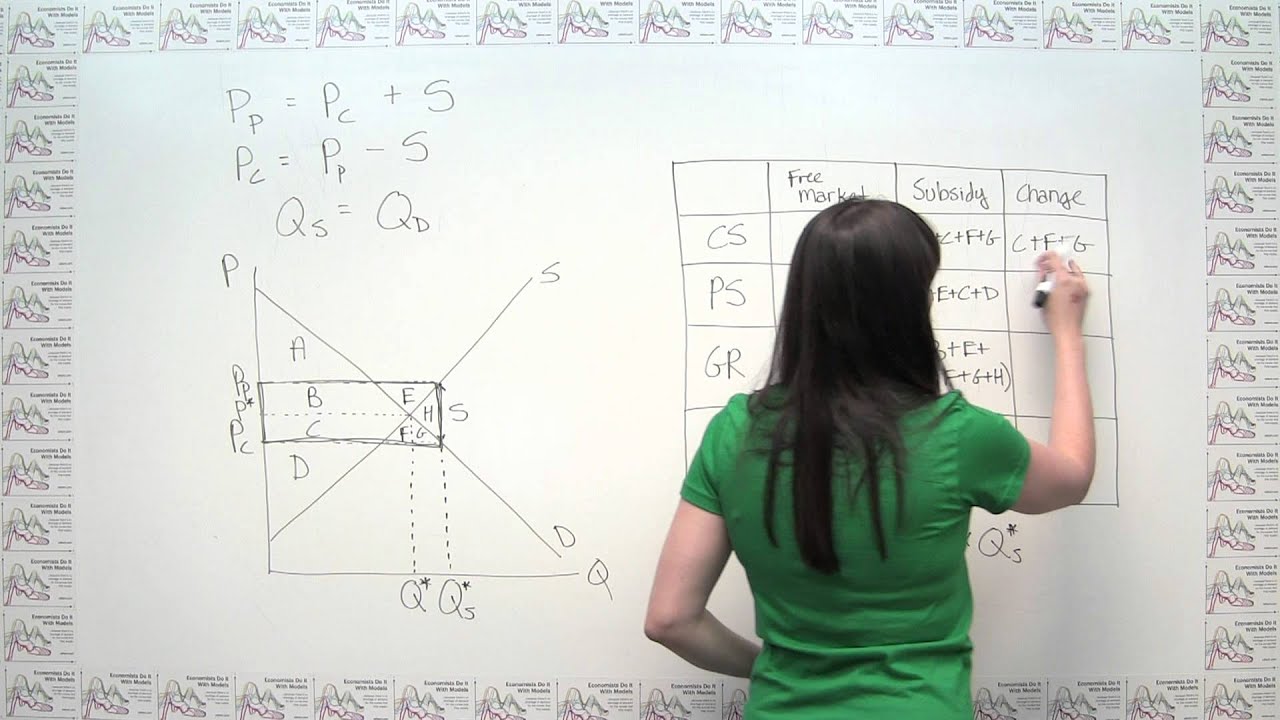
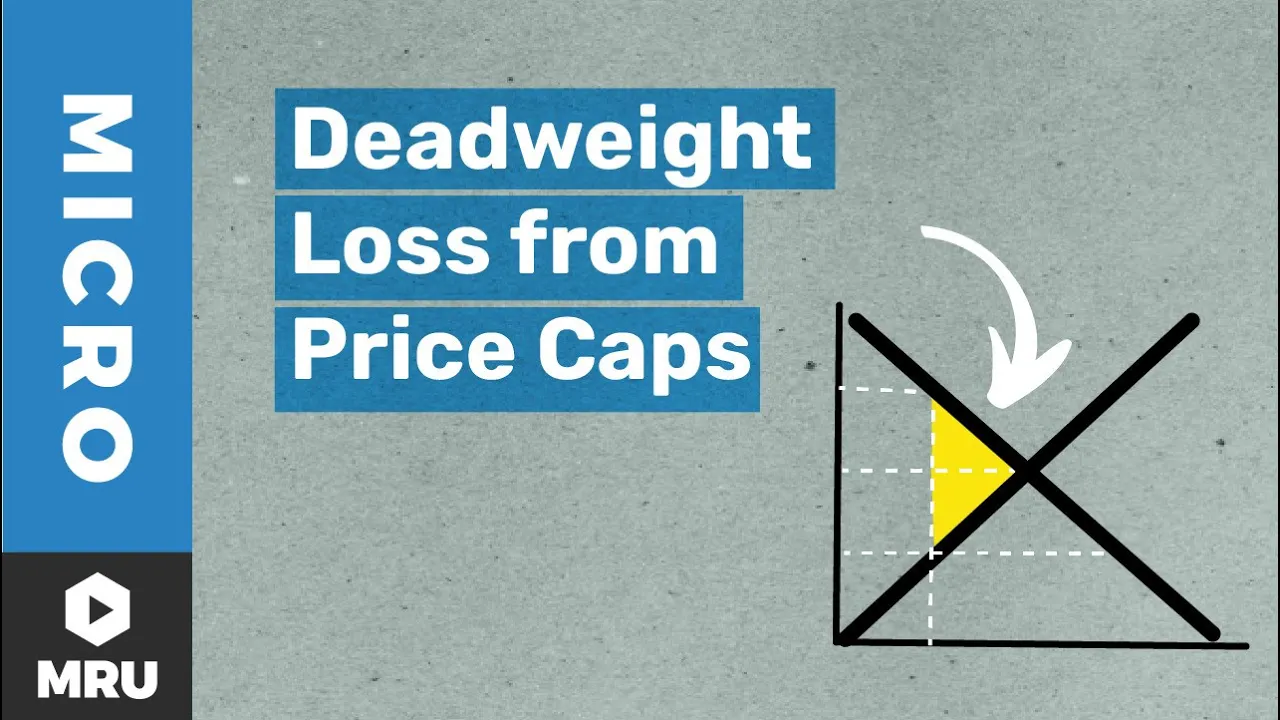


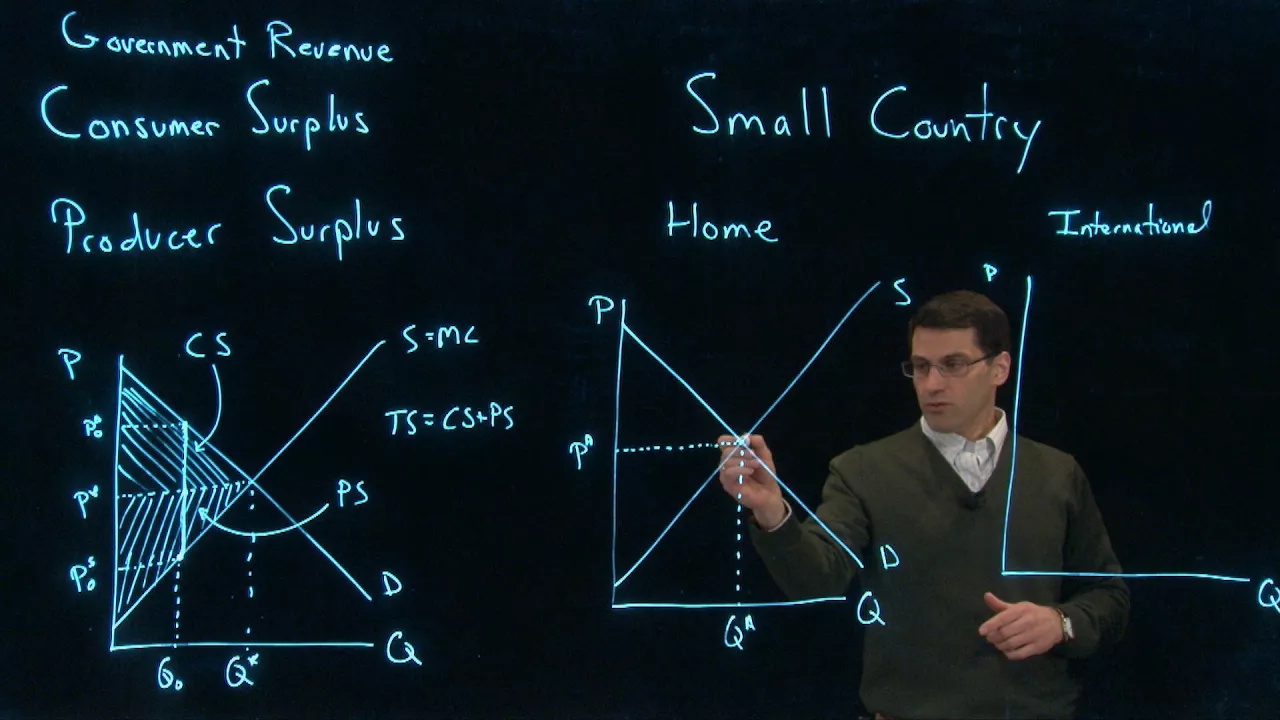
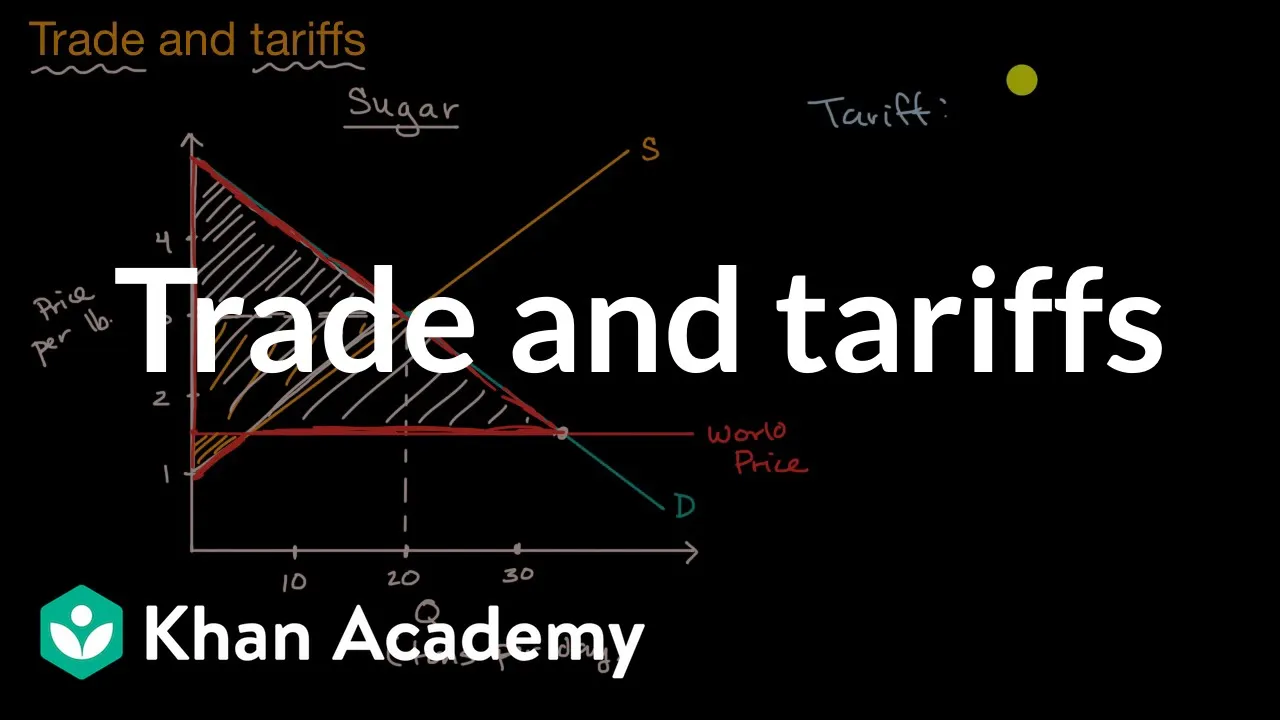

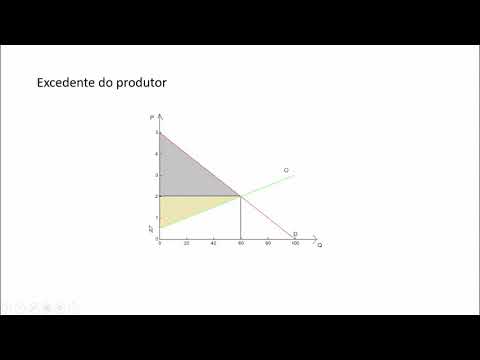
Producer surplus is the economic benefit that producers receive when they sell goods at a market price higher than their minimum willingness-to-accept price (opportunity cost), represented graphically as the area above the supply curve and below the market price line; for a linear supply curve, it can be calculated using the formula: Producer Surplus = ½ × Base × Height, where Base is the quantity produced and Height is the difference between the market price and the minimum supply price.
Producer Surplus Explained: Microeconomics Example & Graph
Added:Understanding the Law of Supply and how the supply curve represents a producer's marginal cost and willingness to sell.
The concept of Market Equilibrium, specifically how the intersection of supply and demand curves determines the market price.
The conceptual distinction between market price (what a seller receives) and opportunity cost (the minimum price a seller is willing to accept).
Basic geometry and graphing skills, particularly how to identify coordinates on a graph and calculate the area of a right triangle.
Combining producer surplus with consumer surplus to calculate and analyze Total Social Surplus.
Evaluating Market Efficiency and understanding how competitive markets maximize total economic welfare.
Analyzing Deadweight Loss resulting from market interventions such as taxes, subsidies, price ceilings, and price floors.
Applying welfare economics to international trade to see how tariffs and import quotas redistribute surplus between domestic producers, consumers, and the government.
522.1K views1.9Klikes8:20Original Release: 2012-01-09
We have now talked a lot about the demand curve and the consumer surplus; now let's look at the other side.
Let's think about the supply curve and you could imagine that there might be something called the producer surplus.
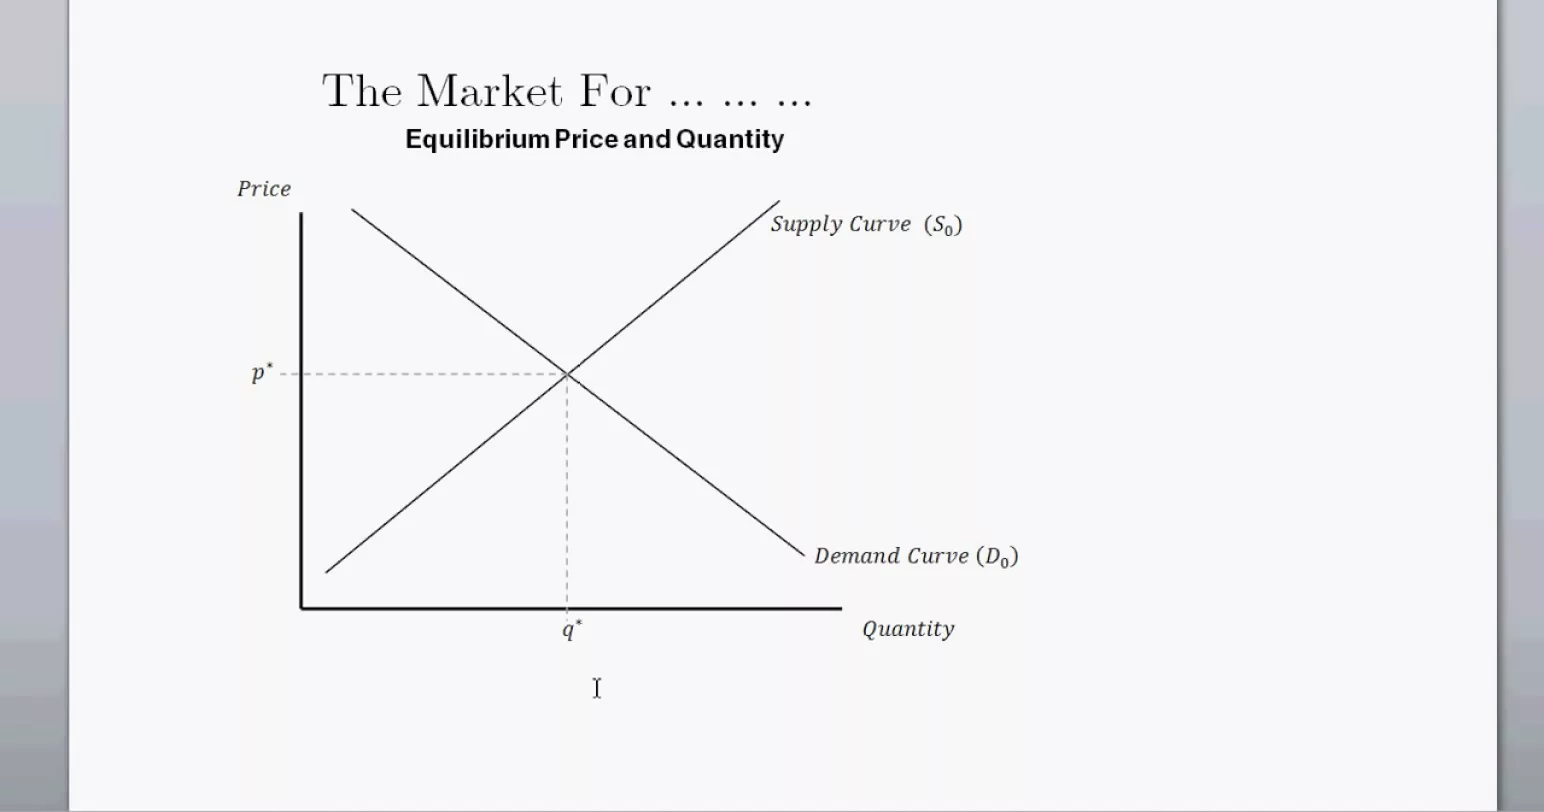
So let's say that this is price axis, this is the quantity axis and let's say that we are running some type of a berry farm and this is our supply curve.
That is the supply curve and this is our demand curve.
So that is the demand and just like what we did to the supply curve, for the demand curve, now instead of thinking of a price and think about how much quantity would be supplied, let's think about a given quantity and think about what price would it have to be in order for the producers to produce that quantity.
And let's say that this quantity right over here, this is in thousands of pounds of berries, thousands of pounds.
So this is 1 thousand pounds, 2 thousand pounds, 3 thousand pounds, 4 thousand pounds, and 5 thousand pounds.
And let's say this price right over here is 1 dollar per pound, $2, $3, $4, maybe I could make it more even, so this is $3, this is $4, this is $5 per pound.
Let me write this all in per pound.
So let's say that we want the suppliers to produce 1 thousand pounds of berries, so this is we want them to produce 1 thousand pounds of berries, What does the price have to be for them to produce 1 thousand pounds of berries. Well think of it from the suppliers from the berry farmers' point of view. If they are going to produce 1 thousand pounds of berries. in order for them to produce it, in order to convince them produce it, they have to get at minimum as much as they would get using the same resources to produce something else.
So if they could get a dollar per pound or equivalent in dollars of a dollar per pound for those first thousand pounds, so about a thousand dollars. If they could get that by using their land for an apple orchard or using it to graze or maybe renting out the land to someone else, that's the minimum you would have to pay them. Because if you pay them less than that they would go do the other thing. They would go and rent their land out or they will allow their land for grazing.
So you would have to pay them the opportunity cost for them to produce a thousand pounds. So the opportunity cost for them to producing a thousand pounds would be right over there. And this is on average first thousand pounds you could also think that the very first pound, the opportunity cost would be right over there, and the next pound would be right after that. The five hundred pound would be there, the thousand pound would right be there. or you could say the first thousand pound on average would be right over there.
Now let's say that we wanted them to produce another thousand pounds. So we want the market or this entire farm to produce or maybe it's multiple farms to produce a total of two thousand pounds. What would we have to do?
Well, same exact thing. We kind of assuming the market is already producing that first thousand pounds. So now we would have to think about what are they giving up to produce that next thousand pounds. And now we would assume that for that first thousand pounds, they would have used the land and the inputs that are most suitable so this is the most suitable resources. So we are talking about the labour that really knows how to grow berries.
The land where the berries are the best grown and maybe they are really close to transportation networks so it's much cheaper to produce and ship from there. But now if we want another two thousand pounds of berries at this time period and maybe this per year if we want another thousand pounds.
They are now going to less suitable resources, maybe the land is slightly further away from the transportation resources, they are now going to have labours that are slightly less efficient, they are going have to take land away from that.
might have been slightly more suitable for other things.
So now the opportunity cost for these growers for the next thousand pounds is going to be slightly higher.
So their opportunity cost is going to be like that on average for the next thousand pounds. You could that the opportunity cost for the one thousand pounds will be right over there for the two thousand pounds would be right over there. But on average for the two thousand pounds, this is their opportunity cost now, same thing, the next thousand pounds after that If we want to get the market, if we want the whole supply be three thousand pounds they would have to produce, they would have to get that their opportunity across that incremental thousand pounds that opportunity cost of that incremental thousand pounds.
So view it as this way, the supply curve no longer and it is the same exact curve, before we used to say, oh if we want how much would people produce if the price were 3 dollars.
Oh they produce 3 thousand pounds, now we are looking at the other way, we are saying if we want the suppliers to produce 3 thousand pounds, what would the price actually have to be. Now with that out of the way, now we can think about the supply curve is really a opportunity cost curve for the suppliers. And let's say that this is supply and the demand, and then this would be the actual price which supply equals demand right over there so let's just say that is the market price. So what's going on over here, all of the suppliers, so this is the price here let's just for making the math simple, let's just say that price here is 4 dollars and the quantity demanded and the quantity supplied here is 4 thousand pounds. What's going on here, the very first 4 thousandth pound produced by the suppliers, the opportunity cost for them to produce it would be 4 dollars. We are gonna get exactly 4 dollars for it so they are right on the fence. but for the first three thousand 999 pounds, the opportunity cost of producing it was lower than the price to get it, so in this situation the producers are getting more, for the first 3999 pounds.
They are getting more for their berries than their opportunity cost and just like we talked about, the consumer surplus, this is the producer surplus. So, for example, for the first thousand pounds right here, the producers, their opportunity cost was a little over a dollar a pound but they are getting 4 dollars a pound for it.
For the next thousand pounds, the opportunity cost is approaching 2 dollars per pound, like a $1.75, just eyeballing it.
Once again, they are getting 4 dollars a pound for it so they are getting this surplus, so if you think about the entire market, the producers as a whole, they are getting this entire area, this entire area represents the excess value that they are getting above and beyond their opportunity cost, and we call this right over here the producer surplus, the producer surplus. And we are assuming or we will assume a linear supply curve right over here. This is just a triangle, the area of a triangle. This length right on this side is just 4-1, it's just 3, 3 dollars per pound and then this length right over here is 4 thousand pounds, 4 thousand pounds. So to find the producer surplus, we are just finding the area of this region.
So, let me write this, the producer surplus here is going to be, I will use the same color, 3 times, I want to do it with pink, 3 times the 4 thousand, and that would give us the area of this entire rectangle, so we have to divide it by 2. That's just finding the area of the triangle, so times one half, dividing by 2. And so this gives us one half times 4 thousand is 2 thousand times 3 is 6 thousand.
And you could look at the unit, it's 6 thousand or 3 dollars per pound times thousand of pounds per week so we end up with, so the, we end up with 6 thousand dollars of producers' surplus per week.
Up Next
5:35
The Laffer Curve Explained: Tax Rates and Revenue
@EconplusDal
149K views•2016-06-14

5:07
Impact of Yuan in Indo-Russian Trade Amid Sanctions
@WION
261.9K views•2022-07-01

10:27
Keynesian Cross & Multiplier: Fiscal Policy Effects
@khanacademy
218.5K views•2012-04-05

113:18
The Age of Easy Money: Fed & Inflation | Full Documentary
@frontline
21.2M views•2023-03-15
Related Study Plans & Knowledge Roadmaps
Structured learning paths in Economics
economics
Sovereign Debt: Defaults, IMF & Restructuring
01Introduction to Sovereign Debt & Government Bonds
02Debt Sustainability & Credit Ratings
03Anatomy and History of Debt Crises
+ 2 more learning modules
12h5 modules
Explore Roadmap
economics
Market Design: Matching Theory & Gale-Shapley
01Introduction to Market Design and Price-Free Markets
02Two-Sided Matching & The Gale-Shapley Algorithm
03School Choice Systems and Mechanism Design
+ 2 more learning modules
10h5 modules
Explore Roadmap
economics
Impossible Trinity: Forex, Capital & Policy
01Introduction to Monetary Policy and Central Banking
02Exchange Rates and International Capital Flows
03The Mundell-Fleming Model
+ 2 more learning modules
8h5 modules
Explore Roadmap
economics
Healthcare Economics: Market Failures & Systems
01Introduction to Healthcare Markets and Market Failure
02Asymmetric Information and Adverse Selection
03Moral Hazard and Insurance Design
+ 2 more learning modules
12h5 modules
Explore Roadmap