
![Analisis Estadistico - Ayudantia 1: Probabilidad Condicional, Total y Teo. de Bayes [Nicolás Gatica]](https://i.ytimg.com/vi/eXxe6At7GKw/maxresdefault.jpg)




















Bayesian inference is a statistical framework where we place probability distributions on unknown parameters (called priors) and update these beliefs using observed data through Bayes' rule to obtain posterior distributions, which allow us to compute probabilities of hypotheses and make informed decisions under uncertainty; in the football field example, Tom uses a normal prior with mean 100 yards and computes the posterior distribution to determine the probability that the true field length is less than 100 yards, enabling him to make a rational bet with his coach.
Bayesian Inference Example: Univariate Gaussian with Gaussian Prior
Added:Understanding of Bayes' Theorem and its components: prior probability, likelihood, posterior probability, and marginal likelihood.
Familiarity with the Normal (Gaussian) distribution, including its probability density function (PDF), mean, and variance.
Basic knowledge of algebraic manipulation, specifically the method of 'completing the square' in quadratic equations.
Conceptual grasp of continuous random variables and probability density functions.
Bayesian inference for a Gaussian distribution with both unknown mean and unknown variance (using the Normal-Inverse-Gamma prior).
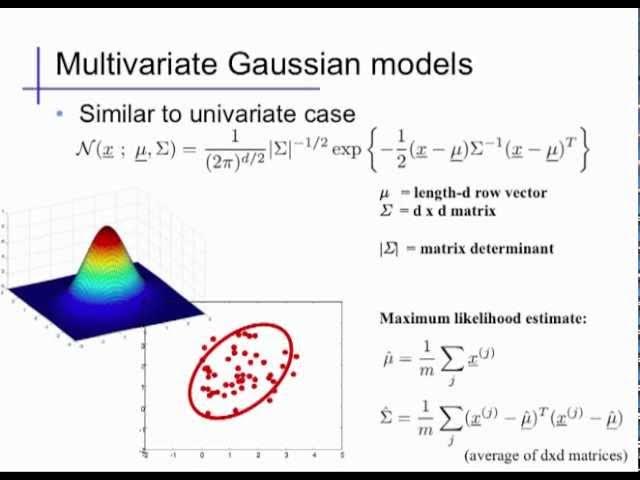
Multivariate Gaussian Bayesian updates, extending the univariate case to multiple dimensions using vector and matrix algebra.
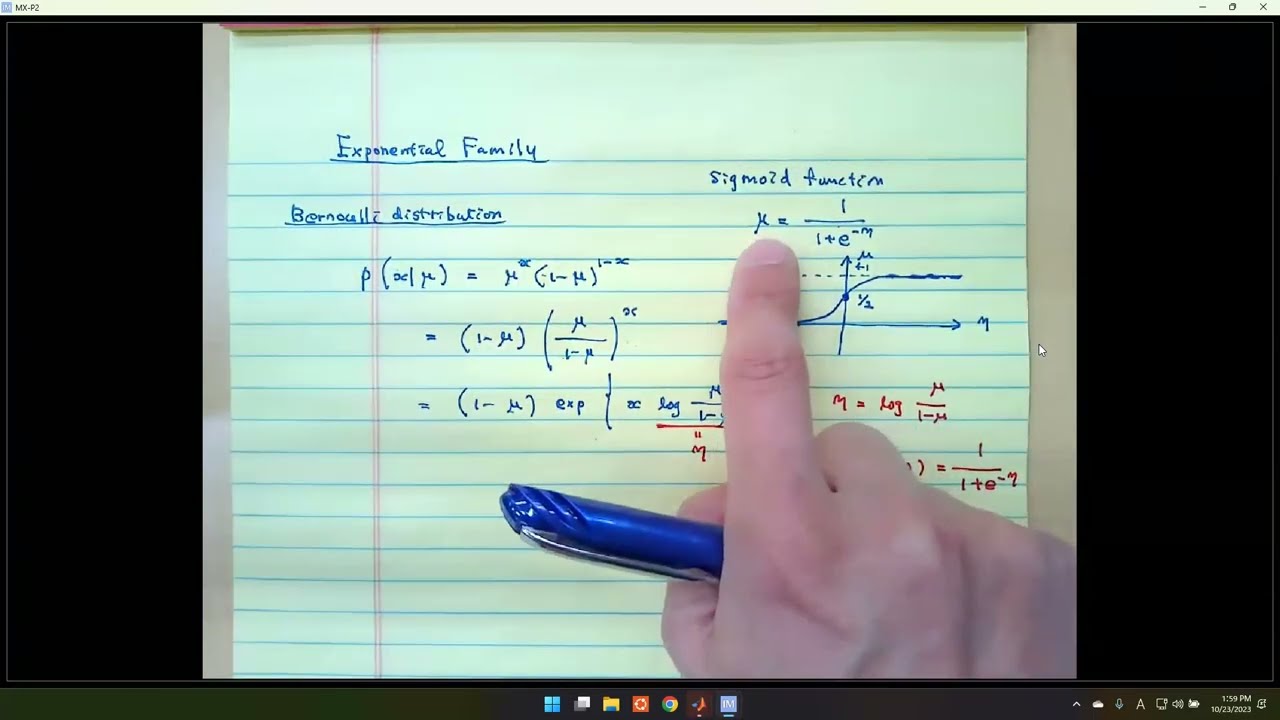
The formal concept of Conjugate Priors and their classification within the Exponential Family of distributions.
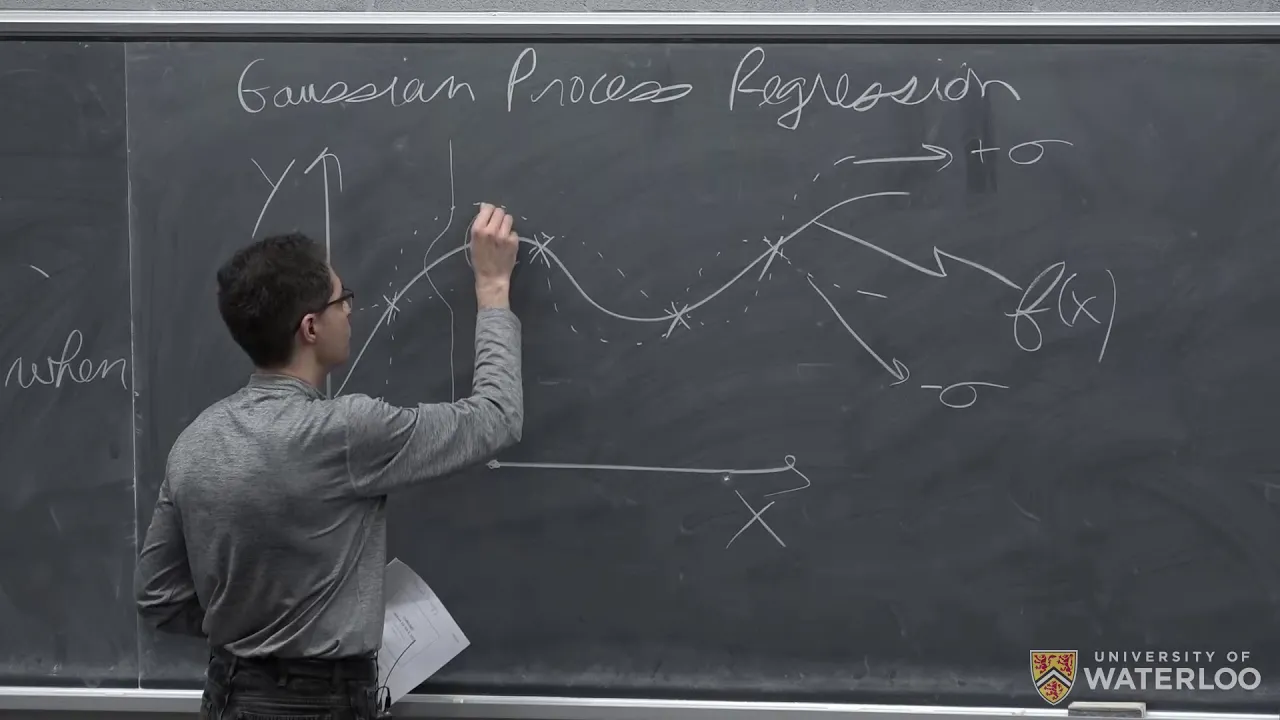
Practical applications in machine learning, such as Bayesian Linear Regression and Gaussian Process models.
Algorithmic approximation methods like Markov Chain Monte Carlo (MCMC) and Variational Inference for handling non-conjugate Bayesian models.
130.6K views500likes14:52Original Release: 2011-06-23
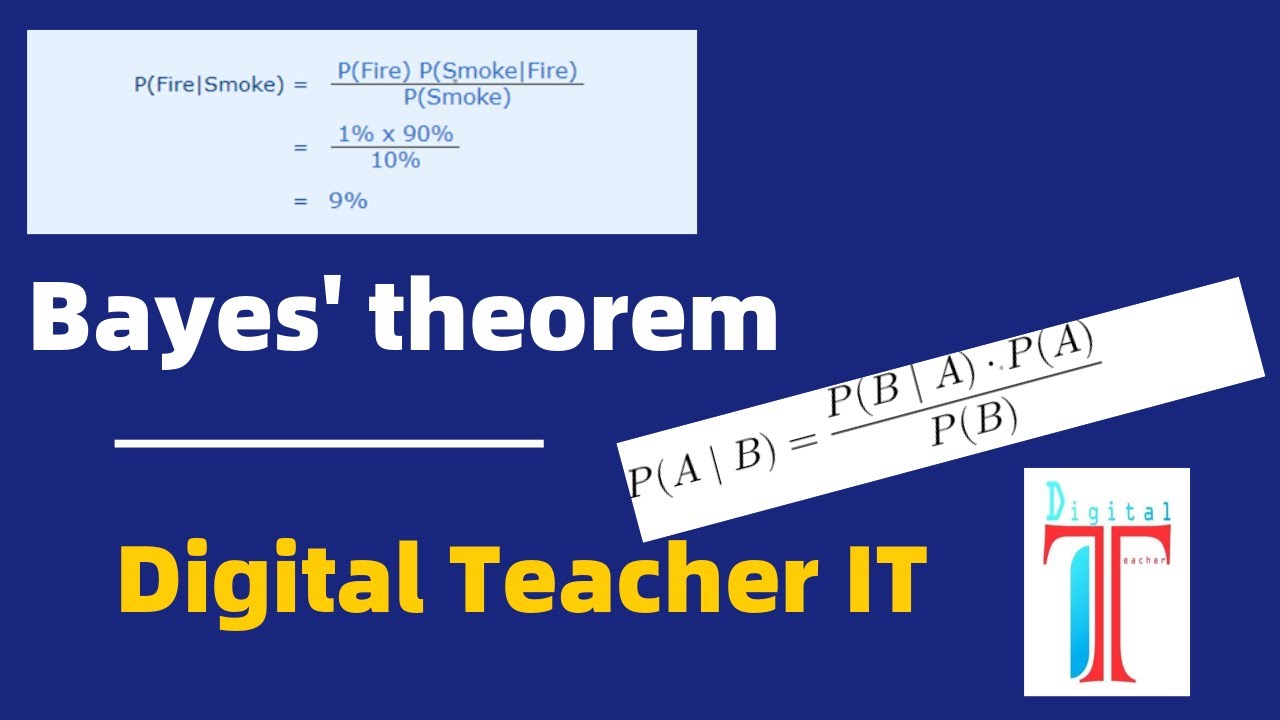
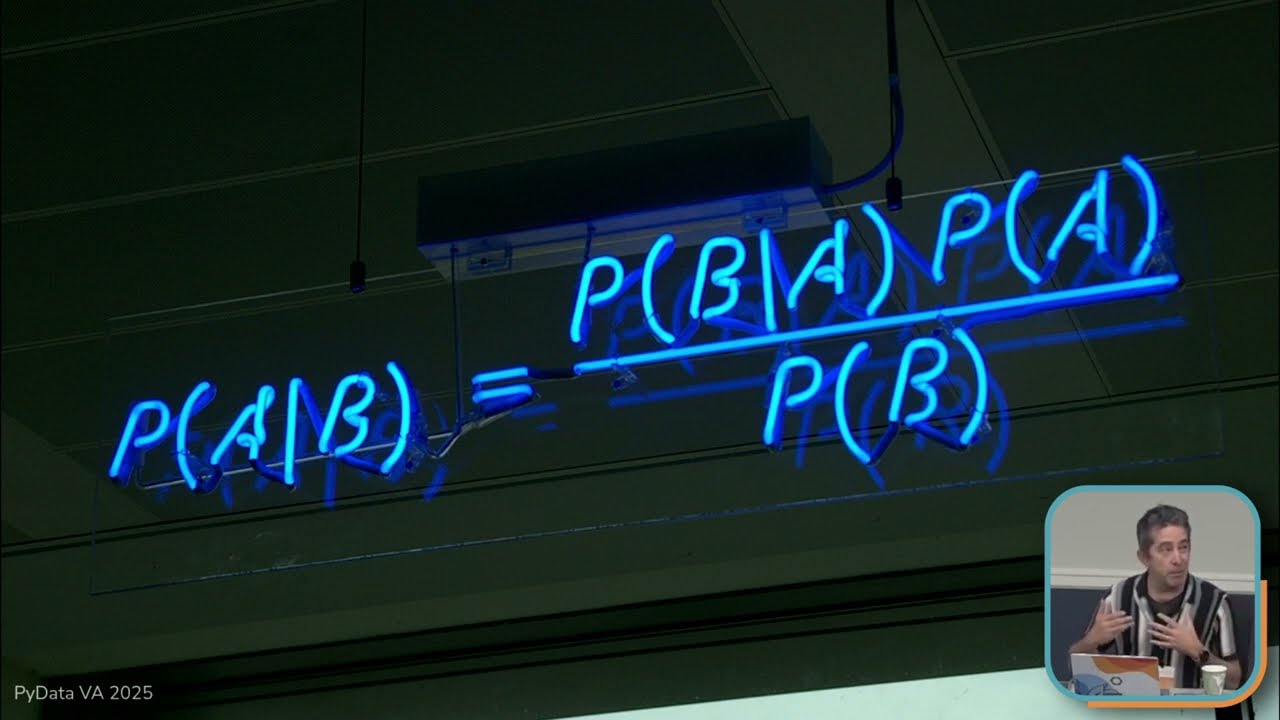
this video will be an introduction to the main idea of basian inference as they call it named after the Reverend Thomas Baye who in the 1700s formulated B's rule or at least he's credited with it and bayian inference the main idea well at least as I like to think about it is you put distributions on everything all the things that you're interested in roughly speaking everything and then use the the rules of probability you just use the rules of probability to figure out to infer what you're interested in knowing so let's illustrate this with a a little a little story so let's say Tom say Tom this is Tom Tom's a student at XYZ University and he is uh interested in earning some extra cash so Tom Tom decides to work at the athletics department so this is Tom and at the athletics department so he's working at the athletics department and they the coach of the football team there's the coach coach says hey Tom you're you're good at math and statistics you you know you take all the those those classes I'm skeptical about the length of our football field I think that it might not be actually 100 yards long so there's the football field and this is American football by the way and it's supposed to be 100 yards but we don't know or the coach doesn't know at least and so he says hey Tom why don't you go and figure out use all that statistics and stuff try to figure out how long this football field really is so Tom says okay let me think well figure out how to do this so Tom says all right well let's see all I've got here is this I've only all he's got is a little yard stick he's only got one yard sck he doesn't have a nice tape measure or anything you know one of those rly things to measure the length so all he's got is it's yard stick so he says all right well I'll I'll use this and he goes out and he makes some measurements so he has to you know line it up a bunch of times here and measure the length and he very patiently does that and he comes up with some measurements so he maybe he does that repeatedly since he's very statistically minded and he gets a first measurement of 101 yards and then he gets say 100.5 and 101.5 something like that so those are his three so let's call those X1 X2 and X3 so this is his data X1 X2 X3 and Tom says okay now I know that the Gan or normal distribution is good for modeling measurement errors so why don't I model my measurements here my x i as normally distributed with mean so the mean there's some true length I I think you know there there's some true length so let's say the mean is that true length and let's call that Theta so let's call Theta the true length and it has some my measurements have some variance let's say one yard something like that keep things simple and uh so Tom says to himself okay well now now I I have this model and oh and and also I should assume that these are independent or IID given this you know given this Theta and so Tom says okay now now that I have this I can compute the maximum likelihood estimate I can compute Theta mle which is just the sample mean of my data so that's just the average one over let's call n let's say n is three so it's just one over n times the sum of the XIs and here that's just uh let's see so that's just oh it's just 1001 so that's nice so we've got the mle but you know it's a point estimate and so um and also so one well one thing is it's a point estimate and the other thing is you know Tom says to himself I you know the football field I know it's supposed to be a 100 yards long and I haven't really accounted for that at all here so shouldn't I be sort of taking that into account you know uh the fact that I I have some prior knowledge about how long the football field should be and so he says okay well I know how to do that so let's so I can always put a a prior Distribution on Theta so I can take Theta to be a random variable and maybe make it normal just for just to keep things nice and simple and maybe it's normal with mean 100 it should ought to be 100 at least since that's what our expectation is and maybe very one so there's something you know you might be saying to yourself well wait a second you know I thought Theta was the true length I mean the field actually has some true length and and now you're saying that it's random and Tom says well yeah okay that is kind of funny but here's how I'm thinking about it I'm thinking about it as that this is my my the probability to distribution representing my belief about the true length of the football field before I saw any of the data so he says this is just this is just my belief this I'm not saying that the true thing is some random you know that the the true quantity is actually random this is just representing my my sort of Prior my uncertainty or or you know level of certainty about where it is okay so then using that prior Tom can compute the map estimate and so I I I uh so this is going to be somewhere between 10 1001 and 100 and we did this computation before Computing the map and so I can I pre-computed this and you can check that it's 100 75 so Tom gets these two measurements and he goes back to the coach and he says all right so I think I did some statistics I took some measurements I think it's longer than a 100 yards I think it might be actually around 100.75 yards and the coach says what that's you know that is crazy that that's not possible because I thought that it was shorter than 100 yards and in fact I'm so sure of the fact that that field is less than 100 yards I'll bet you $50 that it is shorter than a 100 yards and Tom says um okay well let's see $50 that would be that would be pretty nice let me think about this a little bit more so Tom goes off and he sits down and he's he starts thinking to himself he says well I just have these Point estimates and they would suggest that the length is longer than 100 yards but how certain am I really that it's longer you know that $50 you know that's a lot of money I don't have you know I'm you know strapped her cash that that would be pretty rough if I had to pay out 50 bucks so uh so let me think about how sure I am how certain am I that it's actually longer than 100 years so what Tom is interested in is the probability that Theta is less than 100 given his data this is the thing that Tom wants to compute and this is the probability in the sense that it's his level of belief about this because this prior is just in coding it's not some true thing it's it's his his level of belief so this is what Tom wants to compute and in order to compute that he needs to get the density of theta given the data right because if he had if he could get this density then he could somehow maybe using his computer at least or something he could he could figure out what the probability is you know how how much of that density how much of that that distribution is less than 100 and so this thing of course this is the prior or no not the prior this is the posterior Distribution on Theta given the data so Tom wants the posterior and in order to compute it he starts off he says okay well I can use Bay rule probability of theta given the data equals probability of the data given Theta times times the probability these are lowercase PS since this is a density or you know I use lowercase p for densities or pmfs and the times the probability of theta divided by the probability of the data but here it turns out that so there's a little trick called um well it's to write if you write a distribution as proportional to something else this is a function of theta if we can just write it as an expression that's proportional to Theta then we don't need to then that uniquely characterizes the distribution so oh well I guess we don't so that's that's not particularly important here so but anyway that you he does this and now he has a a defined distribution for the his data given Theta that's this this product of normals here times the probability of theta divided by the probability of the data and I'm not going to work it all out but it turns out that this posterior can be expressed in closed form as a gaan it's a normal distribution over Theta so this is a this is normal and if Tom works out all the computations he can analytically compute this and then use a lookup table or you know computer mat lab or something to compute this quantity and then he can you know say use decision Theory or you know to minimize his you know Define some some loss function and minimize his expected loss in this scenario and he can make an informed you know a well you know Justified decision about what to do whether he should bet the $50 or not so this is uh this is a characteristic sort of basian problem now Tom might also be interested in Computing he might want to know what is the Distribution on a new X so we had these X's what if we took what if he went out to and took another measurement then this is also normally distributed the same way and this is the probability of x given the data this is called the predictive distribution or sometimes people say posterior predictive and this well Theta doesn't appear here at all right but but you know X is defined in terms of a distribution given Theta these are IID given these are you know to sometimes people say conditionally independent given Theta and X is also conditionally independent of the others so he needs to integrate out Theta so this becomes probability of X and Theta given data and then this can be factored as the probability of x given since it's conditionally independent we can drop the dependence on the data times the probability of theta given the data and it's a beautiful fact it turns out that this also can be integrated analytically and the predicted distribution is also Gan it's a beautiful fact and so Tom could actually analytically compute this predictive distribution and use it as well so this is just a a motivating example for these are some classic sort of uh basian a basian approach to this to this type of problem
Up Next

5:30
Conjugate Priors Explained: Definitions, Examples & Why They Matter
@oxeduc4209
46.5K views•2014-08-12

4:43
Elliptic Curve Cryptography Explained: ECC, ECDSA, ECDH
@PracticalNetworking
28.5K views•2024-10-21

9:49
Measure Theory 1.2: Sigma-Algebras Defined | Probability Primer
@mathematicalmonk
176K views•2011-04-20

6:00
The Mathematical Impossibility of Accurate World Maps
@Vox
23.3M views•2016-12-02
Related Study Plans & Knowledge Roadmaps
Structured learning paths in Mathematics
mathematics
Tensor Calculus: Vectors to Riemann Curvature
01Mathematical Foundations: Linear Algebra & Calculus
02Covectors, Dual Spaces, and Tensor Basics
03The Metric Tensor and Index Gymnastics
+ 2 more learning modules
40h5 modules
Explore Roadmap
mathematics
Gödel's Incompleteness: Logic, Proofs & Limits
01Introduction to Formal Systems & Hilbert's Dream
02Set Theory, Cardinality, and Cantor's Diagonal Argument
03Arithmetization and Gödel Numbering
+ 2 more learning modules
14h5 modules
Explore Roadmap
mathematics
Galois Theory: Fields, Groups & Solvability
01Foundations of Abstract Algebra: Groups & Fields
02Polynomials & Field Extensions
03Splitting Fields & Symmetries
+ 2 more learning modules
24h5 modules
Explore Roadmap
mathematics
Non-Euclidean Geometry: Models & Geodesics
01Euclid's Fifth Postulate and the Birth of New Geometries
02Hyperbolic Space and the Poincaré Disk Model
03Geodesics: Defining Straight Lines in Curved Spaces
+ 2 more learning modules
15h5 modules
Explore Roadmap