

![#TerceirãoNãoTiraFérias🌴 | Química – TERMOQUÍMICA [Aula 2]](https://i.ytimg.com/vi/Oa3KHBMuvkQ/maxresdefault.jpg)




















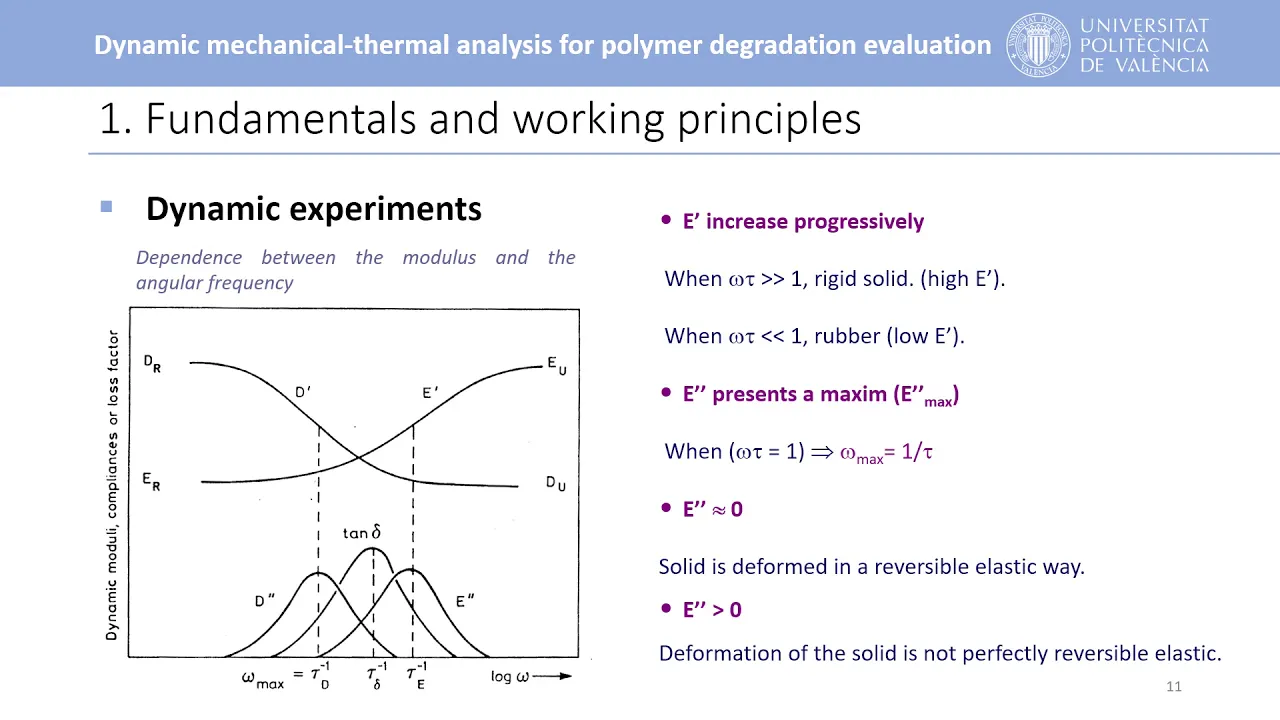


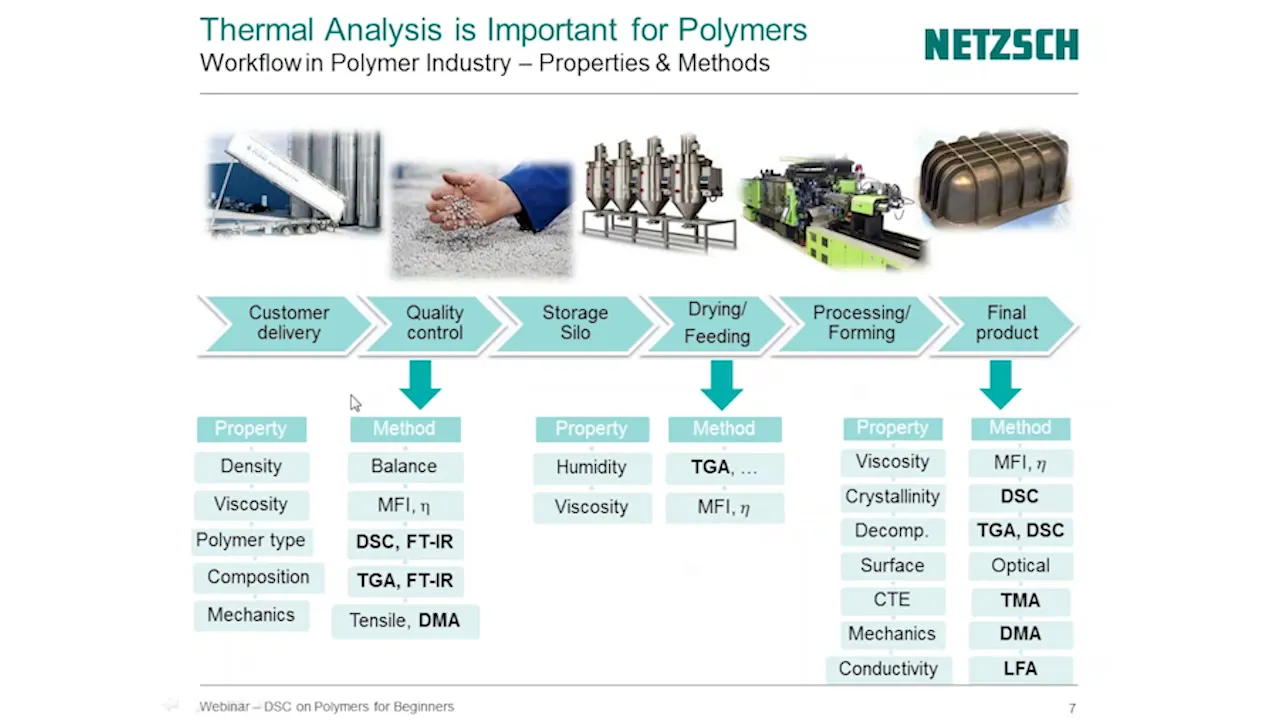


Differential scanning calorimetry (DSC) is a thermal analytical technique that measures physical and chemical changes in polymers by subjecting a small sample to controlled temperature variations and measuring its heat flow response; the technique produces characteristic graphs showing transitions such as glass transition temperature, melting points, and recrystallization events, which can be used for material identification, evaluating material condition, detecting degradation or contamination, and assessing the degree of cure in cross-linked materials, though interpretation requires experienced analysts and the method has limitations including sensitivity to contamination and inability to distinguish materials with similar thermal transitions.
Differential Scanning Calorimetry Basics: Thermal Analysis Guide
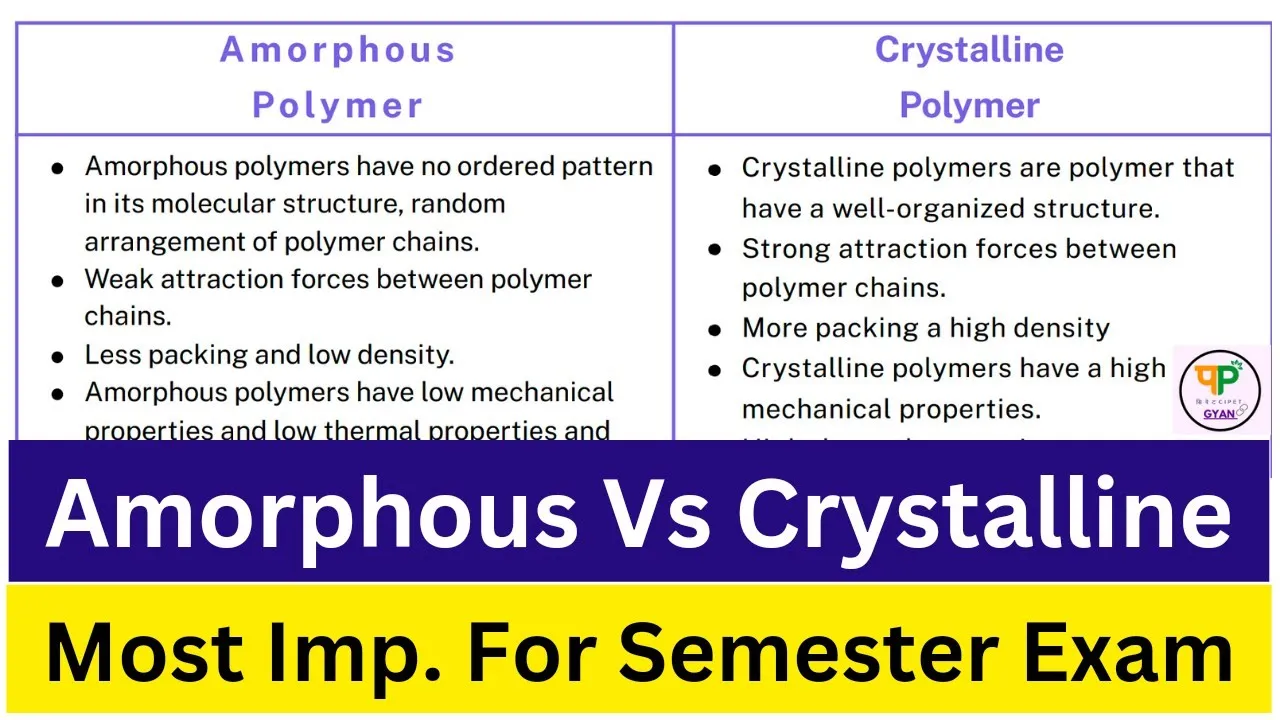
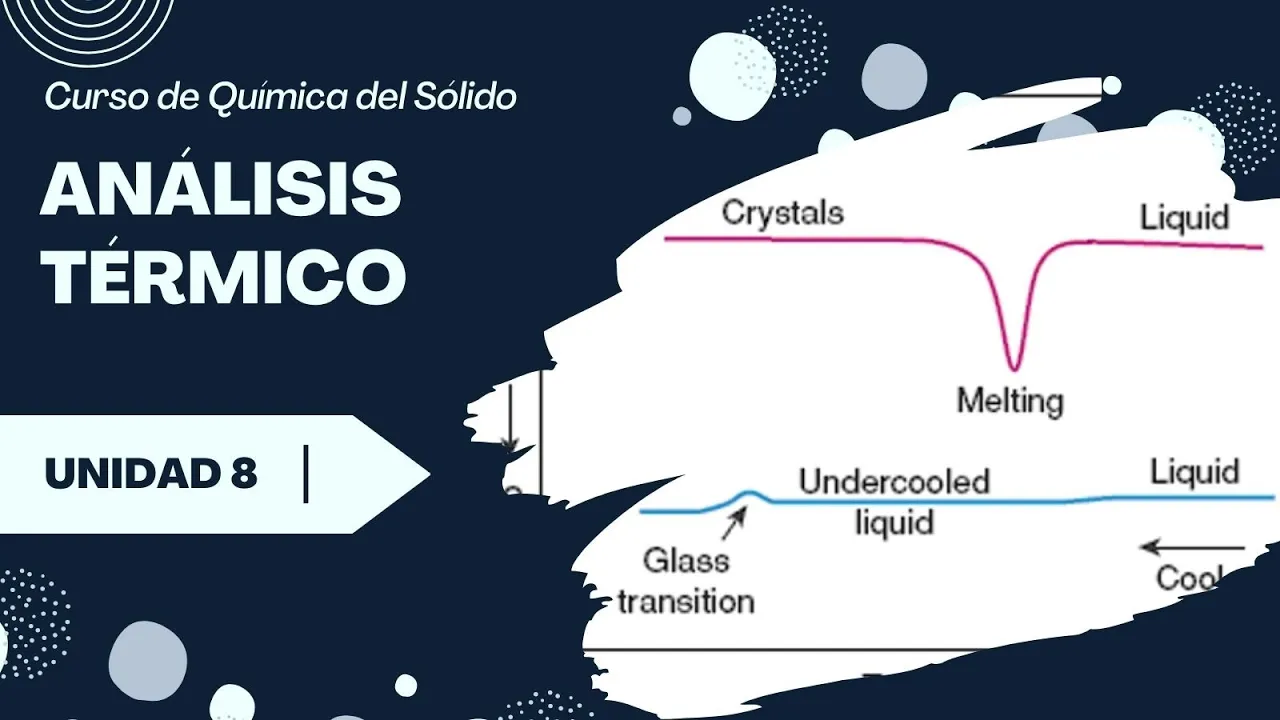
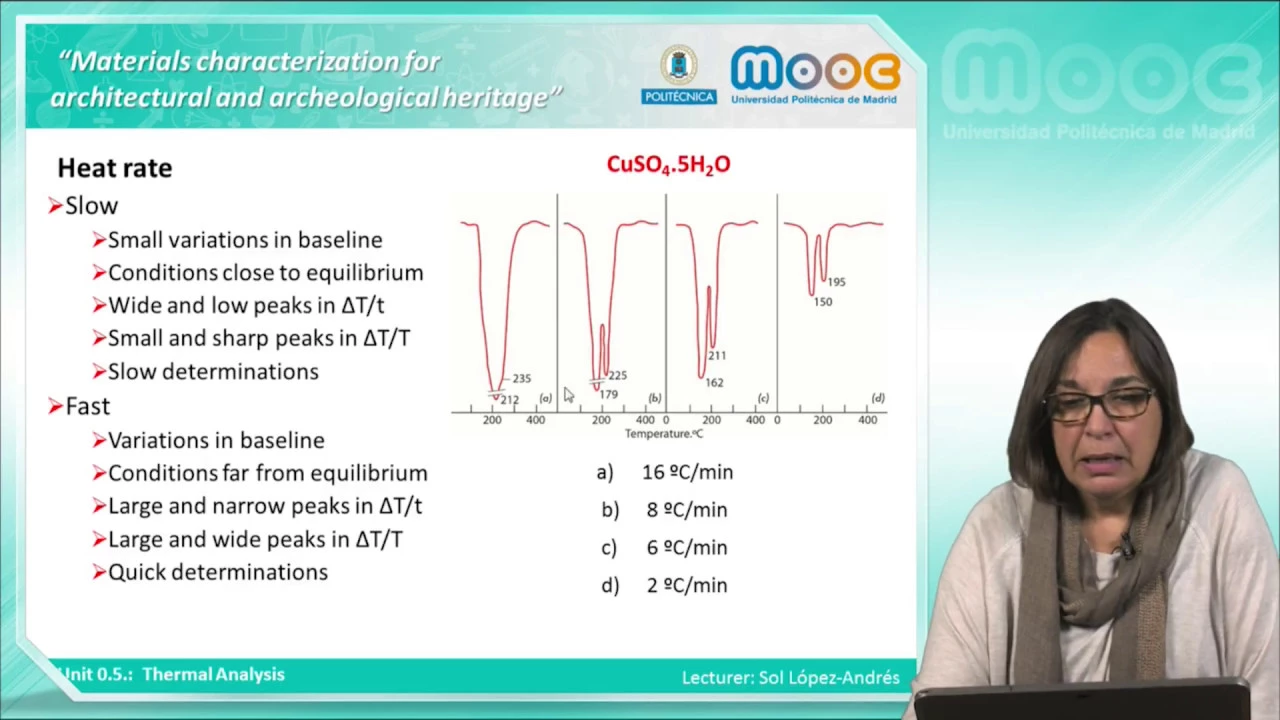
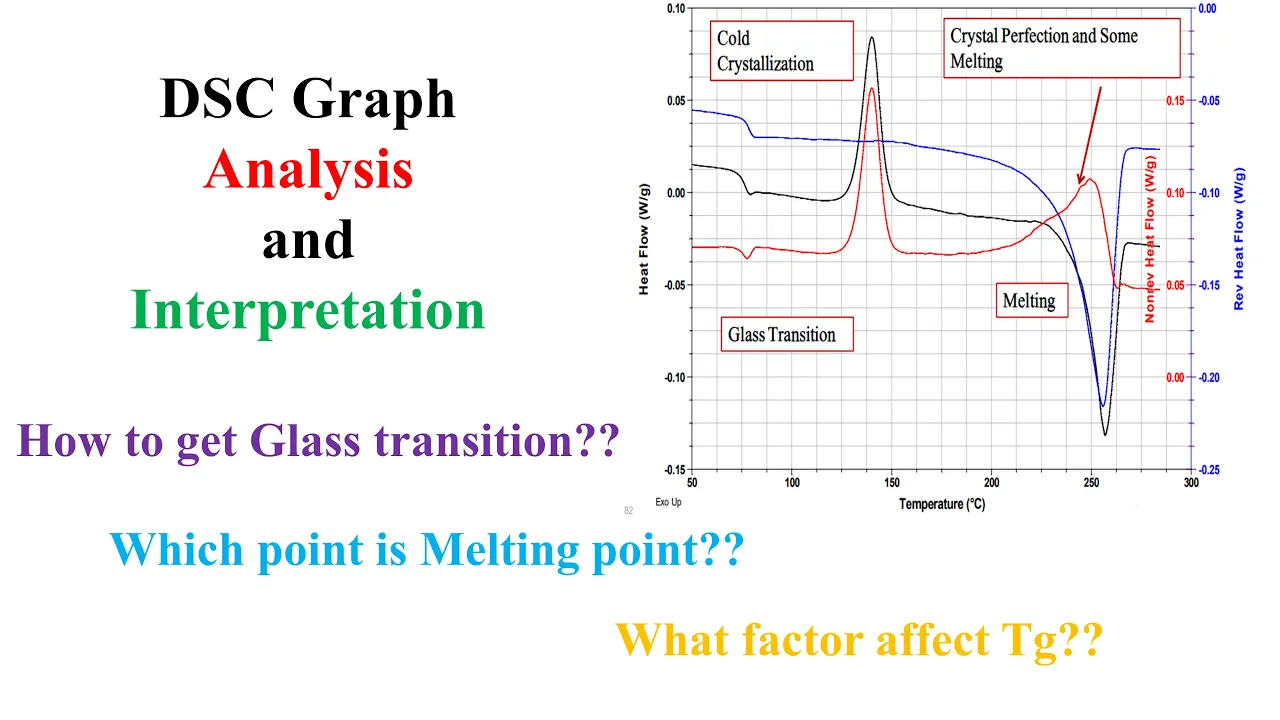
Added:welcome back to the Madison groups YouTube channel in this video we are going back to the basics our series that provides vital information regarding the techniques and knowledge that the Madison group utilizes to solve the many problems that occur within the plastics industry in this video we will be discussing the basics of the test method differential scanning calorimetry or DSC this video is intended to provide you with the pertinent knowledge that is required to understand the results and applications for one of the most important test methods in polymer analysis at the conclusion of this video you will be equipped with the basic concepts of DSC and how to understand what those results are telling you we are the Madison group and we are your polymer experts in this video we will be covering what a DSC is the very basics of the functioning of the equipment we will cover what results to expect from the analysis in order to provide you with an idea of what graphs and data should be provided we will show how the results should be analyzed and the key points you should be looking at from the data finally we will tackle what specific problems can be investigated with this technique and some of the limitations of this particular piece of equipment so what is differential scanning calorimetry DSC is a thermal analytical technique that measures physical and chemical changes within a material in response to temperature the equipment provides qualitative and quantitative information about endothermic and exothermic processes or changes in heat capacity in polymers these processes and changes in a material are important to understand the material properties and are based upon the polymer type molecular weight additives and many other factors this is a differential scanning calorimeter at its most basic a DSC is a system that subjects a small sample to variations in temperature and measures the response of that material the sample is placed into a pan which is then inserted into the cell of the machine the cell is where the test is conducted and the data is collected the DSC exports information on the temperature and heat flow through the sample to remove effects of the internals of the DSC machine the heat flow from an empty reference pan is compared and subtracted from the heat flow from the sample the results is information that tells you how much energy the polymeric sample has absorbed or released and how the sample has changed with respect to temperature this is a typical graph that is outputted from a DSC test of a polymeric material this graph is plotted with temperature on the horizontal axis and heat flow on the vertical axis notice that the heat flow is normalized per unit weight of the sample another important piece of information is the orientation of the curve in this case the graph is XO up which indicates that exothermic processes will result in higher heat flow values and endothermic processes lower heat flow values on the graph we can see two different curves the bottom curve is the first heating cycle on the sample since we are heating the material the curve is read from left to right the first heating cycle analyzes the material as is which will contain the effects of the production of the material any processing steps and the thermal environment to which the material was subjected therefore the first curve is vital during failure analysis efforts to understand if processing or environmental conditions altered the material the top curve is a controlled cooling of the material which is read from right to left the controlled cooling it provides important data on how the material resolidify x' and also erases the thermal history of the material and allows the molecules to reach a near optimal molecular orientation the second heating curve like the first is read from left to right and is typically graphed on its own this cycle provides information on the ideal behavior of the material when subjected to heat for this reason the second heating of the material is better for material identification and comparison purposes you have received results from a DSC analysis how are those results interpreted the analyst utilizes software to calculate important information regarding the thermal transitions produced by the material generally these transitions are separated into two categories transitions that do not return to baseline and transitions that go above or below the baseline and then return to the original plane the important information associated with baseline transitions such as glass transition are the magnitude of the transition and the inflection temperature or where the heat flow changes the fastest exothermic peak transitions can occur in both the heating and cooling cycles as shown here the most important pieces of information to note are the peak temperature and the energy associated with that transition which is measured as the area under the curve endothermic transitions such as melting are similar to the exothermic Peak processes in their analysis for these the temperature of the peak and the area under the curve are the most important this data should be compared across the first and second heats to obtain the most information from the analysis in polymers we are typically evaluating for glass transition temperature melting endothermic transitions recrystallization exothermic transitions and additive evolution the location and magnitude of the transitions in a material are a direct result of the chemistry and properties of the material being analyzed it takes an experienced analyst to take all of the information displayed and provide results that are useful for problem solving one of the primary uses of DSC is material identification in polymers one of the most important characteristics is if the resin is amorphous or semi crystalline this property alone provides a significant insight into the performance of the material for processing and mechanical behavior in a finished part for semi crystalline materials the melting point can be used to identify the family and type of resin say you are provided with seven different materials and are asked to identify those materials DSC testing clearly differentiates between polyethylene with a melting temperature around 130 degrees Celsius and polybutylene terephthalate with a melting temperature of 220 degrees Celsius the same test method can be used to differentiate the glass transition of materials and compare this with known values for polymeric resins this is shown by the differences in glass transition of ABS at approximately 110 degrees Celsius and polycarbonate at 148 degrees Celsius further combinations of these transitions can be used to identify the presence of blends or allies that are commonly used in the industry another use of DSC is to evaluate the condition of a material this is useful for parts that are not performing as expected either aesthetically or from a mechanical physical standpoint analysis of parts that have failed can show differences from reference samples as shown here this is an indication that the failed part has contamination that may have reduced its mechanical properties and made it susceptible to failure DSC can show signs of molecular degradation from processing or the field this manifests as a reduction in the transition temperature associated with the material the results of a DSC test can be used to identify the state of additives that change the properties or the performance of the material this could be plasticizers which have in a great effect on the glass transition or evaluating the can some of antioxidants in the resin in this case one material showed a much higher oxidative stability which indicated loss of antioxidant from processing and /or environmental exposure in some cases the presence of residual stresses will manifest as unexpected transitions in the DSC curved it should be noted that these additional transitions may be difficult to interpret and may require different setups and modes of DSC testing for proper analysis in addition to guarantee proper interpretation the Madison group may suggest confirming the cause with additional test methods DSC analysis can also be used to infer the properties of a molded specimen this can include evaluating for signs of cold crystallization of the material which manifests as a first heating exotherm that is not present in the second heating of the sample additionally comparison of the magnitude of melting from the first and second heats can show signs of an under crystallized polymer these issues can be indications of aggressive processing conditions or extreme temperature exposure other material changes such as physical aging can also be observed with this test method the DSC is a great tool for evaluating the cure of cross-linked materials as shown here cross-linking of a material produces an exothermic transition in DSC testing comparison of the magnitude of these transitions can help to provide the degree of cure for rubber materials reactive adhesives thermosetting materials such as composites or coatings and many other applications the degree of cure will greatly affect the mechanical performance of these types of materials while DSC is a very powerful technique to identify and diagnose issues with polymeric components there are some limitations that should be known first the interpretation is highly dependent on analyst experience this can make interpretation difficult and should be used to not over interpret the data additionally the test method analyzes the bulk properties of the specimen that is no bigger than a grain of rice therefore the sampling region may not be representative of the entire part the machine is highly sensitive to contamination which can lead to abnormal results these results should be verified with other applicable tests for confirmation further this technique has difficulty differentiating between materials with similar transitions for example polyamide 6 and polybutylene terephthalate cannot be easily distinguished with this method due to their similar melting points thank you for watching if you've enjoyed this video please hit the like button to let us know and subscribe so you not miss any of our new content also comment below with any questions or topics you would like to see covered on the channel if you have a specific problem you would like one of our experts to discuss with you please reach out via email at info at Madison group comm or via phone at six zero eight two three one one nine zero seven see you in the next video
Up Next
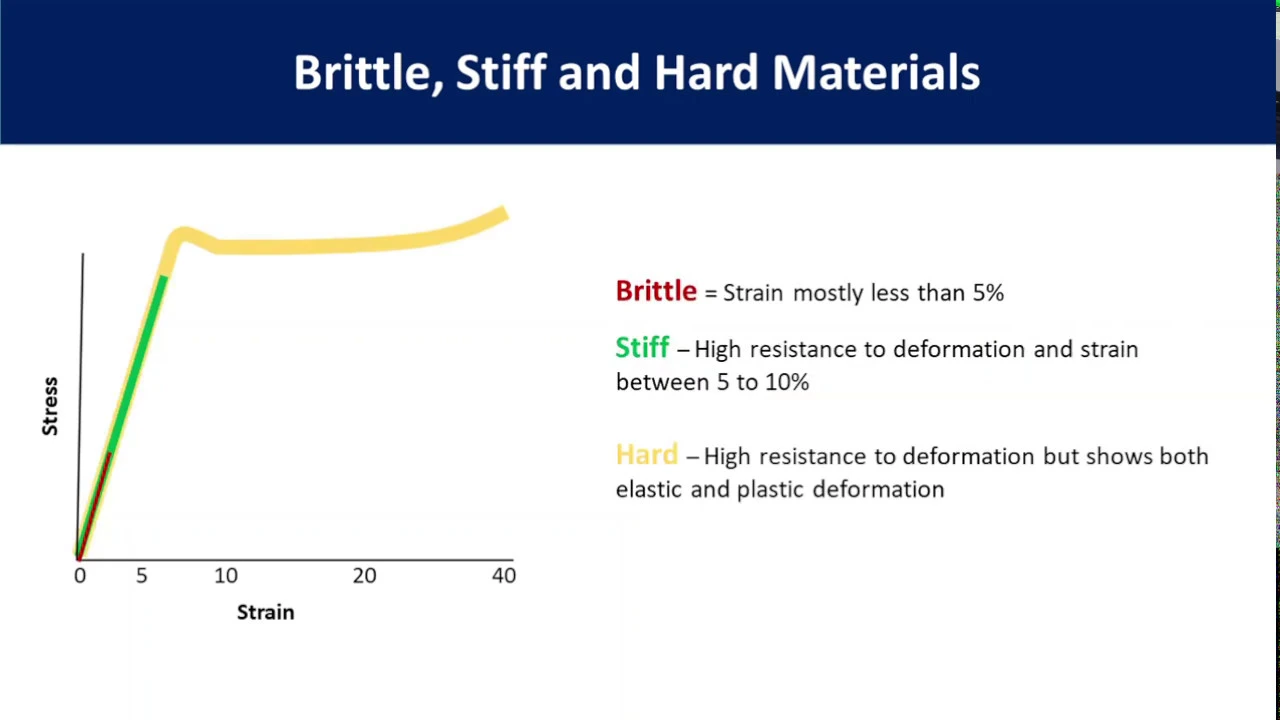
Polymer Stress-Strain Curve: Mechanical Properties Explained
@PolymerWorld
60.2K views•2019-05-15

Ultrasonic Transducers: Resonant Frequency Measurement and Horn Design
@imajeenyus42
229.9K views•2017-02-22

Polymer Environmental Degradation: Mechanisms & Stabilization
@iit
1.8K views•2012-07-10

How a Student's Question Saved a NYC Skyscraper from Collapse
@veritasium
22.8M views•2025-04-26
Related Study Plans & Knowledge Roadmaps
Structured learning paths in Engineering