





















This video teaches students how to develop effective questionnaires for psychological research, covering key concepts including closed-ended versus open-ended items, Likert scale design with attention to central tendency bias and social desirability bias, establishing reliability through test-retest and split-half methods, and validating questionnaires through convergent and discriminant validity using correlation statistics. The instructor emphasizes practical tips such as keeping vocabulary simple, avoiding double-barreled questions, presenting conditional information first, using oppositely worded items to detect response biases, and pre-testing questionnaires before full deployment. Additionally, the video addresses fundamental limitations of self-report measures, explaining why reported behavior may not align with actual behavior, and introduces path analysis for understanding mediation and moderation effects in correlational research.
Questionnaire Development: Research Methods Guide
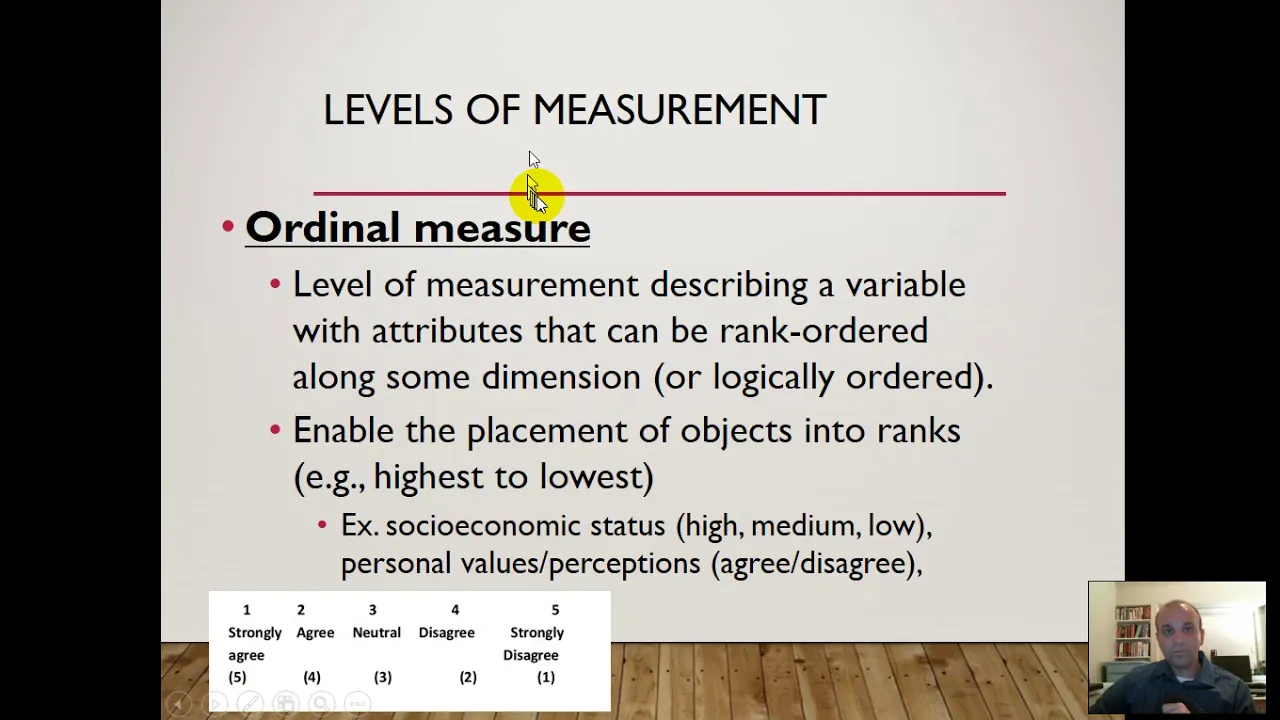
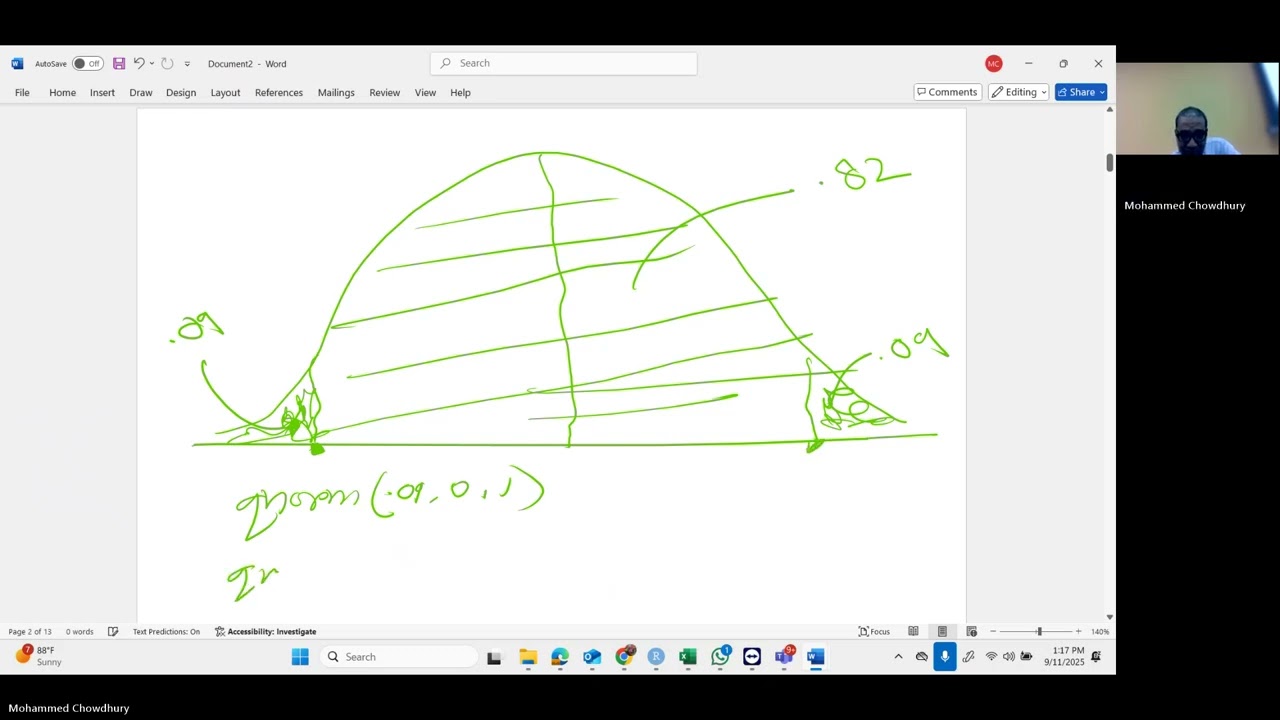
Added:hello and welcome to today's session on developing questionnaires please make sure as always that before we begin you've got the Powerpoint lecture notes printed in front of you so that you can take down notes as we go through the presentation today we'll be talking about developing questionnaire and then we'll also reserve some time in class for having an in-class exercise on developing questioners where we will attempt to work in small groups and apply some of the skills that we learned in today's presentation so let's start by defining what we mean by a questionnaire we can define a questionnaire as a written set of items that are asked of every respondent in the study and we can distinguish between different kinds of items that we might have on our questionnaire one variety is closed Ed in a closed ended item we have a fixed number of possible responses for example we might ask about somebody's experience at Dennison and the particular item might say something like tell us about your experience at Dennison on a scale from 1 through 7even and they would have to say that they very much enjoyed it or very much did not enjoy their experience at Dennis and they would have those seven options maybe numerals 1 through 7 okay that would be a closed ended possibility because there are just fixed response options another one might be something like would you describe your experience at Dennison as relatively positive or relatively negative and they have those two response options relatively positive or relatively negative we can contrast that with an open-ended kind of response where there isn't a fixed number of response options okay a close an open-ended item might be something like tell us about your experiences at Dennis okay and they can go any way they want with that now an important point to consider is that if you give them an open-ended item it might be the case that they will ramble for a bit and in that rambling there might be some really rich information or there might not be so you'd have to come up with some kind of scheme for pulling out the themes maybe from the highly quality of responses that you get from open-ended respon open-ended items nevertheless those can be a terrific source of information uh when you're conducting some kind of survey research okay we can also remind ourselves that these questionnaires might differ along a a separate Dimension and they might differ with respect to whether they are self- administered or whether they are interviewer administered so it might be the case that we have a paper and pencil questionnaire and people can complete these on their own we can take that paper and pencil questionnaire and convert it into something electronically and deliver it through the web deliver it through Twitter uh deliver it through email or what have you by contrast we can have an in-person interview uh and we're administering the the questionnaire that way it might be the case that we're doing this uh live and in person you can even think of this as being done over the phone or maybe by Skype something along these lines so we can either have interviewer administered self- administered and then any given item can be either closed ended or open-ended and we might think about uh what the pros and cons of each of those would be before we engage in our questionnaire research okay let's talk a little bit about some other possible challenges that people encounter when they're doing questionnaire based research caution is needed to achieve accuracy and precision when defining variables so sometimes you and your research collaborators will have a very precise idea about what you mean by a construct like race or ethnicity but in our everyday lives we frequently conflate those two and we might use uh terms like Hispanic and Latino interchangeably I know that I myself will occasionally use those terms interchangeably even though I've been trained to realize that many researchers make an Extinction so it might be the case that you would Define Hispanic as a Spanish-speaking ethnic group and here this would be an ethnicity by contrast we might say that Latino refers to people originating from North or South America outside of the US or Canada and we would typically think of this as a racial designation not an ethnic designation now we can say that a person having European Spanish Heritage is Hispanic and that's because that person would be Spanish speaking but Caucasian not Latino because Spain would be part of Europe okay so uh we might want to get very precise in issues that seem very very straightforward uh variables like race and ethnicity sometimes you really do want to make a distinction and you need to somehow communicate very clearly to your respondent uh what those possibilities are if in fact you want to push this distinction between ethnicity and race okay let's move on to other factors that we typically consider on questionnaires it is often the case that we use a lyer scale and we're going to talk a little bit about some of the um different ways that you might Implement a lyer scale this was originally developed by rensis Laker who I consider to be one of my homeboy of sorts because he was educated at Columbia University long before I was Columbia is one of my own Alma mothers and he went on to found the University of Michigan's Institute for social research which is a world-renowned Institute for social research and he was its director from 1946 to 197 70 he gave us the scale that you might know that ranges from say 1 to 7 or 1 to 5 and usually those numbers correspond to a Continuum that might stretch from something like we strongly agree with the item to we strongly disagree and varying Shades of Gray so to speak in between one of the things we might want to be very aware of whenever we're using any kind of ler scale would be a central tendency bias so we can Define this as respondents May avoid the extreme response categories or the the case in which respondents are avoiding the extreme categories so frequently if you give people a seven-point scale many of them will tend toward the center just because they don't want to offer extreme scores when we're the next and a difficulty here is that people might have a slight inclination to lean one way or another but they are maybe disinclined to express that they have a bias toward the center so there might be a slight polarization of the responses truly but when they go to actually fill out your question here they give you a neutral response a a a bias toward the center of the scale so to ensure participants demonstrate polarity that is to ensure that they're leaning one way or the next uh we can remove the neutral response option from the center of the scale so we can now basically force them into responding at least slightly this way or that way of Center by removing the neutrality option that otherwise would have been in the center so an even number of response categories can force polarity as we say and when we're talking about polarity we're talking about um having different balances something more positive versus something more negative okay so on the other hand if we choose to allow some neutral option you might want to leave that as a possibility then you can have an odd number of items on your lyer scale and the central most item there would of course be the neutral item so you need to think about that in Advance do you really want to push the respondent toward showing at least some kind of inclination positively or negatively or do you really want to give them the option of expressing neutrality there isn't a correct or incorrect answer to that choice but you as a informed developer of questionnaires should think that through and make a decision about whether you want to force them uh one way or the next or whether you want to give them a uh possibility for neutrality so the central tendency bias is one kind of bias there's another kind of bias that we might talk about and that's the social desirability bias respondents May portray themselves or their group in a favorable way this is the social desirability bias and there's some interesting anecdotes here that I'll try to summarize briefly when I was in Graduate School uh some of the folks I worked with included yakam Krueger and Russell Clement and they did some really interesting work experimentally manipulating in-group and outgroup differences and here's how they went about doing that really quite clever they had people come in and work on a small computer answering some questions that were very much like the questions that we're talking about now in a questionnaire and these were some simple demographic information questions they were questions about personality and after a few of these questions the computer would assign a phony designation to these folks as either being Grinders or grounders Grinders and grounders are totally fictitious groups they don't really exist and the computer would tell the participant that based on their responses they are either Grinders or grounders and what's interesting about that is of course this is a bogus set of questions up front the computer is randomly assigning you to these bogus groups okay now what happens is as the computer proceeds in the questionnaire students are asked questions about how socially desirable their group is and let's pretend that you're in this study and you had been assigned to the Grinders you would give yourself and the Grinders comparatively high favorability ratings and you would give much lower ratings to the grounders those are the outgroup members even though this group was entirely bogus which is absolutely fascinating what I thought was even more fascinating was in some of these trials they would have the computer engage in another kind of manipulation the computer about half the way through would ring and say oops based on your more recent responses we think we had misassigned you originally we thought you were a grinder now we think based on your responses that you're a grounder of course this is all bogus but that's what the computer told the respondent and now the respondent proceeds through the remaining half of the questionnaire assuming that he or she is now a grounder and not a grinder and lo and behold what you see is the social desirability effect now is being applied to the grounders and not to the Grinders the grounders are achieving the higher level social desirability the grinder is the lower level and this is a complete reversal from what we had earlier so the point about all this is that social desirability effects can be very powerful they can be really quite arbitrary but as soon as we believe ourselves to be inside of one group social desirability tends to go up for that group really interesting experimental manipulation a related effect is something called the outgroup homogeneity effect and that is that most people tend to see members of social outgroups that is out groups that are uh people who are in groups very dissimilar from their own groups they see those outg group members as being very similar to each other oh they're all the same would be a characterization that we might offer uh to help us understand the homogeneity effect the outgroup homogeneity effect by contrast when we think when we're asked to reflect on each of our own ingroup members we tend to perhaps overestimate the amount of heterogeneity we have we see ourselves as largely individuals with our own personalities our own distinct traits and idiosyncrasies and we're less inclined to afford that same consideration to out group members okay so we have a couple of different interesting effects related to social cognition okay let's see if we can now move on to some other issues in developing questionnaires including issues relating to reliability in Prior lectures we've talked about how reliability can be thought of as repeatability we want our measures to be repeatable we talked about the importance of replication in science in general and the ability to replicate the findings that we have in any one study so this is the issue then really of reliability and what we might do when we're developing our questionnaires is ask about the reliability of the questioners that we've developed and how would we go about establishing that empirically how would we convince a skeptical not cynical but a skeptical reviewer that our instrument our questionnaire really did have reliability well one of the methods that we're going to be talking about and there will be two that are are fairly similar to each other the first of these is called the test retest method the same questionnaire is administered to the same large sample at two separate times time one would be the test time two would be the retest reliability is indexed by the extent to which relative rankings of respondents remain stable from time one to time to that is across the test and the retest note the overall scores on the second administration of the test may be higher or lower than the first the critical factor is the relative rankings okay and we'll draw a diagram that might help to clarify that in just a moment we might ask ourselves What statistic could we use to empirically validate excuse me empirically establish that our instrument has test retest reliability it might occur to you that based on the fact that we've just finished some conversation about correlations that the statistic we're looking for here would be the r statistic so what I'll do in just a moment is I'll draw a diagram on the board that shows how we might have a scatter plot and an our statistic to help us establish reliability via the test retest method before I do that though I thought I'd just introduce a near cousin to the test retest method I mentioned that we'd have these two methods and here's the second of the two it works in a qualitatively similar way uh slightly different in the details the alternative would be something called the split half method rather than the test retest method and the split half method we'll assume that we want to measure depression and you have a 100 item questionnaire on that topic the 100 items can be split in half and we can do first half versus second half we can do odd numbers versus even numbers any way that you want to divide that is fine and the two halves could be separately scored for each respondent okay so we're getting now two measures on each respondent just like we did in the test retest method but now these are being taken all at one time and if we have a sufficiently long questionnaire this would work we could divide odd versus even or we can divide first half versus second half within the questionnaire and if the test were reliable people who score high on one half should score high on the other half okay so hopefully now you have some idea about how you would establish reliability in a persuasive and quantitative way and we'll go back and look at test retest and the split half method when we're dealing with reliability so let me close out of this and we'll see if we can draw this on the board we can use any number of traits that we might want to measure any number of variables that we might want to measure so let's see if we can get a scatter plot going and in the example we used a moment ago we talked about a depression questioner we've talked about depression a lot why don't we go with some other example just to give us a little bit of topical variety why don't we talk about something like a personality trait such as introversion so we'll call this our introversion measure and we'll assume that you and I are personality psychologists and we're very interested in this topic of introversion and we want to develop a questionnaire that we think assess as introversion versus say extraversion and we we have lots of different items maybe we have 10 items or maybe we have 100 items we can talk about the test retest method and what we would do is give the introversion scale to somebody at time one maybe the beginning of a semester and then later on that semester we give it again and we would imagine that if personality traits are relatively stable over time and if we have reliability which is really the issue that we're testing here then we should get pretty similar scores for a given individual at time one at time two so let's call this time one let's call this time two and what we can say is that we have for any given respondent a score we'll pretend here that maybe we're working on a scale that goes from zero to 10 our first respondent gets a relatively low interverse score time one we'll call that a one that they're very low on introversion and then maybe they're low again the second time they're down at around three uh our next participant might have relatively high scores maybe something like 9 and 10 so that would be a very introverted person somebody else has relatively intermediate scores maybe six and five I think you get the idea so what we can do is construct a scatter plot based on these observations so if we take the one and the three at time one and time two that's going to be something like here is okay 9 and 10 is going to be way up in this corner 5 and six is going to be a little bit more intermediate and you can imagine that we can fill in more and more of these and if we fit the best fitting line or the best fitting Trend it might be something like that so you would see then that the R value would be relevantly greater than zero it probably wouldn't go all the way to one but let's just say that we had an R equaling 8 if that were the case then we'd have some evidence suggesting that we had reliability that is from time one to time two we were getting largely the same kinds of scores okay so this would be one of the ways of establishing test retest reliability taking advantage of the r statistic it's intriguing that we had used the r statistic earlier to find the relationship between two variables now we can use the r statistic to establish the reliability of an instrument that you and I have constructed so we can empirically demonstrate to to a uh to a critical reviewer that we do have a test here that's measuring uh reliably some kind of construct in this case it's the construct of iners and we can offer a quantity like an R of point8 in fact we get that kind of an R so we can use the same sort of a questionnaire but what we might do is administer it just at one time and if we had lots and lots of items we might say that we can look at the odd numbered items and these become odd number and this is even number and we'd fit the respective points we'd find the best fitting line we'd compute the r statistic associated with that again that might be a Spearman R had these been rank orders it might be something like a Pearson R if these have been on scale variables which we know from SPSS would be something like a ratio scale or an interval scale right and whether we whether we're plotting the even or the odd uh we would still see um the function that's fitting there as being significantly greater than zero hopefully that would be the case and now we'd be using the split half method and we would establish reliability that way so that's one of the ways that we can take advantage of the r statistic to show that we have reliability okay let's now go back into our PowerPoint and move on to our next issue and as you might imagine as we've talked about before reliability and validity are important issues so let's see if we can now develop the validity of a questionnaire and this is a bit trickier usually um there's a little bit more room for argumentation on validity issues than there would be on reliability issues you'll see though that there's also an important similarity in terms of using the r statistic to establish validity so we might ask ourselves to think back to the history of psychology and ask about the early development of the IQ tests which were established originally by Benet and remind ourselves about what Benet was grappling with in the early part of the 20th century Bay was very interested in helping children who were struggling a bit in school and he thought that he could develop a questionnaire as we'll call it today it was really an IQ test he hoped that his questionnaire SL IQ test would help identify children who might be at risk for doing poorly in school and that's really a very Noble goal he probably would not have envisioned at the time that about a 100 years later IQ tests and their near cousins would be used to stratify Society into who goes to college and who doesn't who gets into very elite colleges and who doesn't his initial motivation was simply to identify kids who might be at risk and to help those kids it's hard to imagine something more noble than that okay so how did he think about the validity of his then new IQ test his questionnaire so to speak well he reasoned this way that he might get something that we can temporarily call Convergent validity okay independent measures of a given construct are correlated okay they independently Converge on whatever it is they are measuring so we can talk about measuring something like intelligence is what an IQ test at least allegedly measures and that would be our construct and we can look for different measures of intelligence and see if they converge and as you'll see in a moment we'll take it advantage of the r statistic uh to measure that convergence so here's a subtle point we can use correlations to inform us about validity not just about reliability so Benet he's trying to look at the construct of intelligence he's developing this IQ test he's trying to figure out does his new instrument his questionnaire IQ test have validity so the way he begins to reason about this is he says well if I were to get a rating from the various School teachers about who in their class classroom learns really really quickly and who learns less quickly and maybe have the the teachers rank order their students in terms of who learns the most quickly and who learns the most slowly if my test is measuring what I think it's measuring and that's the issue of validity then we should have a nice convergence between my test and the teacher's rankings okay so we would get convergent validity okay let's see if we can draw a picture of that I'll go out of here one more time okay so we're been a and back 100 years or so and we're trying to establish the validity of our new questionnaire which is really going to take the form of an IQ test eventually so we'll get the scatter plot going and he's looking for his IQ test that's what I'll call it here to somehow converge with uh teachers ratings of who learns quickly and who's learning more slowly so we'll have teacher ratings over here on the x-axis okay and we'll say that this is the quick end and this is the slower end okay so a particular teacher gives a particular student who's maybe the fastest student in the class uh a very high rating for quickly that student learns and then it might be the case if if B is lucky that that corresponds with a relatively high IQ it might be the case that uh teachers ratings that are um corresponding to the more slower learning students are going to be down here and maybe the IQ scores are going to be down here too and we might fill in some hypothetical points you would imagine that this is not going to be a perfect fit to the best fitting line but we might get a trend like that we might fit an R again this r might be I don't know what it would be I'll say 7 something greater than zero but not all the way to one and to the extent that we get a strong r value here we could say that we have convergent validity again the notion that this measure of the construct of intelligence is converging with or corroborating this measure of that same construct called intelligence and then he could do this a few different ways we could say independent of what the teacher's ratings are about who's learning quickly and who's learning slowly we can go to last year's grades and we can say well which of the kids scored the highest GPA last year okay and now we could run a correlation with that and that might again turn out to be something that's significantly greater than zero it might be though of course that we get a trend that really is much more circular maybe there's no correspondence between IQ and GPA and we get more of a circular cloud of dots that has a best fitting line with a slope closer to zero and here the r value would be either exactly zero or nearly so okay this would be evidence against convergent validity and that would be a problem for our instrument but that's something we' want to know we really do want to know scientifically whether we have converion validity or not and we can take advantage of the r statistic to show us that okay let's go back into PowerPoint and move on to the next concept the next concept is probably one of the most subtle of the entire semester so we're going to go through this one and then we'll take just a little break after this so we can make sure that we haven't overwhelmed you we're still on the topic of validity but now we're going to introduce a new variety of validity and this is called discriminant validity so we're hoping to establish both convergent and discriminant validity let's define discriminate validity this way the ability of a questionnaire designed to measure one concept to yield answers that are not correlated with those of another question ER that measures a similar but different concept that's a very long definition it's a very very long definition uh and sometimes students find that confusing but also a example will typically help us to see that a little bit more clearly we'll look at discriminate validity in terms of uh a construct called life satisfaction versus a similar but distinct construct called called positive affect and you might want to check this out if you want to cut and paste this into your browser there's a very interesting PubMed abstract here so in this particular case let's pretend that we're trying to develop a questionnaire that's looking at this construct called life satisfaction we would hope on the one hand that we could use test retest methods to establish the reliability not validity but the reliability of that or we might use a split Hef method to establish the reliability of our life's satisfaction questionnaire then we might go on as we did just a moment ago and try to establish something about validity we might look at the convergent validity and we would see for example uh if life satisfaction converges our measure of Life satisfaction converges with other measures of Life satisfaction maybe there's uh already existing questionnaires that have been validated and we want to make sure that our measure is converging with their measure that would give us convergence validity but now we have this new idea of discriminant validity how do we get there how do we establish discriminant validity uh for our life satisfaction questionnaire what we're going to do is introduce a construct that is similar but still distinct from Life satisfaction and that construct is positive affect so you might think that life satisfaction is similar to positive AFF but it's not exactly the same thing you can imagine somebody for example who doesn't have a lot of positive AFF effect imagine that there's a relatively nasty workaholic this is a person who grumbles a lot not a very happy person not a lot of positive affect yet this person still might self-report that they derive a lot of satisfaction from their work and that they they believe it to be very satisfying okay their accomplishments very satisfying they like to win they like to achieve but they're not particularly happy souls okay so these are in fact distinct Concepts on the one hand you can be satisfied and happy you could be satisfied and grumpy uh generally speaking I would guess that life satisfaction tends to coar with this but we want to make sure that we will have a distinction between those two similar constructs how would we do it we would use discriminant validity and here's how we would uh plot this we're going to go to the r statistic one more time okay um and we'll see how we do that on the board put this back up we'll leave our scatter plot outline okay and we'll now do something like this we'll look for Life satisfaction we're getting some kind of responses from our question here and we might take some other known and reliable measure of the similar but distinct construct something like positive affect which I'll abbreviate here as PA or positive aect and we're hoping now that our questionnaire is distinct from that questionnaire so what we would like to see ideally is that we in a perfect world we'd be able to get a cloud of dots such that no matter what the scores were on our life satisfaction questionnaire there was no reliable correspondence with the Positive affect questionnaire we would hope to have an r equal Z here to say that we're clearly discriminating we're measuring something that is not related to positive aect and this r equal Z would be very strong evidence that these responses are not related to those more realistically it's probably not going to be r equal Z if these are similar constructs but distinct constructs you're probably going to have some number that's slightly greater than zero but not a very strong relationship you might expect maybe something that looks a little bit more like this a slight upward Trend in all of this noise right you might notice that that would be slightly greater than zero and maybe this is going to be I'll make up a number3 so to the extent that we get lsh R values here then we have discriminated between these two similar but distinct constructs and we're using the R value one more time to tell us about at least one type of validity we might call this discriminant validity and we're contrasting that with convergent validity okay all right so why don't we draw line there just for the moment we'll come back but we'll see if you have questions that you've jotted down and especially it would be interesting if you could generate your own kinds of questionnaire topic your own construct and see how you might establish convergent validity for that construct and discriminate validity we'll give you a moment to do that and we'll come back and see how you've done okay welcome back what we're going to do now is proceed with some other ideas relating to developing questionnaires and we'll offer you some tips for good questionnaire items so what we might start out with is keeping the vocabulary simple many of you who are tuned into this are college students and you would probably not be aware of the fact that your vocabulary is likely to be much greater than those of typical folks uh from around the country who have not had the benefit of the educational experiences that you've had it might be the case that because you're immersed in an environment where you're learning new vocabulary all the time and perhaps you're really good at learning new vocabulary um you might be a little bit different from a much broader population that might not have the same vocabulary that you have it might also be that uh you are learning in a language that is your native language and other folks from around the world uh will be having for example English as their second language and understandably their their vocabulary would be smaller than yours just as my vocabulary in my non-native tongue would be much smaller than that for my native tongue so we want might want to keep the vocabulary very simple so that we can be as inclusive as possible in our questionnaire the item should be clear and specific no leading loaded or double barreled items so let's see if we can give you an example of a double barreled item and why that would be problematic one particular double barrel item might be something like this in the last 6 weeks have you experienced sleeplessness or anxiety okay sleeplessness or anxiety those are actually two different ideas and let's say that somebody says yes to that well that could mean that they experienced sleeplessness or that they experienced anxiety or that they experienced both and it might very much be the case that you and I will need to distinguish between whether sleeplessness is predicting or whether anxiety is predicting and yet if we put those two as a double barreled item onto one particular question in our questionnaire then we' have no way of disambiguating those and we don't really know what's driving uh the effect that we might want to see so it would be better to separate those out and have one item on sleeplessness and one item on anxiety we don't want to put those together or we'll never be able to disentangle them once we come to the data analysis phase it's best if we keep items brief less than 20 words that also tends to increase the clarity okay couple of other tips for good questionaires present all conditional information prior to the key idea you might recall from earlier sessions that when we're talking about conditionals we're making at least an implicit reference to the word if okay so if this then that the if component is going to be our conditional component okay so let's see if we can give you an example of a proper way to construct this and a less desirable way to construct this so remember present all conditional information prior to the key idea if money were not an issue what would you study in college so here's the conditional information if money were not an issue comma what would you study in college that's really what we want to know what would you study in college and we're trying to prompt them for an answer about what they would study in college so we put the conditional information first here's where we could get ourselves into trouble here's an example that's not as good what would you study in college month if money were not an issue frequently respondents will pick up on the most recent information if money were not an issue and they might begin to go into all kinds of possibilities like oh if money were not an issue I would buy a boat I would buy a yacht I would buy a mansion I would take this strip we don't really want to know what they would do with money in general we want to know specifically what would they study in college we could wind up distracting our respondent if we put the conditional information last so people who run questionnaires on a regular basis have come to the conclusion it's best that if you do have conditional information then you should make that before the primary idea okay we also want to see if we can detect response biases by using oppositely worded items so we've mentioned before that we have different kinds of biases on our uh people typically have different kinds of biases when they're responding to questionnaires they might have a central tendency bias they might have a social desirability bias sometimes people are just inclined to make their way in and out of a survey situation as quickly as possible and they want to receive credit for example from a psych 100 class or an introduction to psychology class just by going in filling out the questionnaire and getting out and what they might do is just circle fives all the way down on a fivepoint scale or they will Circle ones all the way down just to get out of it okay so how do you guard against that how do you know whether somebody's giving you a bunch of fives because five really is their best opinion or best represents their opinion or whether they're just going through in a very Superfluous Manner and trying to get out quickly well one of the ways to detect that kind of uh responding is to use oppositely worded questions so for example you might want to know something about emotions and you might want to have a questionnaire an item excuse me that says something like I often feel anxious okay and it might be something like strongly disagree to strongly agree so we're going from disagree to agree here and so a five would mean that we strongly agree with a statement I often feel anxious at some later point in the questionnaire we might have a separate item that has opposite wording but the same kind of a scale so we might now say I rarely feel anxious okay if they give you a five here and a five here that would suggest that they're responding superfluously that they're just giving you very superficial kinds of responses and they're circling fives maybe all the time because it would seem incoherent to say that I often feel anxious I and I often I rarely feel anxious those are contradictory statements hopefully we would get people who would respond at opposite extremes here and that would be an indication that they really are reading the item they understand what it means and they're responding coherently it's difficult to detect that um for sure but by using oppositely worded items words that are antonyms for example we can begin to gain some insight as to the truthfulness of the respondent's responses okay we also want a test for readability we want to make sure that uh things that you and your research Partners believe to be clear really are clear to those who are taking uh the test and so this brings us to our our mantra for today and that is pre-testing is critical can you say it with me here we go pre-testing is critical so after you developed your questionnaires and you thought about keeping things brief less than 20 words no double barreled questions all conditional information is coming first we have some oppositely worded items so that we can get rid of uh these um bogus responses that some people would give us we want to make sure that we have a nice and readable question here and so we might run it on a sample of folks before we put it out uh to a much larger group so that we make most efficient use of our time okay something else we should say is that the order of the questions matters very much and this is sometimes something that's difficult to know in advance but it is something that we might think about if you're running running a computer-based experiment one of the nice things is computers will sometimes allow you to randomize the order of the questions so that you don't get any systematic sequencing effects or order effects okay so um here's an example that you might find really interesting this is a famous example by Schuman presser and lwig from 1981 and it goes like this they were asking questions about abortion related issues and one of their questions was do you think it should be possible for a pregnant woman to OB a legal abortion if she is married and does not want more children okay that would be the question that was posed to the respondents and what was very interesting was 60.7% agreed with this statement when this question preceded another question on abortion okay by contrast when they reversed the order and they had this other question on abortion preceding this question which was worded exactly as it is here that number dropped to 48.1% agreeing when it followed that other item okay so just by changing the sequence we got different response rates and the only point about this for our purposes is that the sequence does matter so you might want to think very carefully about how to order your questions and if you are doing this by way of computer you might realize that there can be some benefit in randomizing the order that wouldn't necessarily mean that the order effects goes away for any given individual but it would go away for your sample that is some of the students would be receiving this question this kind of question first others would be receiving it second and that might be the fairest way to uh sequence your questions okay here's another issue that you might remember reading about and this is the issue of filter questions okay so what are filter questions and what is their value we'll give you a moment to um stop the video and respond to that okay welcome back why don't we go on and we'll now address some issues relating to the interpretation of the information that we get out of our questionnaire right this issue is very important reported versus actual Behavior it's not as congruent as we might like as we said when we began our conversation about survey research methods there is an ongoing question about the extent to which surveys and self-reports really do reflect the extent to which people would behave okay now of course surveys have other benefits too surveys tell us about attitudes and attitudes are a very important part of psychology but there's a question about um self-report and actual behavior that is a legitimate question um here's something that I think you might find especially interesting people self-report that they would help someone in need regardless of bystanders behaviorally though you and I might recall from intro to psych the bystander effect replicates very reliably and this is something that had been shown quite famously by lant and darly in 1970 uh we can ask folks if they would help somebody who is in need uh and they would say yes and then we can say well Suppose there was a bystander um would you still help and they would say yes Suppose there were two or three or four bystanders they still say yes but when you actually run experiments where you have a bystander and maybe increasing numbers of bystander bystanders the probability of having a given person help out actually goes down and this is a very reliable and very repeatable kind of effect so what people are saying and what they're doing tend to be less congruent than you and I might like so it's something to think about okay so what this suggests is that we might want to use a multi method approach we might want to get some survey data but we might also want to look at actual behavior and some combination of these varied methods might give us the best insight into the construct of the phenomena that we choose to investigate okay let's see if we can go on now and understand a little bit more about the interpretation problems associated with really any kind of research but in our particular case we're talking about questionnaires okay so how do we interpret the correlations that we might find um we know from intro toy that correlation does not imply causation we we know that to be true we might ask why correlation does not imply causation and there are at least two broad categories that we can think about one issue is this the spous correlation third variables okay another issue that we'll come back to in a moment is that the direction of causation is often ambiguous okay let's take this first one that brings us back to one of the founding mantras of intro tosy and that is that correlation does not imply causation so this is said because of the quote unquote third variable problem let's see if we can uh give you an example about third variables I'll use something that's really quite uh straightforward and I think quite obvious you might know that there is an association between the number of murderers in a city and the number of traffic lights in that city as the number of traffic lights goes up the number of murders in that City also tends to go up okay it would be though very unlikely that the number of traffic lights is causing the number of murders right it's probably not the case there might be some third variable and we can ask ourselves well what is that third variable or what might it be and as you might guess a plausible third Val third variable in this case would be something like the population size if we think of a very small town like the small town of Granville Ohio where Dennis University is we can say that we have a relatively small population and because have a small population we don't have that many traffic lights and because we have a small population we don't have that many murders when we count the number of murders in a given year or a given 10-year period if we contrast that with a much larger City like New York City where there might be several million people living it's not surprising that because we have several million people living in New York City we have many many more traffic lights in New York than we would in Granville and correspondingly we have many more murders even if the murder rate were identical we're taking that percentage off of two very different base populations so clearly the size of the city in terms of its population is a third variable that might be explaining the relationship between the number of murders and the number of traffic lights this is a third variable example and this is one of the reasons why we'd say that the correlation between the number of traffic lights and the number of murders is maybe a spous correlation it might be measurable we might get a strong R value but it doesn't mean that there's a causal relation ship between those two okay let's go on to another possibility that we should consider and that is that sometimes for some correlations even though they might be very strong the direction of causation might be ambiguous and we've considered one of these examples before in our video series let's give you a different example and one that's very relevant to something that a lot of students are interested in a lot of students have an interest in Clinical Psychology issues and many of us have an interest in the autistic Spectrum so what we can say about that is that it was thought early on maybe a few decades back that we didn't really know what kinds of factors put a child onto the autistic spectrum and there was some consideration that it might be the case that children land on the autistic Spectrum perhaps because of the way the parents are acting toward the child for example it might be the case that parents tended to make less eye contact with their children who are on the autistic Spectrum than they did with their children who were not on the autistic Spectrum the more typically developing child okay so maybe parental eye contact was one of these factors okay now here we can do a series of studies and we might be able to show that there is in fact a strong correlation between parental eye contact how frequently that's happening with a child on the autistic Spectrum versus children who are not on the autistic Spectrum there might be an association between those variables but the direction of causation might be ambiguous on the one hand it's possible that a lack of eye contact is causing a child to be on the autistic Spectrum okay at least back several decades ago that was one possibility that people were thinking about of course the reverse is also possible it might be the case that because the child is on the autistic Spectrum there's something about those symptoms that makes the child perhaps less engaging to the parent and so it's the child's autistic symptoms that are driving relatively low parental eye contact okay so the direction of causation is ambiguous just to be absolutely clear now no contemporary researcher believes that there's a causal relationship between those two nobody is suggesting that children are on the autistic spectrum because parents are failing to make eye contact but that was something that people considered many decades back in psychology's earlier history again it's a nice example of having an ambiguous uh cause of direction of causation okay so given that we have these potential third variables we might say is there any way to unpack that to dis uate the third variables and um some um method that we have for doing that is called the path analysis okay so this will help us look at some potential causes in a very systematic way and we're going to one more time take advantage of the r statistic the correlational statistics that we had developed in previous videos Okay so let's take a look at the path analysis a statistical technique that can help clarify the interpretation of correlations particularly with respect to these third variable possibilities and we're going to introduce two terms one of which we'll really focus on today called the mediator and one of which we will Define today and come back to later on in the semester when we're understanding factorial designs uh and something called an interaction effect the mediator is defined this way a variable that is used to explain the correlation between two variables okay and we can define a moderator as a variable that affects the strength Andor direction of the correlation between two variables and again this will be pertaining to something called an interaction effect that we will get to later in the when we're talking about factorial designs let's see if we can jump in and understand by way of picture how the mediator might look let's say that you and I are really interested in this independent variable which we call a predictor typically plotted on our a x- axis on a scatter plot and we're interested in how that relates to our dependent variable or Criterion which is plotted on the y- Axis or our ordinate and we're showing that maybe we have a strong relationship there we could actually take a Pearson or a Spearman R and we can um find what that relationship is we can then introduce a potential third variable which we have up here we'll call that generically our mediator and we'll look at the relationship between the IV and that variable and we'll get a Pearson or Spearman correlation going on there and finally we'll get one more pairwise correlation between the mediator and our outcome variable or our Criterion variable so we'll have now three R values that are going to be helping us in this path analysis this is very generic let's see if we can take two different examples is to help drive this point home let's say that you and I are interested in the relationship between SAT scores and college gpa academic performance in college you can imagine that every College's admissions office is very interested in this relationship we want to bring students on campus who we think will succeed it would be unfair to the student to bring them on campus if we have some reason to believe that they couldn't succeed here we want our students to be successful so we're really interested in this okay and we're wondering is sat a good predictor of this and we can use our value to tell us something about that correlation we get an R value here then somebody might say well you know it's not really SAT score it's this other third variable which is socioeconomic status so we can find a relationship here by correlating the two maybe with a Pearson statistic we can find a Pearson statistic the r one more time between sces and um college gpa okay and we can see if this relationship holds after controlling or factoring out the sces see if we can do another example exle that we might have let's say that we're looking at psychological distress as our psychological variable of interest and we're wondering to what extent that co-varies with poverty maybe even caused by poverty so we can get some kind of index of poverty some index of psychological distress and we can correlate that we can get correlations between poverty and some operationalization of chaos we'll get that correlation and then we'll take U the chaos operationalization and we'll correlate that with Cy olical distress and now once again we have a trio of our values okay okay so assume that poverty our predictor correlate significantly with psychological distress there is a correlation along our bottom row in that big triangle that we were just looking at we'll say that's a significant correlation down here is that correlation mediated or explained by chaos this is what we might ask yes if the data pass this so-called mediational test it's an interesting test predictor and mediator are significant correlated right so that's going to be the variable over here and the variable up here in our preceding diagram Criterion and mediator are significantly correlated okay so the mediator is up here our Criterion is over on this side okay and the predictor and Criterion correlation is significantly reduced after controlling for the mediator so if we pull out this effect then we can say that if we have this go all the way down to zero as our R value or nearly so then this variable up here are third variable might have been mediating that relationship okay okay so let's see if we can draw that on the board just to make sure it's really clear and we'll give it to you in a slightly different format we'll give it to you by way of Ven diagram lots of students find ven diagrams to be intuitive so what we can say is that we're interested in psychological distress as psychologists that's what we're trying to predict we initially think about poverty as a strong predictor and we have a r value that's showing the relationship between those two then we think well maybe it's not really poverty maybe poverty tends to be associated with a certain amount of environmental chaos of environmental Disorder so can we somehow operationalize chaos get a measure of it and see how it lands on this vend diagram and might be very hypothetically that chaos would have some overlap that looks something like this okay I'll put chaos over here what's interesting is then there's a lot of overlap across all three of these and what remains after having removed statist by path analysis the effect of chaos we only have a smaller amount which I'll draw in green of overlap between poverty and psychological distress and that might even be a non-significant amount of overlap a non-significant correlation so if we factor out the overlap attributable to chaos and we significantly reduce this relationship you might then say that chaos was significantly mediating the relationship between these two variables and sometimes researchers go as far as saying that chaos was explaining the relationship between those two variables okay so that's a lot but then survey research is very complicated what I hope you'll do now is reflect on what we've talked about so far make a note of what was clear and what was not so clear and bring that information into class see you in class
Up Next
Jordan Peterson: The Science Behind Self-Esteem (Does It Exist?)
@thebests101
2.2M views•2018-10-14

Cognitive Skills for Differentiated Instruction | Teacher PD
@BrainWareLearning
631 views•2017-12-17

Thinking, Fast and Slow: Daniel Kahneman Animated Book Summary
@FightMediocrity
2.3M views•2015-06-05

The Nocebo Effect: How Beliefs Can Cause Real Harm
@CGPGrey
10.4M views•2013-12-23
Related Study Plans & Knowledge Roadmaps
Structured learning paths in Psychology