





















Glacier mass balance is the annual budget comparing accumulation (snowfall input) and ablation (melting and calving output); glaciers have an equilibrium line altitude (ELA) where accumulation equals ablation, dividing the accumulation zone above from the ablation zone below; when ELA lowers, glaciers advance and grow, while rising ELA causes retreat, demonstrating how glaciers respond to climate change through changes in their mass balance.
Glacier Mass Balance Explained: Accumulation, Ablation & ELA
Added:Basic definition of a glacier and how ice-sheets and alpine glaciers form over long periods.
The concept of the hydrological cycle, specifically processes like precipitation, sublimation, evaporation, and runoff.
The relationship between altitude and temperature (lapse rate) and how seasons affect snowfall and melting.
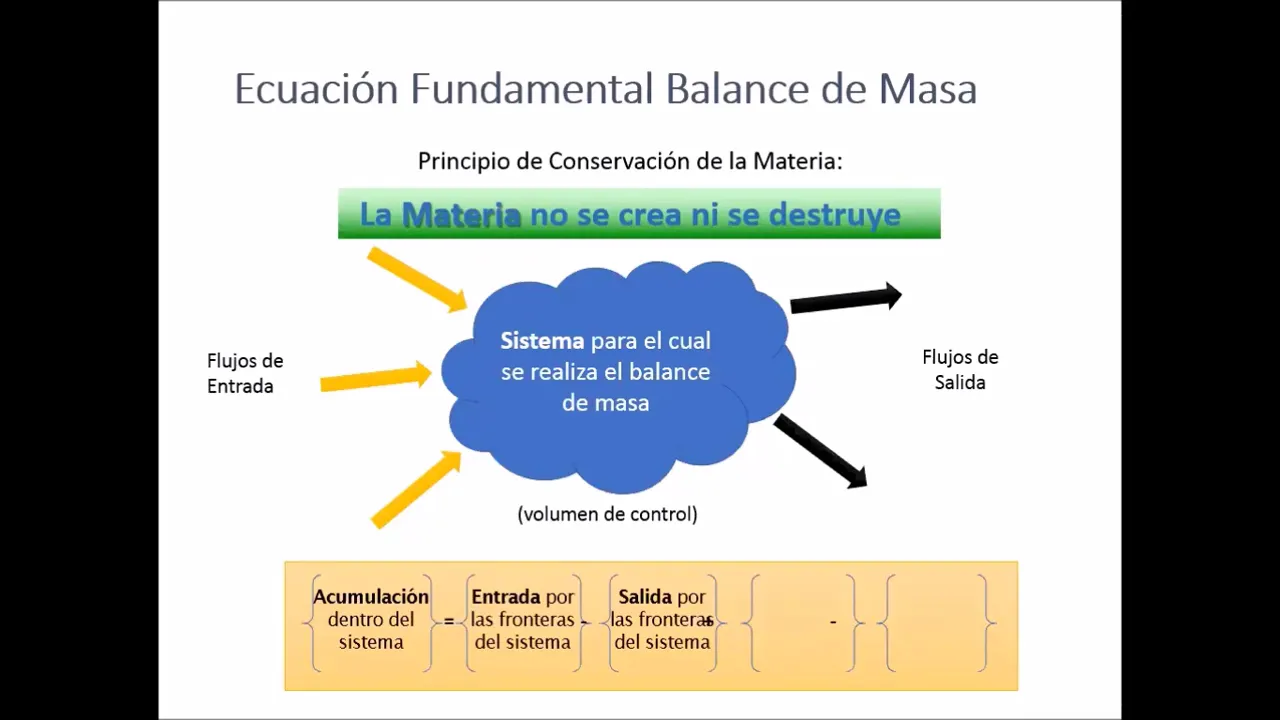
Fundamental principles of mass conservation (the concept of inputs, outputs, and net storage).
Methods of measuring glacier health, such as satellite remote sensing, GPS tracking, and field-based ablation stakes.
The geomorphological impacts of glacier movement, including the formation of moraines, crevasses, and U-shaped valleys.
The role of retreating glaciers in global sea-level rise, freshwater security, and downstream ecosystem impacts.
Advanced glacial hydrology, including subglacial drainage systems and the hazards of Glacial Lake Outburst Floods (GLOFs).
1.5K views36likes9:41Original Release: 2020-10-06
[Music] to begin our session on glacier mass balance i just want to talk you through these graphics from the open global glacier model that explain roughly what mass balance is all about these illustrations refer to a mountain valley glacier but i'll show you in a later session how you can translate them very easily and they apply equally well to an ice sheet situation and we're dealing in all of this with surface mass balance there's also a mass balance to worry about and in the interior and the base of the glacier but we're just talking about surface mass balance of glaciers mass balance is all about the balance or the budget between inputs and outputs to and from a system in a glacier system the input is the input of precipitation snow in the form of accumulation in this diagram over the course of time a layer of snow is building up on the glacier you can see they've drawn it here where a little bit more snow is building up in the higher layers of the glacier and the higher altitudes the colder environment the snow in the snowier environment and a little bit less down at lower elevations that might vary from glacier to glacier also through the course of the year there is mass loss from the glacier ablation melting of the snow and ice carving of material off the front of the glacier we'll look at that in another part of the session but there's both accumulation gain of mass and ablation loss of mass over the course of the year and they've superimposed the two on the diagram here and if you sum those two effects together then we have this overall picture so if you add the uh the accumulation and take away the mass loss over the course of the year that's giving us an annual mass balance and over the course of the year here you can see there's more accumulation than there is ablation in this upper area of the glacier but there's more ablation than there is accumulation in the lower area of the glacier so overall we have a mass loss or a negative balance a negative mass balance in the bottom of the glacier and an overall mass gain or a positive mass balance at the top of the glacier in a glacier that's in some kind of equilibrium that difference will be balanced by movement of ice from the upper areas of the glacier through the glacier to the lower areas of the glacier in between the upper area of accumulation and the lower area of overall ablation the accumulation area and the ablation area there's a zone or a line across the glacier where locally the mass balance is zero the amount of accumulation is equal to the amount of ablation that's referred to as the equilibrium line and the position of the glacier where that line occurs is referred to as the equilibrium line altitude the ela and that's a very important concept in last year's when we're thinking about how glaciers advance and retreat in response to climate change because changes in the position of that equilibrium line change the accumulation area ratio in other words the ratio between the size of the accumulation area where the glacier is being fed and the size of the ablation area where the glacier is losing material so if the ela decreases the altitude of the equilibrium line decreases then the accumulation area increases so we're getting overall a greater amount of input in the accumulation area and the ablation area where we're losing material that shrinks in that situation other things being equal you might well expect the glacier to be healthy and expanding and advancing so if the ela is decreasing is lowering then we're likely to have a healthy advancing glacier by contrast in warmer conditions when there's more melting less accumulation the equal the equilibrium line is rising up the altitude is increasing the equilibrium line is moving up the glass here and we're shrinking the accumulation area we're expanding the ablation area and the consequence of that is likely to be retreat of the glacier so there's a very straightforward correspondence there between inputs outputs balance and the health or expansion and contraction of the glacier and we're going to look at that in a little bit more detail in the later sections of this unit i just want to draw up those mass balance ideas that you've already seen in a slightly different way so you've seen the mountain glacier example where we have an equilibrium line above which there's an accumulation area and below which there's an ablation area with more accumulation and ablation up here and more ablation than accumulation down here flow of ice through the system and advance or retreat of the margin partly in response to changes in mass balance through time we drew that through a mountain glacier system and you've seen that in the in the graphics previously you can do something very similar for an ice sheet situation where the accumulation zone is in the central area and the ablation zone is around the perimeter and the equilibrium line altitude runs somewhere in between the area in the middle where there's more accumulation ablation and the area around the edge where there's more ablation and accumulation so we can also consider the mass balance through the course of a year a mass balance year let's draw a graph with positive balance or negative balance equilibrium so zero mass balance and time over the course of the balance year during the course of the winter you would expect there to be a gradual accumulation over the course of time there will also be some ablation during that period so superimposed upon that mass gain from snowfall input there will also be some mass loss from melting carving even during the winter in many glaciers as we then move through into the summer the rate of increase the positive inputs into the glacier will diminish and flatten off as we get less accumulation during the summer months and you would anticipate greater ablation so more of a negative input during the summer when you're losing material over the course of the whole year if you combine the accumulation and the ablation you'll have a balance here that looks something like that now if at the end of the year this line comes back to zero then the glass here is in equilibrium it's in balance the balance is zero but if it ends up somewhere above zero then we have a positive annual mass balance and if it ends up somewhere below zero then we have a negative annual mass balance finally we can draw what we call a vertical net balance profile for any glacier for that we have negative balance on the left hand side positive balance on the right hand side so uh zero balance or our equilibrium is up the center of the graph so for any glacier we can draw onto here what the local mass balance is at different elevations of the glacier so typically at the bottom end of the glacier we're going to be in a negative mass balance environment we're in the ablation zone and then as we go higher and higher up the glacier the amount of ablation is going to decrease relative to the amount of accumulation until we reach a point where negative and positive balance out and that's the equilibrium line for our particular glacier above the equilibrium line because there's more accumulation and less ablation we're moving into a positive balanced area a lot of glaciers in their upper areas curve back towards the left hand side because the amount of snowfall decreases at high elevations so in the center of the antarctic ice sheet for example there might be less accumulation than there is closer to the edge of the ice sheet because the atmosphere is colder and drier not so much snow so for different glasses glaciers you can draw different vertical net balance profiles and you can revisit the profile profile for any particular glacier over the course of time and see how the ela the equilibrium line amplitude is changing over the course of time so the vertical net balance profile is another interesting way to represent mass balance uh in a graphical form now i've only given you a very quick introduction at some of the ways we're looking at mass balance there's lots of reading for you to do on this and i'll point you to that in other sections of this unit
Up Next

14:30
Protecting the Himalayas: The Third Pole's Urgent Climate Crisis
@TED
206.1K views•2019-09-05

15:54
Life in Biosphere 2: Sustainable Ecosystems & Human Survival
@TED
334.9K views•2009-06-16
14:30
Microplastics Everywhere: How Plastic Impacts Our Lives
@TEDx
100.9K views•2018-05-08
10:28
Ice Stupa Artificial Glaciers: Solving Ladakh's Water Crisis
@SonamWangchuk66
3.2M views•2015-05-03
Related Study Plans & Knowledge Roadmaps
Structured learning paths in Environmental Science
environmental-science
Ocean Noise: Cetacean Impacts & Mitigation
01Fundamentals of Underwater Acoustics
02Marine Mammal Bioacoustics
03Anthropogenic Noise: Shipping & Seismic Surveying
+ 2 more learning modules
16h5 modules
Explore Roadmap
environmental-science
Road Ecology: Corridors, Overpasses & Fencing
01Foundations of Habitat Fragmentation and Carnivore Ecology
02The Road Barrier: Ecological Impacts of Transport Infrastructure
03Principles of Ecological Corridors and Connectivity Mapping
+ 3 more learning modules
14h6 modules
Explore Roadmap
environmental-science
Ocean Acidification: Kelp Buffering & Shellfish
01Fundamentals of Ocean Chemistry & pH
02Chemical Pathways of Coastal Acidification
03Bivalve Physiology & Calcification Under Stress
+ 2 more learning modules
18h5 modules
Explore Roadmap
environmental-science
Ice Stupas: Glacial Retreat & Water Security
01Foundations of Glaciology & Mountain Hydrology
02Climate Change and Glacial Retreat Dynamics
03The Science of Ice Stupas & Artificial Glaciers
+ 2 more learning modules
14h5 modules
Explore Roadmap