









![Tomographic Image Reconstruction: Iterative Methods (Part 3) [L30]](https://i.ytimg.com/vi_webp/aES-vIndNyY/maxresdefault.webp)




![Parellel Beam CT, Fan Beam CT and Cone Beam CT geometries [Radiologic Technologists / Radiographers]](https://i.ytimg.com/vi_webp/KhOCZsl28dg/maxresdefault.webp)






![[19/05/2021] Severo Ochoa Seminar by C. Lee; "Shape prior metal artifact reduction algorithm..."](https://i.ytimg.com/vi/OhKPSg2r7ws/maxresdefault.jpg)
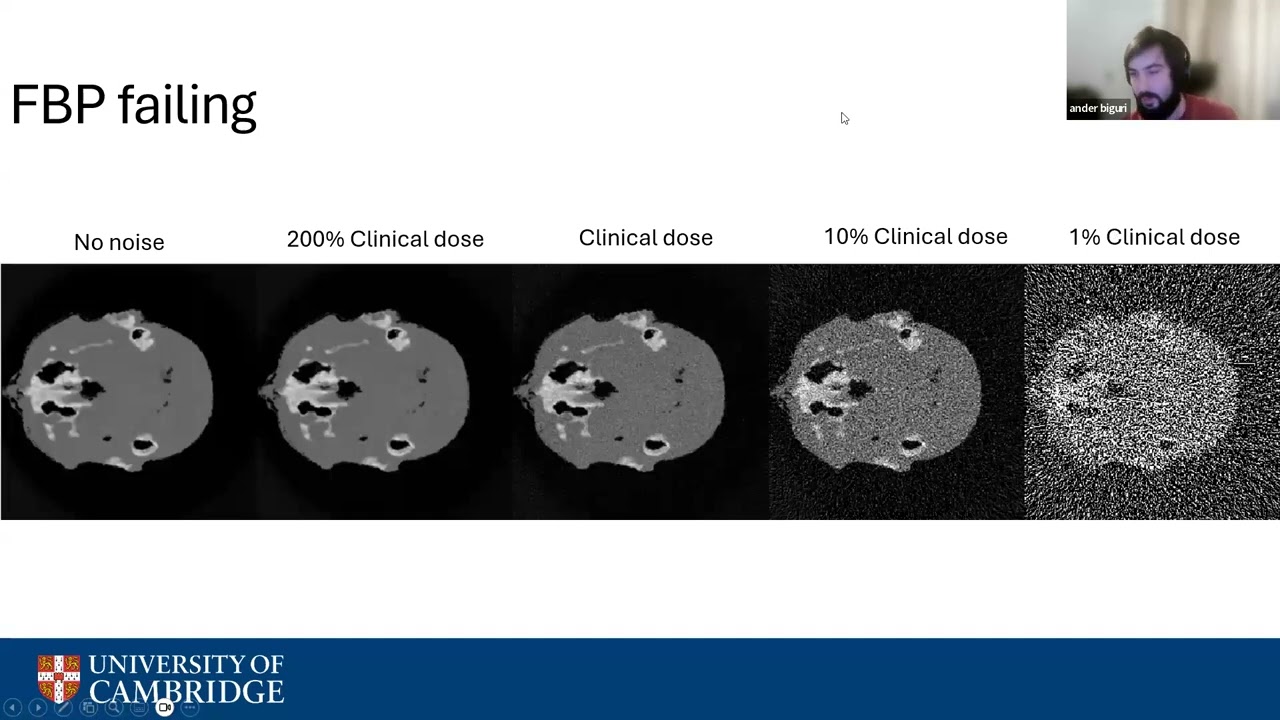


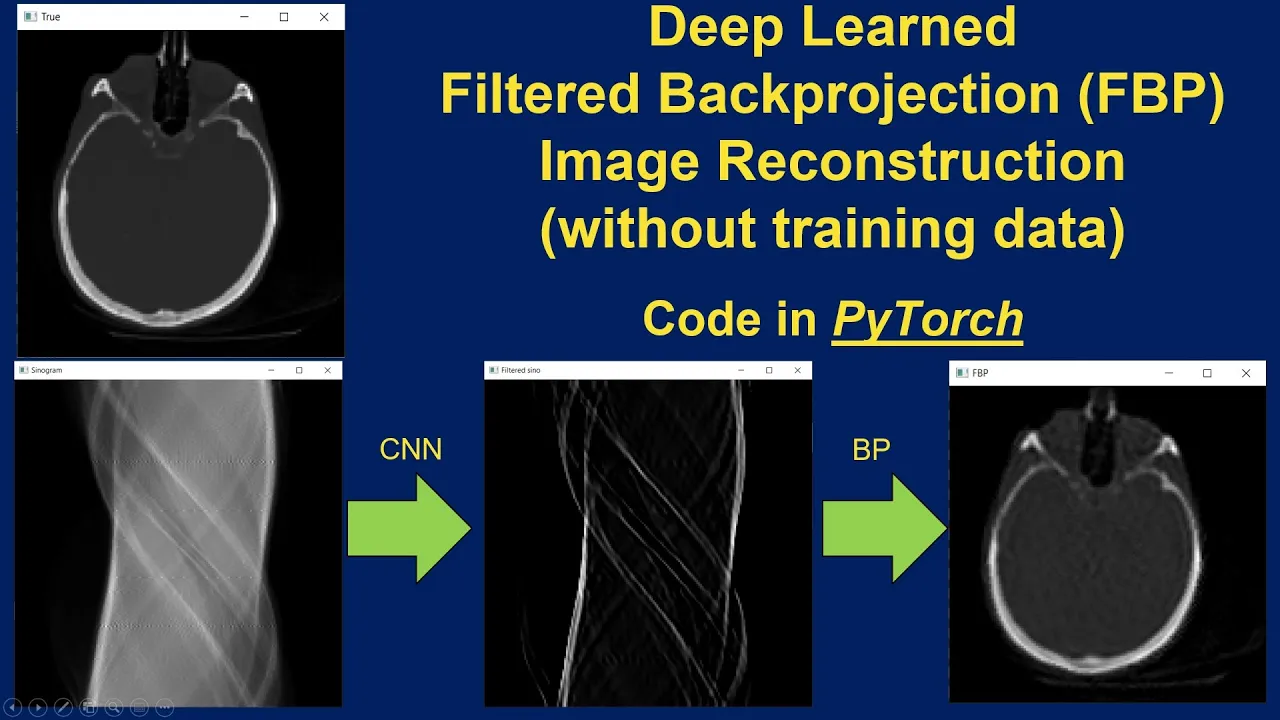
CT reconstruction uses mathematical tools to convert 2D projection images from multiple angles into 3D anatomical representations. The Radon transform mathematically describes how projections are formed by integrating the object's attenuation coefficient along lines at specific angles. The Fourier Slice Theorem establishes that the 1D Fourier transform of a projection equals a radial slice through the 2D Fourier transform of the object at the same angle, forming the theoretical basis for reconstruction. However, practical implementation requires convolution backprojection, which applies a high-pass filter (such as a ramp filter) to the projection data before performing backprojection to correct for blurring and reconstruct the original image efficiently.
CT Reconstruction: Radon Transform, Fourier Slice Theorem, & Convolution Backprojection
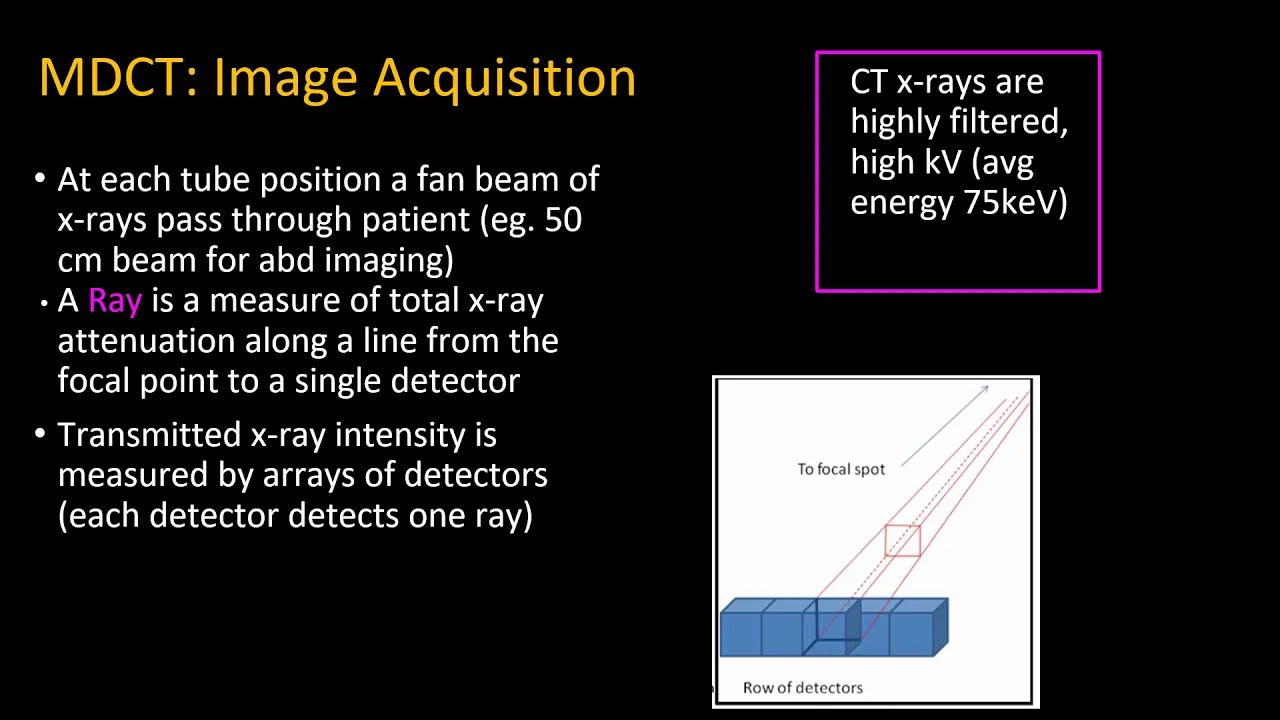
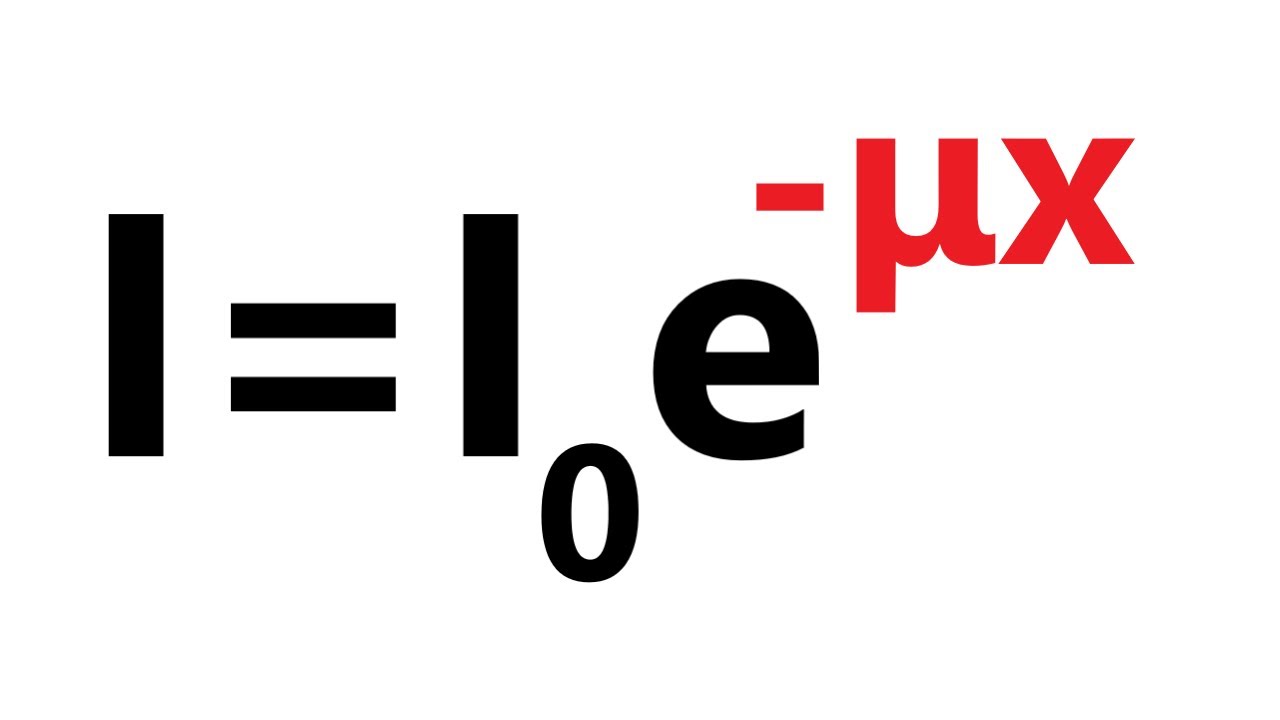
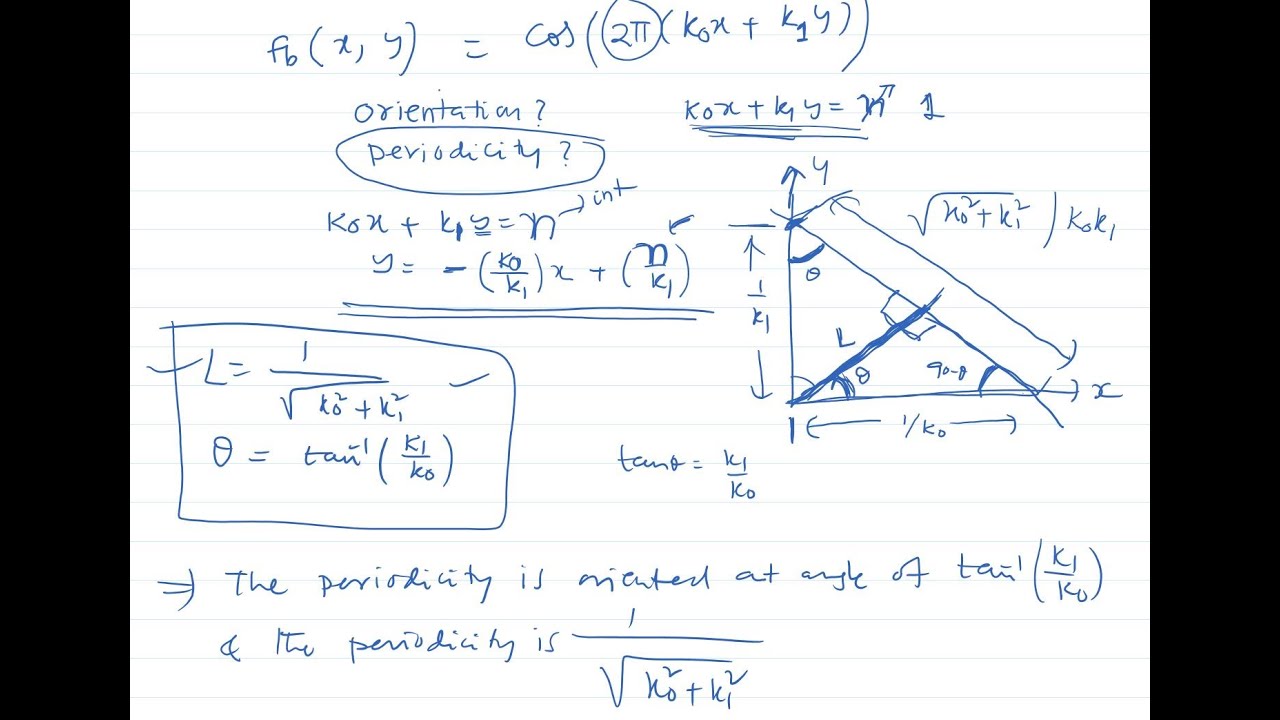
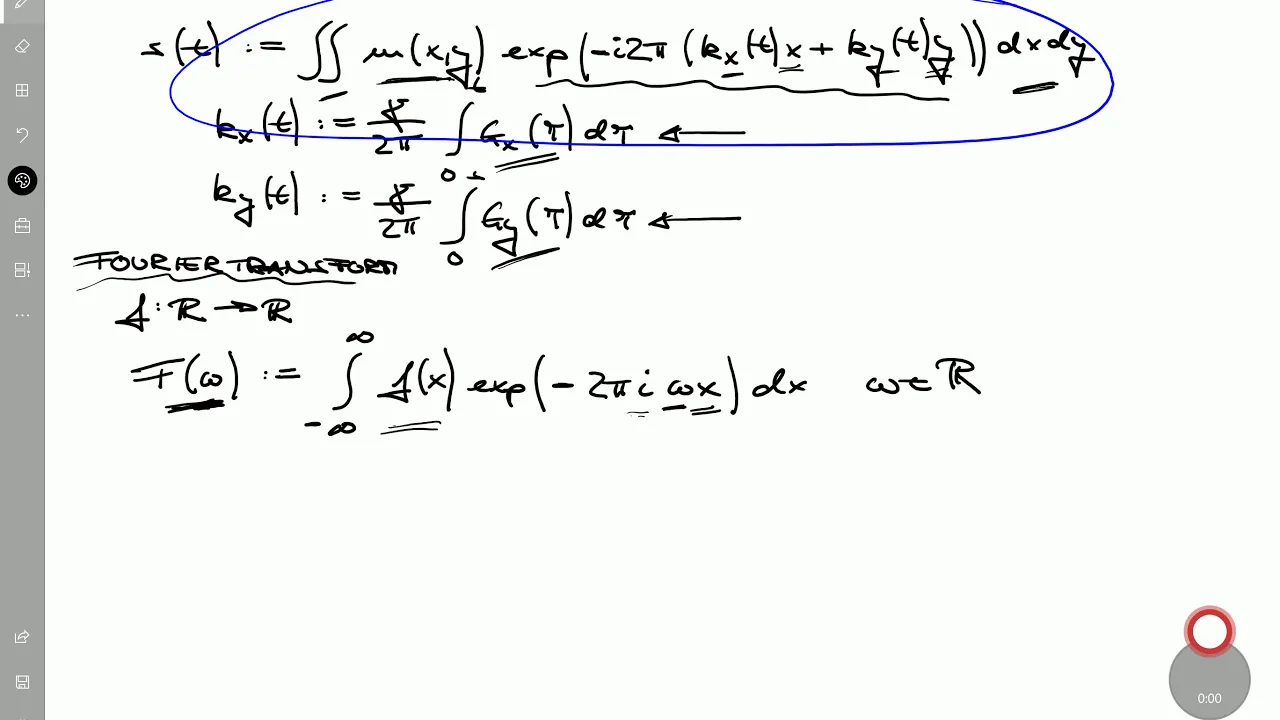
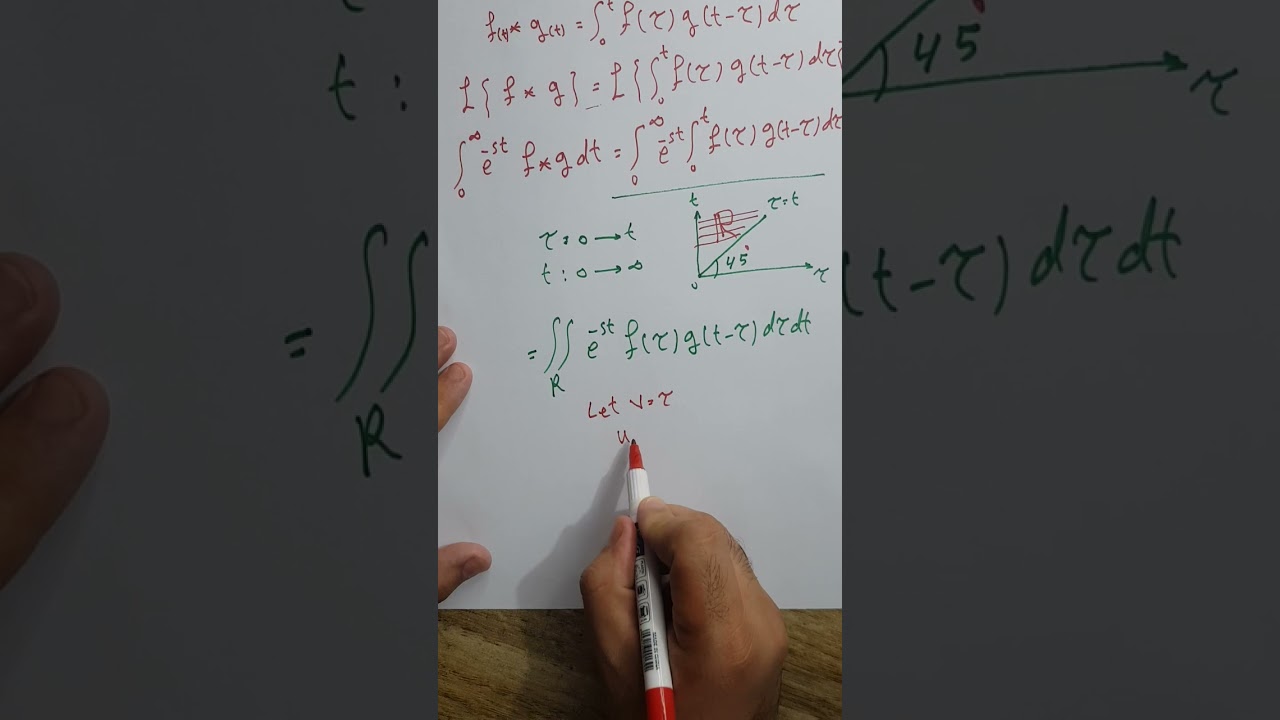
Added:hey guys and welcome to gp academia you can use mathematical tools to reconstruct a 3d representation of the anatomy being image this is done first by acquiring multiple 2d projection images from many angles with this imaging principle we acquired 3d images in medical imaging modalities such as computer tomography or ct positron emission tomography or pet and single photon emission tomography or respect modern medical imaging systems incorporate a more complex iterative reconstruction techniques but for this lecture i will focus on analytic reconstruction traditionally used in medical imaging let's start this discussion and this is the outline of this video lecture okay so let's start with this expression for the attenuated intensity i iso d detected by the detector system after the x-ray passes through the patient's body for given effective energy we have this expression then we can rewrite this in terms of this natural logarithm expression the left-hand side of this expression below this one refers to our measured quantity given that we know the value of i sub b this one on coming out from the patient then we have the value of i sub naught taken from the ct's air calibration using the mathematical expression i have shown earlier we can define projection as the negative logarithm of the fractional x-ray transmittance of the object so this one and this is based on this figure we have here the x prime y prime frame which is the rotated coordinates with respect to our x-ray source such that the source is placed along the y prime axis and our detector is placed along the x prime this one then we have this parallel projection and oh we need to get this projection by measuring it along the detector system many medical imaging systems can only measure projections through an object let's see our object has a density of this function f as a function of x and y projections must be collected at every angle theta so this one and displacement r so we have here the object space we have the object the one in blue and this is the object space in x and y and we have this rotated coordinates and we want to get this projection for every angle theta and for every displacement r so this one the length of our detector and we'll call this projection the forward projection p theta is a function of r and this is known as the readon transform object can have varying values of attenuation coefficient and therefore we will have a certain profile that will be collected based on that attenuated photons objective of this reconstruction is to reverse the process we want to get the or we want to reconstruct the original image this one so let's see the original image is the function f and we can do this by doing first the fourier slice theorem or through the direct reconstruction using the fourier slice theorem and second we have the convolution back projection now in discussing ct reconstruction we have this two main concepts first we have the fouries slice theorem which is said to be the heart of the ct reconstruction and this is the basis of the second concept the filtered back projection also known as the convolution back projection let's discuss first fourier slice theorem or the record construction using this theorem it is difficult to implement this in practice but let's try to discuss this first we have this object function the one in blue a place in the x and y coordinates and we have this projection let's see the one we acquired using our ct machine and we'll describe this projection as a function p as a function of x then applying a 2d for a transform we will get its counterpart in the fourier domain in practice we don't know yet the object the object function but we know but what we know are the set of projections from the line integral we have discussed previously it is stated in the fourier slice theorem that the one dimensional for a transform of the projection function this one or the p are also known as the detector function is the same with the slice at the 2d for the representation of our object function in blue so this one after we do one d for a transform this is equivalent to this slice in our 4e domain in addition it is the line at the origin from the same angle theta theoretically we can do the record construction with 40 slice theorem by just acquiring different projection data so we'll acquire different projection at different angles then we'll do one d40 transform then we will form this one then what we can do is to inversely transform this one to go to the object's piece or to get the object function but it is difficult to implement in reality then we have the convolution back projection shown here and this is what we usually use it is very efficient and therefore this is widely used instead of doing an inverse for a transform it applies an operation called the convolution and this is used to filter or to remove the blurring before smearing back the projection across the image at the angle it was acquired so we have this projection data from various angles then we smear them out to reconstruct our image in discussing analytic methods we have these three domains first the object space the object space refers to the linear attenuation values of our object or of our patient second we have the read and space reading space refers the projection values recorded under many angles so let's say from 0 to 180 degrees this is also known as the synogram or sometimes synogram space third we have the 4a space and we can derive this one from the object space by doing a 2d for a transform the three spatial domains are interrelated and their relationships can be described mathematically 2d for a transform converts the object space into raid and space the generation of 2d radon space happens during ct scan where let's say projections are recorded as raw data in various angles and therefore we will have this 2d read and transform then from the reader order from the reading space we can get the 1d40 transform to go to the 4e space we will find the equation for the projection and we can consider this scenario or this object so we have this object function or the original image which is f as a function of this positions x and y and we have this rotated coordinate system which refers to the detector system so this r and we have this theta so we are acquiring uh projections in this angle theta we are taking the integral along the z direction however we can only access the image value in the x y coordinate which is which is this one or the object space thus we have to change the r z to the x y coordinates the projection integral in terms of the rotated coordinate system so we have this matrix or the rotation counter clockwise rotation matrix and we have this expression to rotate our coordinates and therefore we have this expression for the projection acquired in this rotated system you can interpret this integral expression as the projection of the object along the detector length r so this one and angle theta note that in this case r is equal to zero corresponds to the point x y is equal to zero zero or the origin of our object space so the origin is the same with r is equal to zero so this one is called the read on transform of this function f or this is just the projection all right so now we have here an illustration on how we acquire the projection data at different angles this is specific actually for spect or single photon emission computed tomography acquisition wherein we acquire information regarding the distribution of rigid tracer inside the body of the patient based on the emission through gamma rays in ct we know that we are acquiring the intensity or the attenuated photon as it passes through the patient and in this case we have here true emission instead of the transmitted data but uh cp scan works similarly in terms of acquisition and reconstruction except that the attenuated x-rays at one side of the patient is collected thus ct scan is a transmission imaging so here we have the acquisition of signal at different angles so we have this our rotating detector we have this projection at different angles then we have this synogram or this is just the radon space we have here the theta so here we have from let's say 0 to 180 degrees then the pattern will repeat and we have here the projection signals now i will discuss here the fourier slice theorem also called the central slice theorem or the projection slice theorem i will not show here the proof but here's a general idea we have this projection function or this is just the data that we have occurred when we place our detector along r then we acquire projections at different angle theta if we get the 1d for e transform of this function or it's just a continuous time for a transform we will get this projection function in terms of rho which is just a frequency domain we can also get the 2d for the transform or the continuous space for the transform of our object function f and we will have this representation of our object function in the 40 or in the frequency domain now given those things we will have this relationship so therefore this projection in terms of the 40 space or in terms of the variable row is equal to a certain line or to a certain slice in this 2d 40 function so therefore uh if this is the space for for the objects uh 2d for a transform this one here the slice refers to this projection and this is in terms of polar coordinates so that's why we have this one in terms still of this data wherein we accord this projection or this angle wherein we acquired this specific projection and here's a summary of the fourier slice theorem if this is our object we can acquire the projection at different angles in terms of p theta as a function of r then if we get the 1d for e transform of this we will get this projection in terms of the frequency variable row and this refers to a slice here in the 2d for the function if we do a 2d for a transform of our object function or this is just the continuous space for the uh transform and therefore uh this slice refers to this and if we get the slices or if we get the projection at different angles we can get the different slices of our 2d for a transform thus what we can do theoretically is just to get the inverse of this to go back to our object function here's a summary of the reconstruction using the 4d slice theorem this is the projection function and this is the directly measurable quantity for our physical system if we get the continuous time for the transform of this projection function we will get this projection function in terms of the frequency variable row now we said that uh in the fourier slice theorem this one refers to the slices in terms of the 2d for e transform of our object function f as a function of x and y so therefore if we acquired different projection for different angles then if we do 1d40 transform for those projections we will acquire the slices of this 2d for the function for our object function now we can get the inverse of this to get our object function f but the problem here is our data the projection is in polar coordinate or these are polar data and we know that in terms of the fast body transform or in using the phosphorylate transform we need rectangular samples or green samples so what we do is interpolation but the problem is that interpolation is computationally uh expensive and uh but again around the center or the origin of our 48 domain we have very dense data so we have or this refers to the low frequency signal of our image and therefore we have somehow accurate uh signal for the low frequency but as you go away from the origin this refers to the higher frequency signals of our image and we have fewer data in this area and therefore it can cause uh blurring or lower accuracy for our image if we do interpolation and that's the problem to avoid the problem of interpolation and the need to do an inverse body transform what we can do is convolution back projection or the filtered back projection and this is commonly implemented with the following steps so first we measure the projection along the line as shown here then we filter the projection using a high pass filter and at each angle projections are filtered first so we have here the convolution expression this is our projection and this is our filter this is our projected uh or this is our filtered projections and this is an example of the high pass filter that we can use so the frequency response of the filter is described by this h but in real filters also we should take note that it is band limited to a certain cut off frequency f c or f sub c then we do back projection so back projection is smearing the signal so we smear out uh in the different direction after we have filtered our projection function so this is the illustration back projection is a method wherein we smear the measured profile associated with each angle of acquisition across the image and this reconstruction strategy alone results in a blurred image so thus filtering is needed this shows the filtering of our synogram or this is just our projection data for different angles this is a type of filter called the ramp filter and this can be applied easily it is simply a multiplication function in the frequency domain before in the spatial domain we do convolution next convolution operation and uh we are working with discrete signal data here in medical imaging and therefore we can utilize pass for a transform for fast and accurate transformation of data to and from the 40 space or to the frequency space this corrects the blurring so we have this one over our blurring effect that manifests during back projection as we have shown in the previous slide after filtering back projection of the filtered synogram will be done to have a better reconstructed image as depicted here this process is called filtered back projection summary first or reconstructing the original image can be done using mathematical algorithms for image reconstruction convolution back projection or filtered back projection is based on the 4d slice theorem and this is used traditionally in medical imaging there are three domains associated with the technique of the filtered back projection so we have the object space redone space and the polyspace and that's it for this video lecture thank you hi if you have learned something in this video and you like my content please consider subscribing my youtube channel gp academy yes see you in the next video
Up Next

Symmetric Group in Group Theory: A Complete Guide
@R-H.S
6.8K views•2023-05-13

Elliptic Curve Cryptography Explained: ECC, ECDSA, ECDH
@PracticalNetworking
28.5K views•2024-10-21

Fourier Series Introduction: The Big Idea Explained
@DrTrefor
387K views•2021-05-03

The Mathematical Impossibility of Accurate World Maps
@Vox
23.3M views•2016-12-02
Related Study Plans & Knowledge Roadmaps
Structured learning paths in Mathematics