






![STUD[IE] UAS STATLAN EVEN SEMESTER 23/24](https://i.ytimg.com/vi/h7X1oPVbTp0/maxresdefault.jpg)



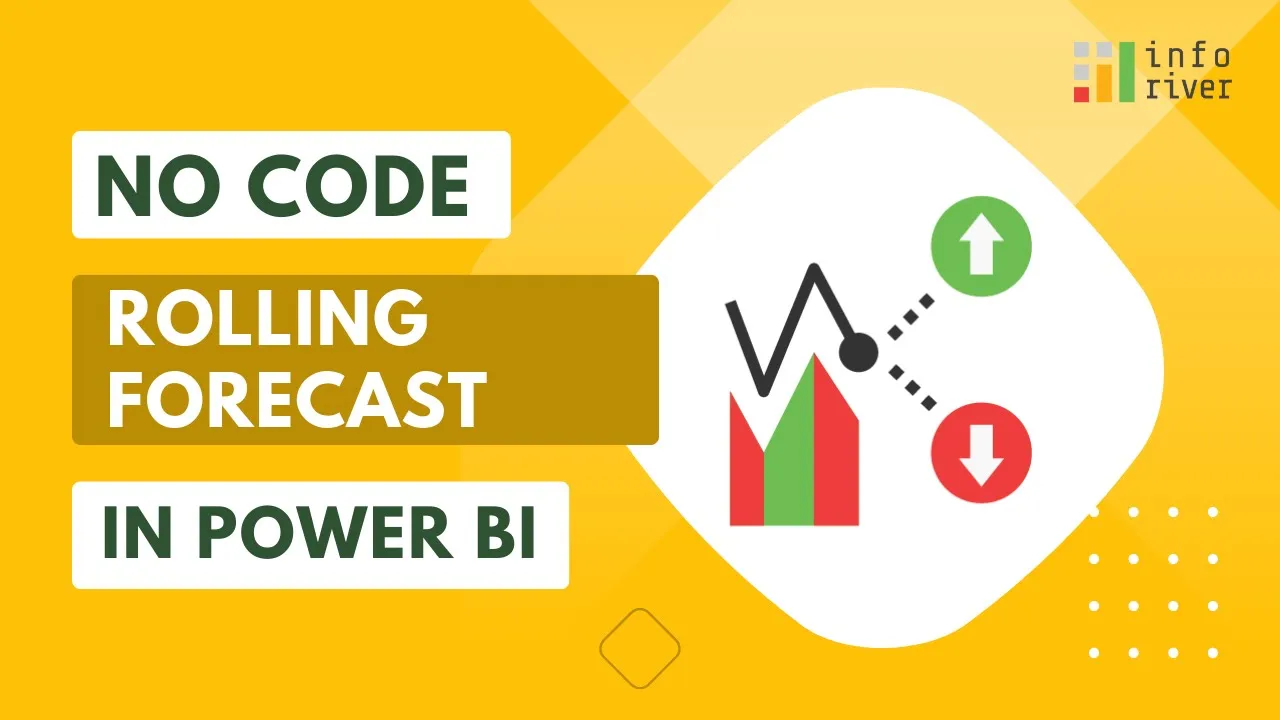








A rolling forecast in Excel can be created using dynamic formulas that automatically update based on the current month, incorporating historical data analysis with FORECAST.ETS functions to predict future values while ensuring forecasts only display for the upcoming 12-month period through conditional logic and proper cell referencing.
Build a Dynamic Rolling Forecast in Excel with FORECAST.ETS
Added:Intermediate proficiency in Excel, specifically working with dynamic formulas, cell referencing (absolute vs. relative), and logical functions (e.g., IF, AND).
A fundamental understanding of time-series data structures, including how chronological data (months, quarters, years) is organized for analysis.
Basic knowledge of statistical forecasting concepts, particularly the difference between linear trends and seasonal fluctuations.
Familiarity with the concept of a 'rolling' timeline or horizon in financial planning and budgeting.
Integrating rolling forecasts into dynamic dashboards using visualization tools like Power BI or Excel Power Query for automated data ingestion.
Applying variance analysis techniques to systematically compare actual financial results against the FORECAST.ETS generated baselines.
Implementing advanced scenario and sensitivity analysis using Excel Solver, Goal Seek, or Monte Carlo simulation models.
Transitioning to programmatic forecasting models using Python (e.g., ARIMA, SARIMAX, or Prophet) to handle larger, more complex datasets.
56.2K views146likes10:05Original Release: 2022-12-16
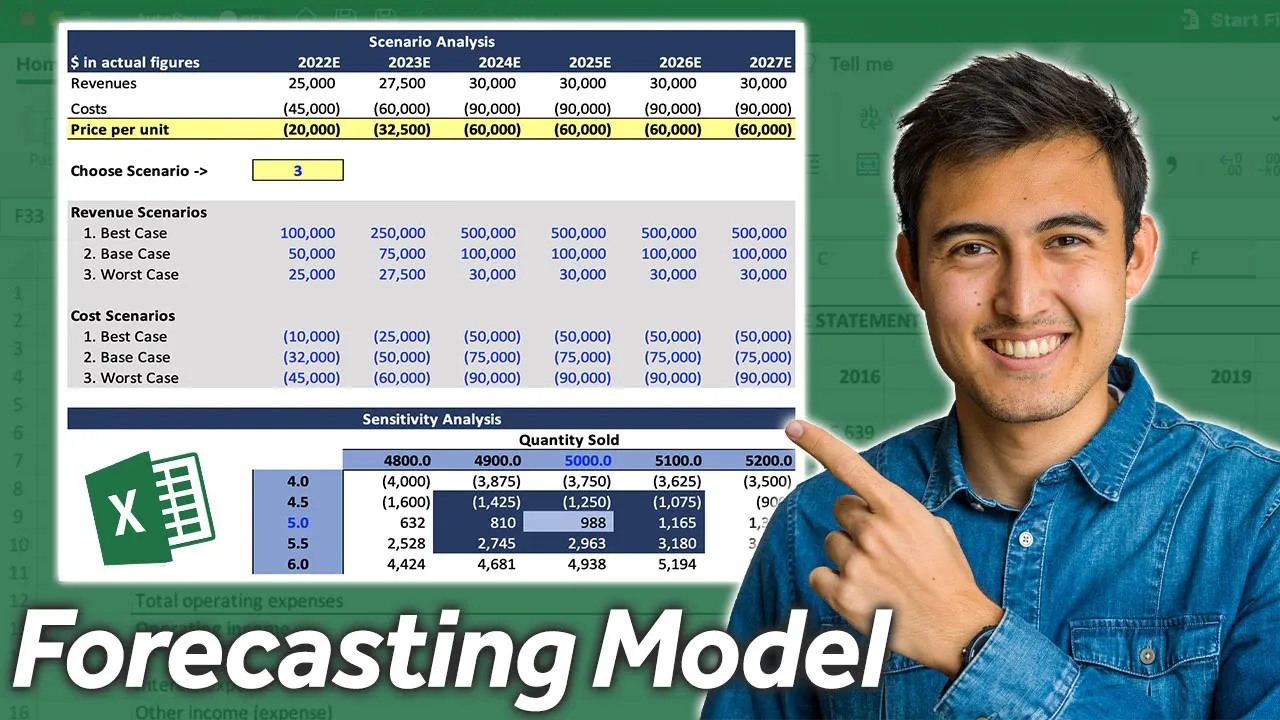
foreign fairhurst and what I'd like to take you through today is how to build a rolling forecast model now I know there's lots of fancy software out there that will do it for you but I'm going to show you a method just using plain old standard Excel standard Excel formulas and maybe just a little bit of formatting so it's going to look like this when we finished it so it's just going to be a chart so we can see our actual and our forecast we can put in our assumptions that go in here and it's going to roll out forward at any point in time it will roll forward for 12 months so let's get started so I've set it up for you like this so we've got our start date here so our start date is based on this number here and then everything rolls forward from there so we say a current month plus 365. we've also set this up with actual and budget so I've used some if to say if it's less than or equal to the current month give me actual otherwise budget and I've also used some Flags here so flags are a pretty common method in modeling for working out whether something Falls within the forecast period or not so at the top here we've got our budget then we've got our actual so what I'm going to do first of all is just populate this with some formulas and I'll say if this row here is equal to the word budget we'll pick up budget otherwise we'll pick up the actual there we go so we'll copy that across so that creates a block of formulas like that so we can see that it will automatically pick up either the actual or the budget and then of course it's nice to have a little thumb over like that and we can copy that down there we go all right so the next thing that we need to do is uh use we want to use our historical data now you might use some drivers sometimes we have a different driver for every single line item in this case we are going to use uh the forecast we're going to use some regression to look at the historical data and then use that to forecast going forward so we're going to use the last couple of months of data so I'm going to start from here because obviously you can't it's quite hard to forecast when you don't have any history so I'm going to use that those two numbers there to create a forecast that goes out over the next year or so but before we do that I might just go back and talk about the forecast function so you know if you've got some data that looks like this we can go in and create a line chart now if I were to look at that create a linear Trend you can see exactly what the forecast is going to look like and I can do that by dragging it down but a much better way to do that would be to use a forecast function so forecast will basically uh forecast our numbers directly along that trend line so the x-axis will be July the known wise will be the history and the known X's are the corresponding points on the x-axis so I can just copy that down like that so that gives us a a formula that will forecast along the linear Trend which is which is fine uh alternatively uh that's kind of a and you know that that method has been around in Excel for a for a long time there is another way of doing that and that is just to use a forecast sheet this is a relatively new addition to Excel and um that formula there you can use which is um you can just use it as a forecast.ets which will take into account the seasonality of the historical data so I probably prefer to use that formula the forecast dot ETF so that's going to take into account some of the seasonality so rather than just forecasting along a linear Trend so I'm going to go in here and use a forecast dot ETS I find it easier to use the um the dialog box so the target date is going to be that number there so I'll go in and put my dollar signs the values are going to be these two okay so what I'm gonna what I'm going to do here is Anchor the First Column because I want to roll forward so I put the dollar sign in front of the uh e but nowhere else there we go so the timeline though is similar except I'm going to put the dollar sign in front of the two and also in front of the E so we've got to get the dollar signs in this case is really important I'm just going to leave the seasonality blank there we go so if I've got my dollar signs right I should be able to copy it across and down let's just do a bit of a test there we go okay so you can see that it's picking up the numbers correctly so it's rolling forward like that okay all right looking good so I can use that formula there and I can copy it all the way across okay wow and it's going to go all the way we're going to actually forecast out for around about two years except I don't actually want two years I only want it to show for a 12 month rolling forecast so I'll get to that in a moment the first thing I'm going to do is take a little bit of a look at ah okay you can see here we've got a negative now that's a bit of a problem so you can see the formula is doing what we asked it to do which is to forecast and it really doesn't make sense though to have a negative value and this often often happens with forecast functions so I'm going to use a Max formula around it and say Max comma zero so that is going to give me the maximum value between the formula and a zero okay so that got rid of that problem the next thing we want to do is only forecast out for 12 months so it doesn't make sense for us to show a forecast here because we already have actual data for it we only want to forecast from the forecast period forwards and that's where these ones and zeros come into it so I'm going to take the formula that we've already built and I'm going to multiply it by the zeros and the ones again I'm going to get my dollar signs right there we go so that's a that's a zero because I don't want to include that in my rolling forecast control shift right arrow there we go so that has forecasted uh a long and only taken into account the the 12-month period going forward and I've set up some little calculations down below and that is is what has been used for my my chart that's been set up so the dotted lines there I did that by using a dash type of a dotted line which is kind of nice when it shows the forecast period and then a solid line for the actual and the budget there we go and the last thing I'm going to do there is to just go in and add in some sparklines because the sparklines just add a nice bit of visual to the end okay I'm going to change the color I'm going to sort of get it to match my color scheme and I might just make it a little bit heavier there we are maybe this is a little bit too heavy okay there we are and you could also choose the high point and the low Point perhaps and drag that down and there we have it so the thing that I really like about this method is that it's completely Dynamic so next year or next month even when you come along and you want to make a change so if you want to change uh if you want to change the current month you would say I'm looking at the third and you'll see that that will that everything will flow through and then if I were to add in some data for my actual everything will flow through beautifully and the other thing that I really like is that if I were to change that to 2022 there we go you can see everything's uh linked throughout and everything has completely updated as well of course you'll still need to update the numbers but building a model like this is completely flexible and dynamic and it means that once I know it takes a little bit of work to set up but once you've got it set up it's going to save you so much time in the end
Up Next

16:13
Kenia Monge Murder: Travis Forbes Case Analysis in Forensic Psychology
@DrGrande
139.6K views•2024-03-04

12:54
Triumph of Orthodoxy Icon: Byzantine Art & History Explained
@BenCallan
2.1K views•2024-08-06

9:49
FastAPI vs Flask vs Django: Choosing the Right Python Web Framework
@TechWithTim
302.5K views•2024-05-26

1:42
Game of Thrones Opening Credits: A Cinematic Analysis
@gameofthrones
46.3M views•2011-04-18
Related Study Plans & Knowledge Roadmaps
Structured learning paths in General & Interdisciplinary Studies
general-studies
Elevator Engineering: History, Physics & Cities
01From Hoists to Safety Brakes: The Dawn of Vertical Lift
02Hydraulic vs. Traction: The Engineering Physics of Elevators
03Modern Speed, Safety, and Algorithms
+ 2 more learning modules
12h5 modules
Explore Roadmap
general-studies
Rubber: Material Science, History & Geopolitics
01Origins of Natural Rubber & Mesoamerican History
02The Chemistry of Natural Rubber & Vulcanization
03The Geopolitics of the Rubber Boom & Colonization
+ 2 more learning modules
12h5 modules
Explore Roadmap
general-studies
Containerization: Evolution, Logistics & Trade
01Ancient Trade & Bulk Cargo: Amphorae to Barrels
02The Industrial Revolution & Cardboard Packaging
03The Containerization Revolution: Malcom McLean
+ 2 more learning modules
12h5 modules
Explore Roadmap
general-studies
Textile Tech: Evolution, Labor & Global Impact
01Pre-Industrial Textiles: Handloom & Cottage Industry
02Mechanization: The Spinning Jenny to the Power Loom
03The Factory System & Global Labor Transformation
+ 2 more learning modules
10h5 modules
Explore Roadmap