



![Mathvengers: Integral War [ 24 ways to integrate cos(x) from 0 to pi/2]](https://i.ytimg.com/vi/gO8AwBmQK5Q/maxresdefault.jpg)








![[LAFI'24] Hong Ge: Bayesian inference using probabilistic programming](https://i.ytimg.com/vi/4Xd98Lszhf0/maxresdefault.jpg)

![[08x10] Intro to Probabilistic Programming in Julia using Turing.jl and Pluto](https://i.ytimg.com/vi/ixHKOz2vnoA/maxresdefault.jpg)

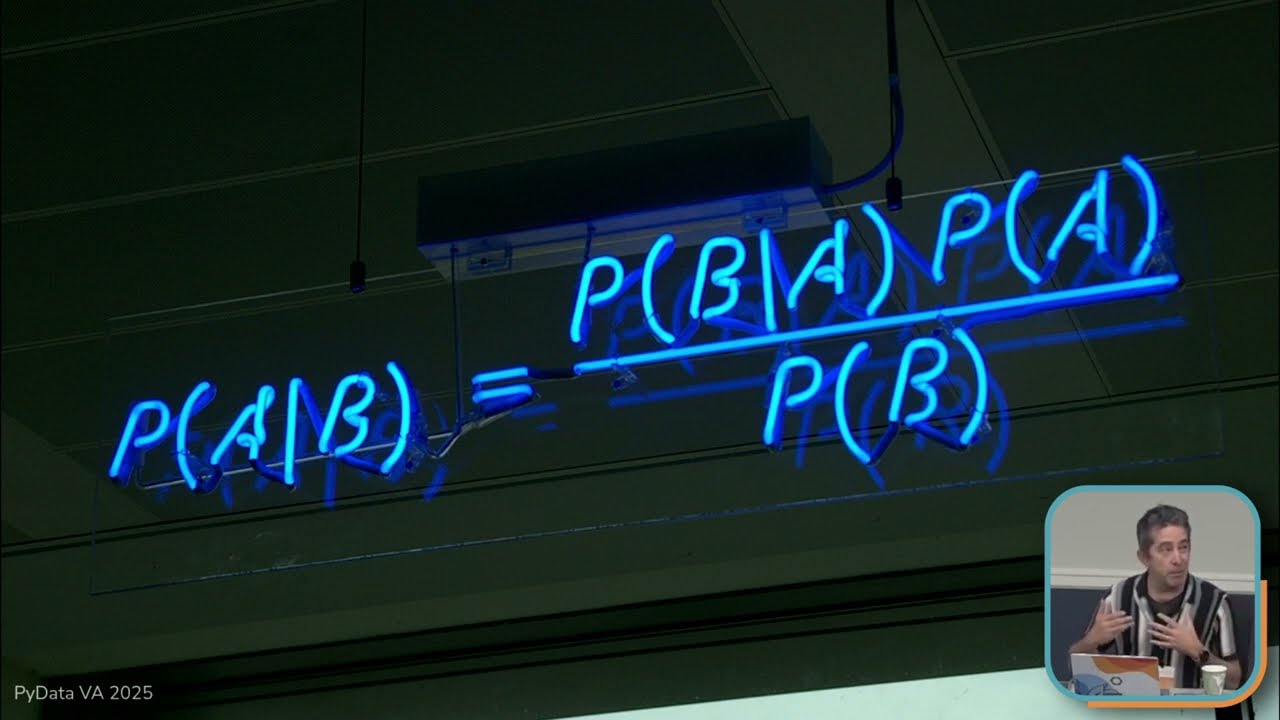


In Bayesian inference, we cannot directly compute the posterior distribution due to complex multi-dimensional integrals in Bayes' theorem, so we use Markov Chain Monte Carlo (MCMC) sampling to approximate it; unlike independent sampling which converges quickly to characterize distributions, MCMC uses dependent sampling where each draw depends on the current value, making convergence slower and requiring metrics like effective sample size to quantify efficiency, while convergence assessment is challenging because single chains can get stuck in subregions of parameter space, making multiple chains from dispersed starting points essential for reliable inference.
MCMC Explained: Bayesian Sampling and Convergence (Oxford Talk)
Added:Foundational Bayesian inference, specifically the concepts of prior, likelihood, posterior distributions, and the challenge of calculating the normalizing constant (marginal likelihood).
Basic probability theory, including conditional probability, joint distributions, expectations, and the Law of Large Numbers.
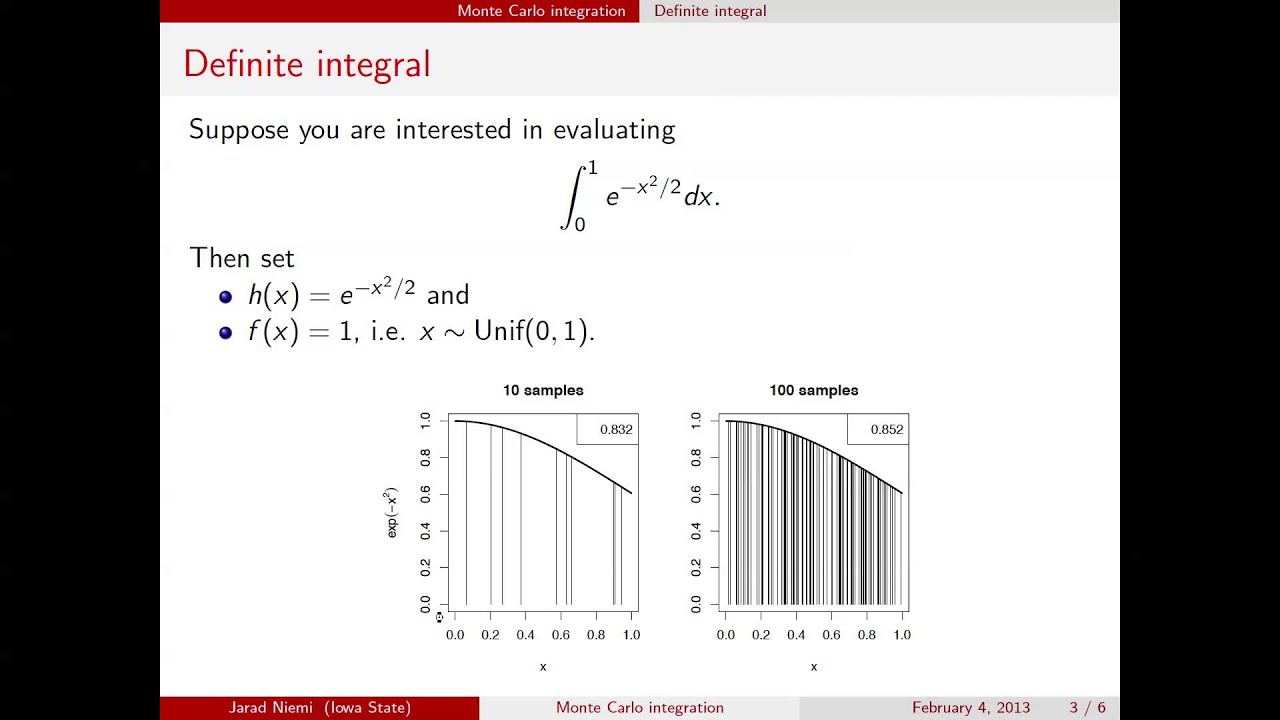
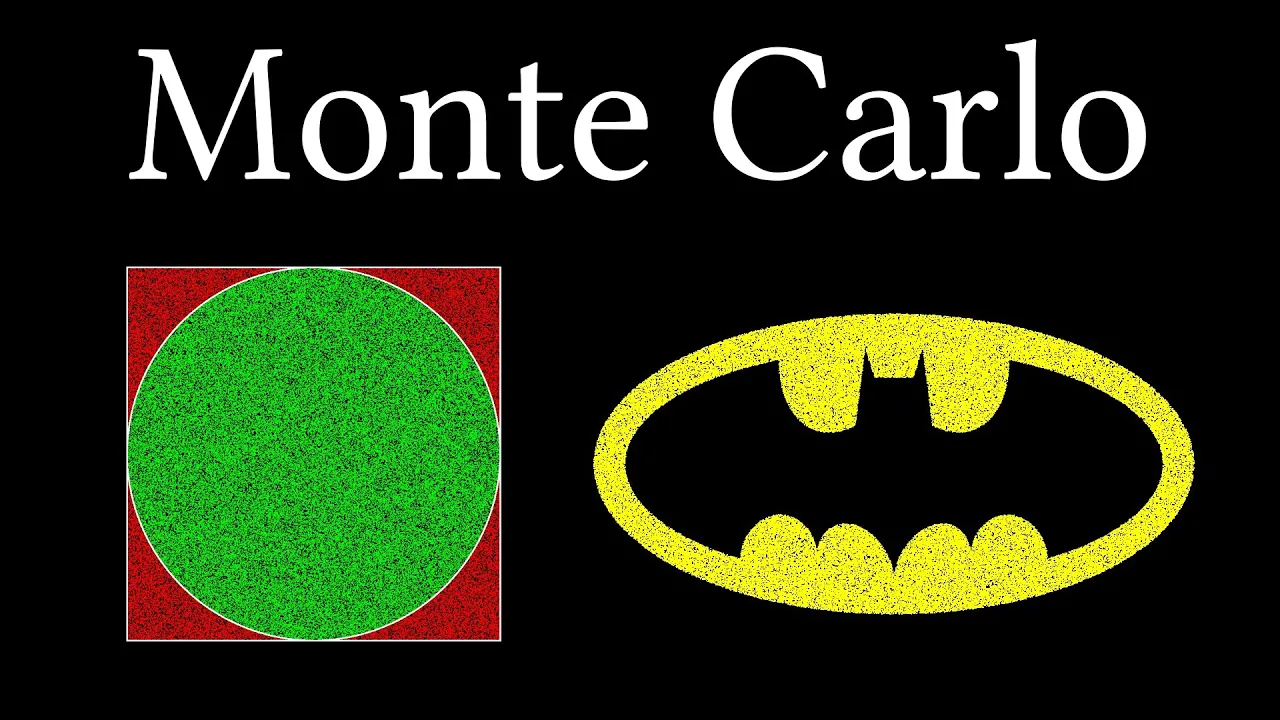
The concept of Monte Carlo integration, which involves using random sampling to numerically approximate complex integrals.
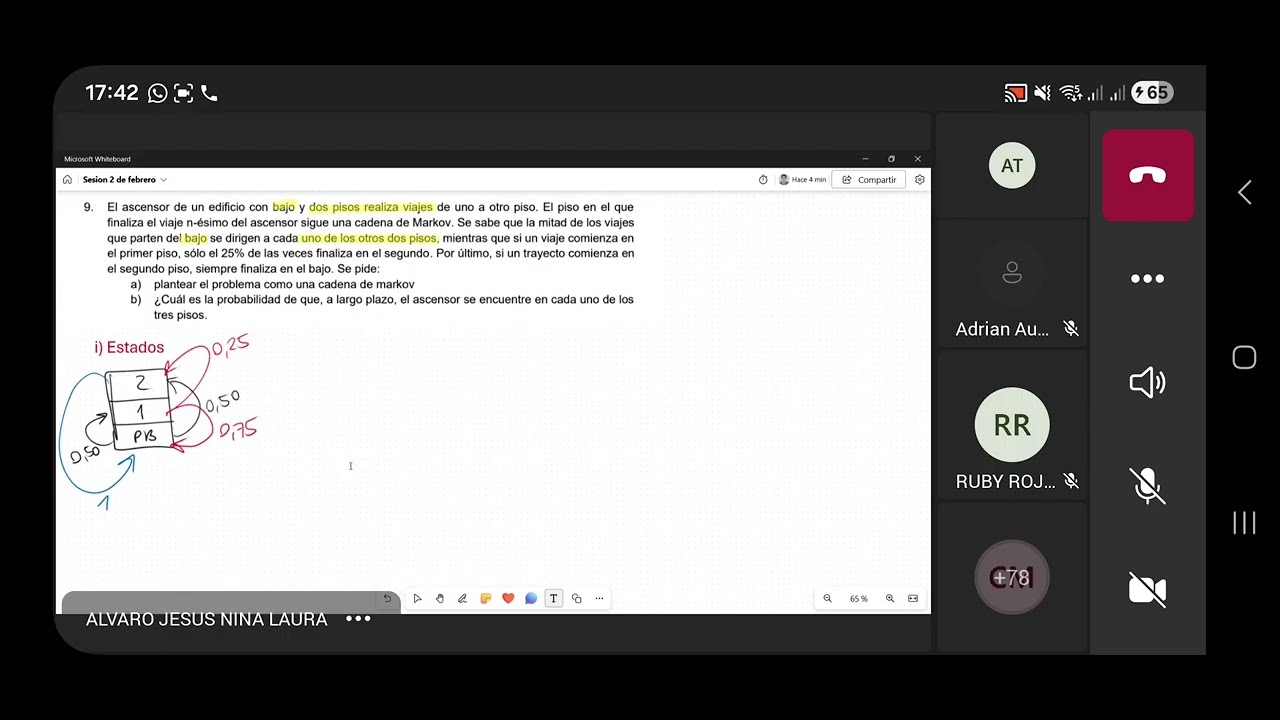
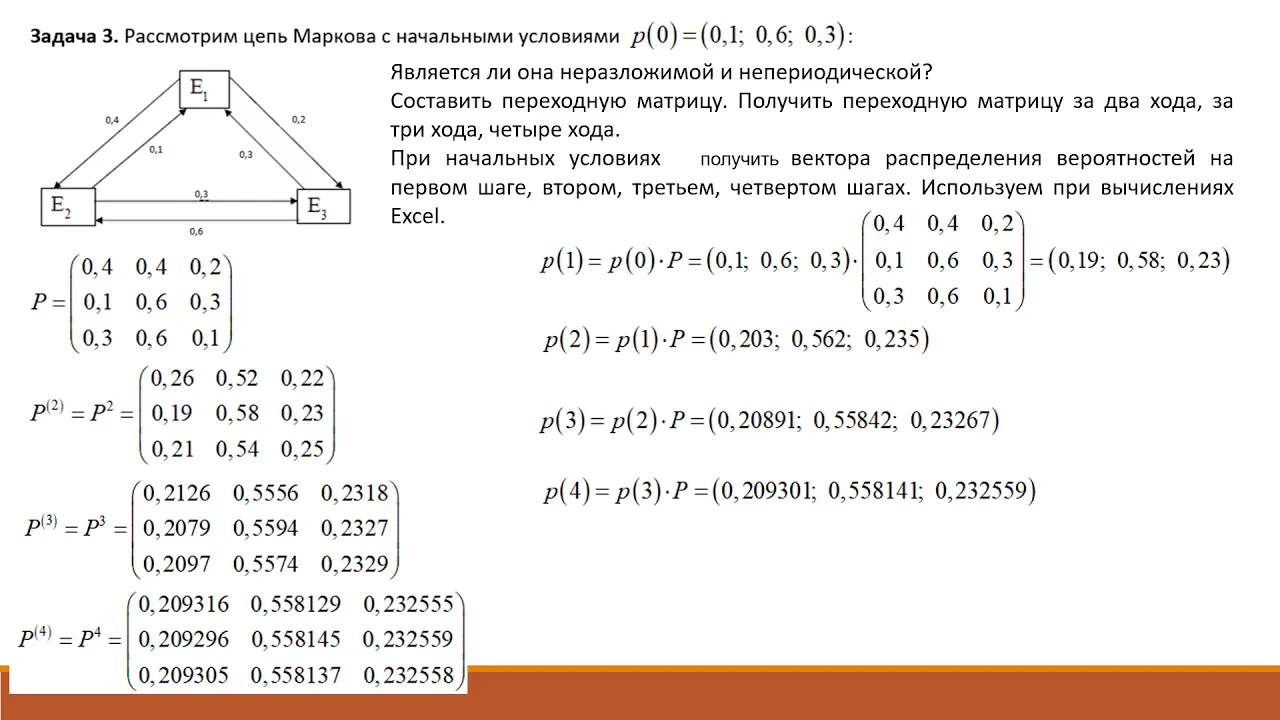
Elementary Markov chain theory, understanding states, transition probabilities, stationary distributions, and ergodicity.
Advanced MCMC variants, such as Hamiltonian Monte Carlo (HMC) and the No-U-Turn Sampler (NUTS), which power modern probabilistic programming.
Hands-on implementation of Bayesian models using probabilistic programming languages (PPLs) like PyMC, Stan, or Turing.jl.
Variational Inference (VI) as a faster, optimization-based alternative to MCMC for scaling Bayesian inference to massive datasets.
Applying MCMC to complex, high-dimensional statistical problems, such as Bayesian Hierarchical Modeling and Gaussian Processes.
6.6K views201likes25:02Original Release: 2024-04-03
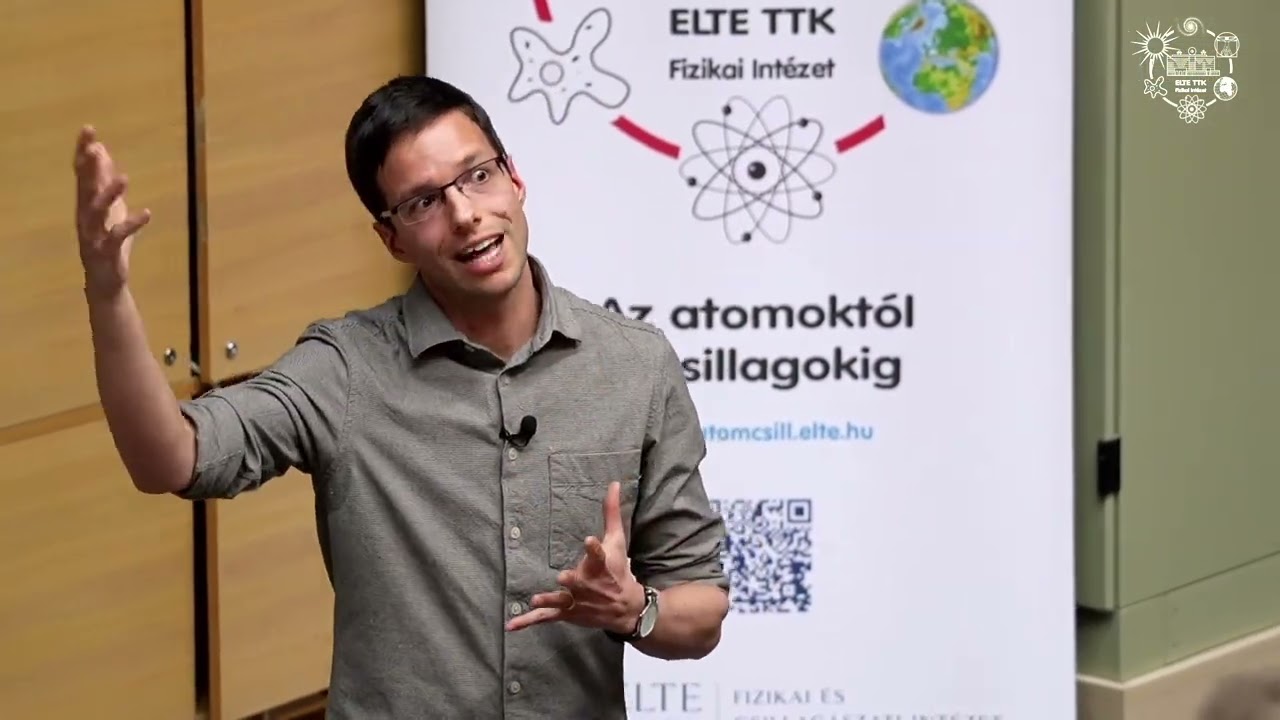
now we're going to move on to our next speaker so I'm really delighted to introduce Ben Lambert who is a researcher at Oxford University uh he has a brilliant book a students guide to basy and statistics which I know has quite some following along with his YouTube channel so uh Ben can I hand over to you sure thanks very much for the uh very nice introduction and for the invitation to speak today uh Elenor uh so um I'm just gonna try I know we sort of did this before the call I just want to double check that that this sort of my screen sharing is working okay um you seeing my full screen and is it kind of changing when I press the button I can see your screen at the moment is not changing slide it's not full screen but it's not in full screen mode yeah ah okay should have tried this earlier I might have to just present on the small screen which just fine um okay let's try this so hold on let me just try this hold on is that changing slide is yeah okay sorry it's not not entirely optimal but there we go anyway so um yeah thanks again for the invitation to speak today and I thought it's it's really good that Mark is I really enjoyed Mark's plots you showed at the beginning about the growing popularity of Basi and stats and yeah I completely agree that one of the main reasons behind that is is um the uptake of of methods that we used to um do applied basing stats in practice particularly marov CH Monte Carlo and that's really what I'm going to talk to you about today um so I guess from my own Reflections on teaching um some things I found over the years um is that when I when I teach basing stats I think that sometimes there's a poor understanding of of why um we actually need um to do mcmc um more broadly what does kind of sampling mean and how it helps you um some people I I think because of the fact that we have access to pseudo random number generation from statistical software that we Ed for example in r or python people just think that you can just do sampling for any distribution trivially and so people don't understand that um you have to have some methodology for doing so um I think the that people don't understand what the difference is between sort of independent sampling independent sampling which underpins mcmc um also uh how some of the main methods of mcmc work particularly the random W Metropolis algorithm the oldest mcmc algorithm um uh developed in the 1950s and then finally I think that quite a practical thing is people don't understand why um measuring convergence of mcmc is is difficult why it's necessary and how you do it um I'm not going to cover all of these things today because there are too many things I'm going to focus on just three of these um which is um how I teach what sampling means and how it helps you um the difference between independent and dependent sampling and how you can quantify that difference and also um why measuring convergence is hard and I suppose necessary and how um we can do it and uh just to for warn I'm a bit of a fan of an animation and so throughout this talk there's going to be lots of animations um but before we get to those uh animations I guess I don't really need to reiterate this too much because Mark's already done my work for me um but yeah the reason we need mcmc is that if we go to Bases rule for inference um then we have this denominator term P of X um which typically to compute it involves either kind of a multi-dimensional integral Andor sum that is just too hard to do in practice um and instead what we do is we try and summarize the posterior distribution by drawing samples from it and the most predominant method used um is Markov chain Monte Carlo for drawing those samples and popular software like Stan as Mark mentioned use mcmc to to fit bayyan models but before before we get to what mcmc is we need to sort of understand well why does sampling from something help us to to characterize it so if we start off I'm going to start off by by discussing what is meant by independent sampling so imagine that we've got a large n that's filled with colored balls and we've got a number of colors and frequencies of each which are unknown the question is you know how can we determine the underlying probability distribution of ball color well it will come as no surprise to to people on this call that one way in which you can do that even if you don't know the number of bulls nor the frequencies of these is you can just draw lots and lots of blls from the NN and uh if the NN is big enough then basically the the samples that you draw end up being um independent and we see here that after I've drawn 100 samples from this distribution that actually we're getting sort of some sort of convergence in the probability distribution here over the underlying um distribution of ball color so here yeah drawing one ball from the NN is the act of taking a single sample and um if you imagine the N is is kind of large and perhaps the balls are swishing around then drawing samples from this n uh is is doing independent sampling and we've seen that it gives us a very efficient way of gaining insight into the probability distribution of bull color the question is can you also do this for continuous um characteristics so now imagine that we've got an n filled with balls of different sizes the distribution over those size of balls is is unknown can we use the same method to characterize the underlying probability distribution and of course the answer is yes if I draw enough Bulls from my NN then and if I draw a histogram of the underlying uh frequencies of the blls with different sizes then after I draw a sufficient number of bulls from the NN then I get some sort of convergence towards a probability distribution here prob haven't drawn quite enough blls I know here computationally I was drawing from a normal distribution but over time I eventually get some sort of convergence so I'm understanding the distribution by sampling from it here so what do we take from this we take that independent sampling provides a a a very good way of characterizing a probability distribution and it's it's quite efficient and by efficient I mean I need to draw relatively few samples from that distribution to be able to characterize its properties quite nicely now I'm going to talk about what we actually do in practice so generally uh and by practice I mean in doing applied basing inference because generally when you do basing inference you can't actually draw independent samples from the posterior distribution however you can do something called dependent sampling and and dependent sampling just means that the next draw that we make depends on the current value you and Markov chain Monte Carlo is the most commonly used form of dependent sampling so now I'm going to use an analogy um to try and explain some similarities and some differences between independent sampling and dependent sampling that I found useful when I've been teaching marov chain Mony Carlo um and the example I'm going to give here is is a dice a single dice I used to say a single die but I actually I worked out that you can say a single dice that's fine so now I just say a single Dice and which is a bit confusing because I've got a picture of two dice here but anyway and a standard dice has got six faces all of which are equally likely to be obtained on a given throw and we can represent a standard dice or here written die unhelpfully um by a kind of Markoff State and transition diagram where the width of the arrows between representing transitions between the different states are all of the same width indicating the same probability I'm now going to introduce a D die that has um dependence in it so we're going to introduce a Marone a maravian dice where we suppose that when I throw the dice I can only go from uh a given number to consecutive numbers so from one I can either go to two or I can go to six each with probability a half from two I can go to three or or or to one again with equal probability of half and we see that this dice um has has dependence in it where the next value we obtain from throwing the dice depends on the current value however it has the same unconditional distribution IE across all throws as the independent dice so it's got the same meane so we can represent a markovian dice by this Markov um transition di diagram and now this makes clear that I can only go between consecutive numbers so the question is which of these two dices uh dice is is better um and provides us with a more efficient way of estimating the mean of the distribution well the answer is what we do is we just kind of throw the dice and we see how well we do so on the left here I've got my Markov transition diagram for my marov die and uh I'm indicating by blue dark blue the the the current value of the dice and on the right here I'm going to show the running mean over time and the orange line here represents the true mean of this distribution and what we find here is that as I throw the dice more uh I get a running mean a sample mean which is getting closer and closer to the um true underlying mean of the dice but it's taking quite a long time to get there after 50 throws we still see that we are quite a long way away from the true uh underlying mean of this distribution by contrast when I go with the independent dice then what we find here is that my current value of the dice jumps around a lot more efficiently and so I get a much sort of quicker convergence towards the um sampling towards the population mean of this distribution and so what we find here is that an independent dice provides a more efficient way of trying to characterize a distribution than a dependent um than the dependent case and we can actually represent that relative inefficiency of dependent sampling by a concept which is known as effective sample size um and so we basically quantify um the effective sample size uh we quantify the performance of a dependent sampling algorithm by this concept which is called effective sample size which is considering a given number of iterations of a dependent sampler it is the equivalent number of samples from an independent sampler which we regard as a kind of gold standard way of finding out about our distribution and the quality of a dependent sampler depends on the level of dependence um the more dependence we have then the greater the Gap there is between an independent sampler and a one that has dependence and so what we find is in the calculations for for calculating the effective sample size in mcmc is that as the level of dependence goes up the effective sample science goes down I'm now going to finish off by discussing um mcmc convergence um and as I said I I think this is a concept that has both theoretical and practical um implications of understanding it so I I'll dwell on this a little bit um but just to give you a little bit of a um runin uh I'm going to start off by saying you know why why do we actually need to model um convergence of Markov chains um and if we go back to the the actual steps of the random W Metropolis algorithm then what happens is that you start off with some sort of arbitrary starting position um which has been generated from some arbitrary proposal distribution which by by definition often isn't the it usually isn't the posterior distribution and then for a range of iterations we then propose a new location using some sort of J jumping kernel here I'm using a symmetric jump in kernel and then we either accept or reject a move based on the ratio of the proposed likelihood times the prior divided through by the current likelihood times the prior and if that is above some uh some number U which has been drawn from a uniform distribution between Z and one then we accept that location otherwise we remain where we were in the in the next step but why do we actually need to model convergence in the first place well the point is that we start off with this initial proposal distrib distribution which isn't actually equal to the posterior distribution and then we repeatedly take steps using this Metropolis except reject Rule and that gives us a sampling distribution as a function of time and under quite a general set of assumptions we're guaranteed that ASM totically the sampling distribution should converge to the posterior distribution but in practice we don't we can't wait an ASM totic amount of time we only have a finite number of samples and so I guess the question is when practic can we assume that the sampling distribution generated by our sampling algorithm is a good approximation to our posterior distribution and one answer to this is to monitor convergence of a single Mark of chain to a stationary distribution and we can imagine doing this and we can ask the question is there a problem in doing that and to explain this I'm going to use an analogy that I actually got from Bob Carpenter um as many of you will know is is one of the the key kind of uh memb of the stand development team um and in this sort of thought experiment we're going to imagine that we've got a house of unknown shape and we've got an unlimited supply of bees each equipped with a GPS tracker allowing us to accurately monitor the bees position and the question is can we use these these bees and their their positions over time to estimate the shape of a house so what we can do is we can release one B at say a random location in the house and then we can monit monitor its path over time and we stop or we collect the B after it summary measures of its path sto changing over time so we can actually do this and so I've got my be here and I'm going to release it in in the house and what we find here is that uh we leave our B for a certain period of time and we think oh I've clearly left the be for long enough now and that must be the shape of the house but then I go and I talk to some sort of colleagues and they say well no typically when I when I release my be I I sort of leave it for longer than that and so you go back and begrudgingly you let your be go again from the same location and you think well that they're probably talking nonsense oh and then the bee goes into a completely new area of the house and you can clearly see that the shape of the house wasn't what you thought it was previously and then you go and you speak to your colleagues again and again they say well that still doesn't seem long enough that you've left your be there and so you sort of release your be and you wait um even longer and uh to your utter surprise uh eventually the bee goes into an entirely new area of the house and so clearly the amount of time we' waited previously wasn't sufficient to determine the outline of the house so you can ask the question well what's the actual shape of the house and uh this is the actual shape of the house here that that I sort of computationally generated you'll see that the bee hops across between corridors here at certain points in time that was sort of imperfection in the way in which I've done this but but yeah you can see that I've concocted quite a weird kind of example here but you can see the direct analogy between trying to work out the shape of this house and trying to explore a posterior distribution where you might have isolated modes or different parts of the distribution that are hard to um access so clearly monitoring convergence of of you know B's or your marov chains um if you use only a single b or a single Mark of chain it's very susceptible to the curse of hindsight you can say well now we've definitely converged to the posterior but we hadn't done a minute ago and that's particularly the case because chains often get stuck in sub regions of of parameter space so what's the solution to this well what you can do is you can release lots of bees that disperse locations in parameter space and effectively you can stop recording When an individual bees path is indistinguishable from all others so here I release my bees uh at disperate locations in the house and here clearly because the the bee's paths are largely non overlapping with one another I know I need to wait longer and so if I wait a lot longer then what we find here is that um the bees paths all kind of overlap with one another I probably still needed to let my bees go for longer such that all of the colors were homogenous here but you get the idea is that releasing multiple bees or using multiple Markov chains um from randomly dispersed locations or over dispersed locations in parameter space is generally a better idea um but you can see from the way in which I've hopefully introduced this that this is again not a foolproof idea um you can still have areas of high probability mass that you're just going to miss from doing this however the more kind of chains you have then um the greater um well the lower the chance you have of actually missing something um that's important so you know all else being equal I would say you know you could always have more chains um if you I suppose it's a bit of a trade-off between that and computational time so in conclusion um from from what I was just presenting on um sampling and more generally mcmc I found in my experience to be fairly poorly understood uh and it actually has a lot of practical implications um because our main tools for doing apply basing inference these days it revolve around mcmc and knowing some of the details underneath those I found to be critically important particularly mcmc convergence um and what I've found as well is that animations can certainly help with the story um and so I I'll sort of finish off um just by thanking Mark Elanor oh said I've thank Mark twice here um and which I think is probably about uh about right in terms of the amount of effort going into uh into organizing this from what I understand um but yeah I'll finish off with that and I'll leave you here with a kind of weird um uh sort of image or video that I generated um for doing a random W Metropolis on the surface of a Triceratops which I I had to do for my uh for my college here in Oxford which uh has a kind of focus on dinosaurs and I thought well i' do the intersection of of dinosaurs and mcmc anyway all right well thanks everyone and uh yeah I'll take any questions thanks very much ben those animations were really really great um so there are many questions in the chat for you and they are coming in thick and fast so um depending on whether you want to have a quick scan and choose some to answer yourself which might be an easier option there is the um just one uh on on so so the Q&A were you referring to the Q&A elener or the chat the Q&A let's stick to the Q&A yeah yes sure yeah you should be able to see them Ben yeah I'm just having a look through now [Music] uh so G no no no you you you you start off sure I so one of the questions is um do you have real world examples where where a posterior distribution is not unimodal and simple like a normal but complicated and therefore difficult to fully explore by mcmc especially if you've only got one chain yeah I mean often in so I work in an area of of of um Science computational Biology and the models that we have there are often highly nonlinear um sort of differential equation based models and and differential equation based models are great they've been highly successful Across The Sciences is um because you can express a lot of complexity in a relatively small model um but that complexity is also a curse when it comes to doing sort of inverse um you know thinking inversely about what parameters cause my data because you can often have particularly if you don't have that much data um you can have um very disperate parameter sets causing the same data and that's particularly the case if you've got a system that's got um periodicities in it so if you have lots of like cyclic behaviors in the data and you don't have that much data then in theory you sort of your posterior can um be quite um quite degenerate because you can have a given frequency or twice that frequency say also generating a data so that's you know an example where we do find that for sure hey thanks for that um right mej pick out another question for you so um a question about thinning and whether you would specifically mention thinning and perhaps how you would go about that and to sort of motivation for it yeah it's a good question I amum I'm I'm not an expert in thinning I know a lot of people have thought quite carefully about the optimal ways in which one can thin um Markov chains um I guess my sight synthesism is I've I've always found the choice of thinning to be often a practical one which is that I don't want to hold all of this data um representing all of my posterior samples on my machine or on a cluster or whatever just because I've got lots of parameters and often it's just pragmatically set um to to um to to minimize that that kind of footprint I found because I mean ultimately there's no real benefit to thinning because you lose information by thinning um it's just a case of you know um you don't want to necessarily um hold on to all of these posterior draws so sorry I don't really have anything that useful to say other than I've not found it to be too difficult a choice for me practically perhaps I'll end on a couple of compliments that have that I've come through um one is um mcmc is misunderstood and uh someone likes the animations and that we should be using more animation and I completely agree with that to to demonstrate it and another request for you um is that you continue releasing videos for the students guide to basian statistics book and uh book and the videos are awesome so there you go that's very kind um yeah I mean it's actually it's one of my sort of New Year's resolutions almost is to continue making lots of videos because you know I do research but I continually think that perhaps the videos are as useful for people as as the research that I do and so I um yeah I'm at the moment I'm working on so an area that I did think about talking about today but I thought perhaps not um was the area of Bas and nonparametrics um so specifically talking about dislay processes and and lots of the other kind of exotic basian processes that are now sort of starting to be used by the by the community a bit more and that's something that I'm actively working on at the moment is trying to produce some material on that so yeah so I'm thinking about it for sure brilliant thank you ever so much Ben
Up Next

18:15
Metropolis-Hastings Algorithm: MCMC Sampling Explained Simply
@ritvikmath
138.8K views•2021-01-25

4:43
Elliptic Curve Cryptography Explained: ECC, ECDSA, ECDH
@PracticalNetworking
28.5K views•2024-10-21

10:44
Fourier Series Introduction: The Big Idea Explained
@DrTrefor
387K views•2021-05-03

6:00
The Mathematical Impossibility of Accurate World Maps
@Vox
23.3M views•2016-12-02
Related Study Plans & Knowledge Roadmaps
Structured learning paths in Mathematics
mathematics
Tensor Calculus: Vectors to Riemann Curvature
01Mathematical Foundations: Linear Algebra & Calculus
02Covectors, Dual Spaces, and Tensor Basics
03The Metric Tensor and Index Gymnastics
+ 2 more learning modules
40h5 modules
Explore Roadmap
mathematics
Gödel's Incompleteness: Logic, Proofs & Limits
01Introduction to Formal Systems & Hilbert's Dream
02Set Theory, Cardinality, and Cantor's Diagonal Argument
03Arithmetization and Gödel Numbering
+ 2 more learning modules
14h5 modules
Explore Roadmap
mathematics
Galois Theory: Fields, Groups & Solvability
01Foundations of Abstract Algebra: Groups & Fields
02Polynomials & Field Extensions
03Splitting Fields & Symmetries
+ 2 more learning modules
24h5 modules
Explore Roadmap
mathematics
Non-Euclidean Geometry: Models & Geodesics
01Euclid's Fifth Postulate and the Birth of New Geometries
02Hyperbolic Space and the Poincaré Disk Model
03Geodesics: Defining Straight Lines in Curved Spaces
+ 2 more learning modules
15h5 modules
Explore Roadmap