











Conservation corridors are essential for maintaining biodiversity in fragmented landscapes, and Linkage Mapper is a GIS tool that identifies least-cost paths between habitat patches by analyzing friction of distance (how difficult it is for species to move across different land cover types), pinch points (areas of most congested routes), and barriers, enabling conservationists to prioritize linkages based on biological importance and threat levels while considering all stakeholders for successful implementation.
Planning Conservation Corridors with Linkage Mapper in GIS
Added:Fundamental proficiency in Geographic Information Systems (GIS), including raster data manipulation, spatial analysis tools, and coordinate system management.
Core concepts of landscape ecology, specifically habitat fragmentation, edge effects, core habitat patches, and the ecological importance of structural connectivity.
Basic understanding of cost-distance modeling, including how to define and construct resistance (friction) surfaces based on land cover and species preferences.
Familiarity with biodiversity conservation theory, including metapopulation dynamics, gene flow, and the impacts of habitat isolation on species survival.
Advanced connectivity modeling using Circuitscape to analyze ecological 'pinch points' and bottlenecks where corridor movement is highly constrained.
Incorporating climate change projections into corridor design, such as mapping temperature gradients and climate velocity to allow for future species range shifts.
Methods for field-validating GIS models (ground-truthing) using empirical biological data, such as GPS wildlife telemetry, genetic connectivity studies, or camera trap networks.
Integrating conservation corridor maps into regional land-use planning, zoning policies, environmental impact assessments, and real-world land acquisition strategies.
3.4K views52likes15:15Original Release: 2017-05-01
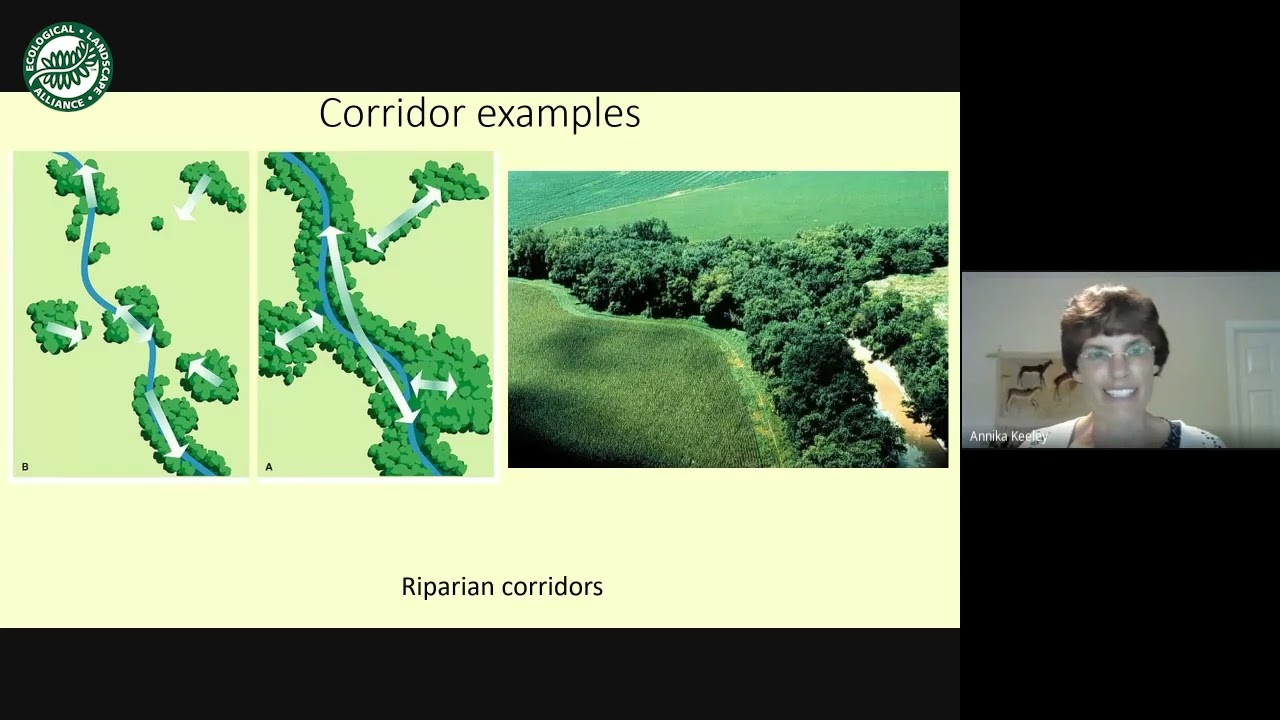
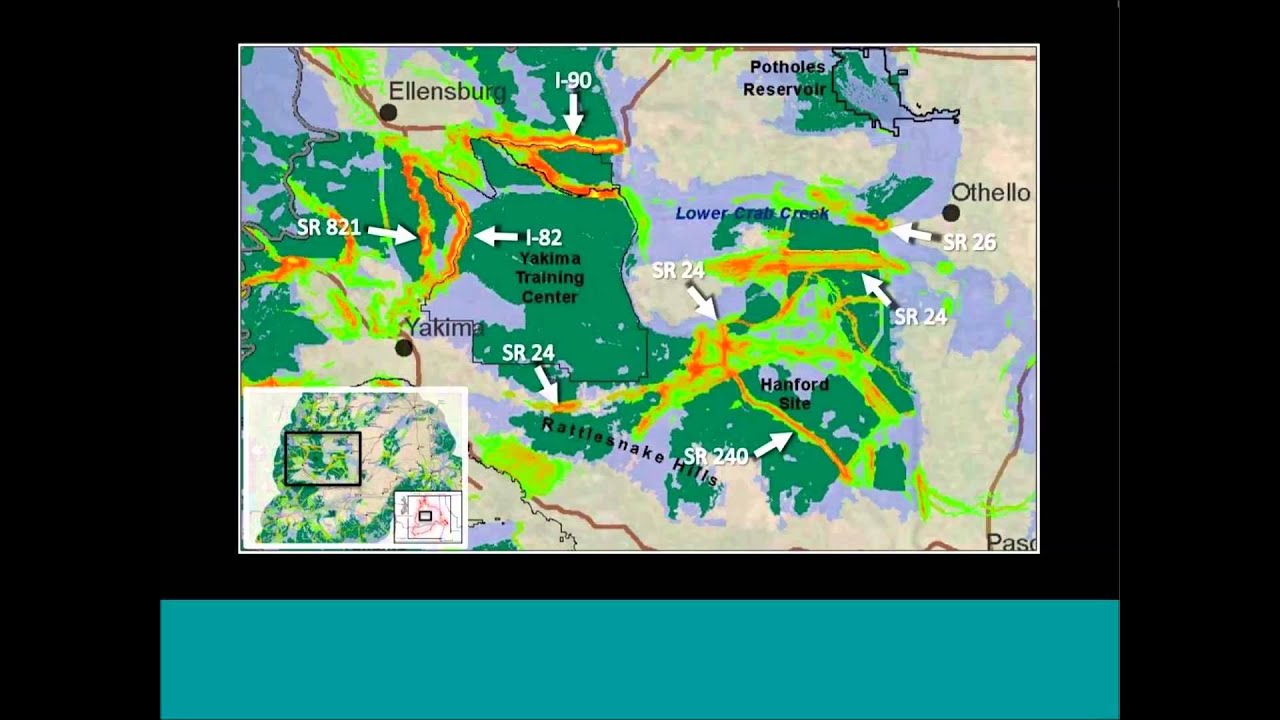
hi i'm alex nasser and i'm tom ready and today we're going to be looking at planning for conservation corridors best practices using linkage map in minnesota here is a quick outline of our presentation today first we are going to be looking at background information on biodiversity connectivity and corridors we will also show you linkage mapper which is our demonstration of our bees and context and finally we will show you a real-world application of linkage mapper so why does this matter there's an extinction crisis with climate change and human land-use patterns and therefore a need for habitat corridors to maintain biodiversity here is our first background slide so we are going to define what is biodiversity and according to James McLaren and Kim Stanley biodiversity is a blend of the words biological and diversity biodiversity is species richness so where you are able to find the species the larger stretched biodiversity our habitat destruction and fragmentation basically where you have no connectivity in habitats of lands there's going to be no biodiversity connectivity is defined as the degree of movement of organisms or processes in Kevin our croaks book entitled connectivity conservation maintaining connections for nature Creek states that wherever there is movement of species there's connectivity structural connectivity is how landscapes are arranged in the habitat functional connectivity is the behavior responses of species to the landscape connectivity is important role in conservation because the opposite of connectivity is fragmentation which is a major cause of habitat loss connectivity is also important in conservation efforts because that's we're able to connect the lands and as we will see in the next slide that those species are able to repopulate now we'd like to briefly introduce you to the two laws of Island biogeography the first is at larger islands of habitat foster more biodiversity as opposed to smaller islands of habitat the second law is that islands closer together around culture of the mainland will foster more biodiversity an Allen a habitat doesn't necessarily need to be in island in the general sense it can be a lake a rooftop or mountaintop or any sort of other type of ecosystem now we'd like to introduce you to corridor design dr. Paul Beier has been working with corridor design for the better part of two decades and he's laid out four guidelines the first is that it's better to work for connectivity than against fragmentation fighting fragmentation development proposals is not a strategy for success a success might stop one bad project but the following year another devastating proposal on the same piece of land could come about moving moving beyond reacting to bad proposals and putting forth positive ones such as linkage designs is crucial second it is important to consider all entities with stakes in the proposed lands to be most productive the scientist who wants to be a conservationist must invite managers and non scientists to participate in the work land management agencies conservation NGOs Native American tribes and other entities must always have their input in proposals or the project won't gain any traction third buyer looks at the importance of diversity and focal species because large carnivores such as bears and wolves live in low densities and are among the first to be harmed by the loss of connectivity they are appropriate focal species for linkage design but are studied quite often many other species such as bees which we'll consider in a bit need linkage linkages to maintain Jann addictive diversity and population stability and must be considered for an adequate linkage design will be comprehensive an adequate linkage design will recommend crossing structures and management practices to restore native areas and minimize the impact of exotic species fences artificial lighting and so forth the linkage design must address how landowners living in or in adjacent areas will become stewards of the linkage design buyer also goes on to identify potential linkages and how to prioritize these potential linkages a potential linkage is an area connectivity between wildlife areas is at risk essential languages can be ranked in two dimensions namely biological importance and threat and opportunity linkages with high rankings in both dimensions becomes the highest priority for developing and implementing Lincoln's conservation designs in terms of biological importance if the linkage is lost which species would become extinct or have a significantly greater risk of extinction which species might persist but in such small numbers that they could be ecologically irrelevant how much degradation would occur in ecosystem processes such as top-down control a large carnivores gene flow recon ization active disturbance seasonal migration energy certificate competition in evolution also regarding the threat an opportunity a potential linkage can also be more important because it is at a greater risk of being irreversibly lost if we do not consider it immediately because conservationists must be opportunistic we also want to give higher priority linkages to those if there's an active effort going already and so forth now we'd like to introduce you to linkage mapper which is the bulk of our project linkage mapper is a GIS tool designed to support regional wildlife habitat connectivity analysis it can be downloaded at circuits Georg table uses mapped areas of core habitats which is vector data that needs to be received from the field it also uses resistances to identify and map linkages between them the resistance is taken to consideration land cover and friction of distance friction of distance is how difficult it is for species to get from point A to point-p the tool then identifies adjacent core areas and creates maps of least-cost corridors between them and finally mosaics individual corridors to create a single composite corridor map now we will identify the GIS and linkage mapper tools that we use in our research and demonstration in GIS we identified study areas which are areas of potential or future conservation efforts normally located in around remnant prairies the friction of distance layer saves how hard it is for species to move from point A to point B in linkage mapper we identified Network and map linkages which are how which how our areas are connected both based on friction or distance and the centroids of each habitat in pinch point never we identified pinch points or areas of most congested routes finally in Bari remember we identified the barriers and how wide these barriers are now we'd like to give you some background information on bees native bee species are concentrated in remnant prairies in western Minnesota these study areas will be the focal point of this demonstration because they are future targets of conservation these study areas were determined by a PhD student at the University of Minnesota Ian Lane linkage mapper will then be utilized for potential B corridors in Clay Becker Otter Tail County these are our study areas that we have identified as you can see mostly located in Clay County our study areas were chosen because of their size and proximity and are identified on the map on the left I'm a map on the right we overlaid study areas with friction of distance and as you can see the red areas are a high friction distance high friction of distance may mean that a road lake or densely populated force makes it hard for species across between a habitat in the green areas that are low friction distance which basically means that species are able to move freely between the habit now we'd like to make note of our friction a distance colorramp change intuitively we had the friction ramp from red to green because red is typically bad and Green is good and red was a high friction distance and green was a low friction distance but when we get the outputs of linkage mapper it's hard to see so we change it to greyscale so on the right the gray the dark gray is high friction distance and the light gray is low friction distance here's our example linkage mapper first you must download linkage mapper into arctoolbox then you can open the dialog box it first looks for a project directory so we created a folder in the C Drive we name this folder a I then ask for a core area feature class and we used our study areas then asks for our core area field name and we used easement I use Menai identifies conservation easements conservation easement in his agreement between a landowner and the government to set aside land for conservation finally a friction raster was used for the resistance raster here's the first output of linkage mapper it's the sticks linkage mapper sticks simply link each study area from the centroids they don't take into consideration friction of distance here's the second output of linkage member the least cost paths the least cost paths follow the trend of the lowest friction of distance which is the lighter gray areas even in areas of the darker gray you can see that the lines stay on a path where there is less friction a distance next tool we used was pinch point mapper pinch point mapper is a subset of the linkage mapper tool kit for the project directory again we used the C Drive and a folder for the core area feature class V study area for the core area field name we used easement I for the resistance raster we use friction and for the cutoff distance we use ten thousand meters we got ten thousand meters through a little bit of trial and error lower numbers can give us many new outputs whereas larger numbers give us outputs that didn't seem fit for beads the output from pinch point mapper is seen on the right high quality pinch points are in the light yellow color these directly link up with the least-cost paths on the Left darker areas in orange and red are lower quality pinch points we can expect to see some bee traffic here but it's not as much as we'd see in the lighter areas next we will demonstrate berry mapper again we're going to use a folder on the C Drive and for a resistance raster we use a friction of distance for our minimum detection radius we'll use 250 meters and for our maximum detection radius we'll use 1000 meters again these parameters were chosen based on trial and error analysis for a radius step value we are going to use zero because we want to calculate only one radius across the corridors after running barrier mapper these are our results the map on the Left shows that in those red areas that's where more berries are found and in the green areas less barriers are fell in there the map on the right we overlaid LCPs with our berry map results in the top left you can see that bees do not need that wide of a corridor because there is an LC P line found a less barrier area now we'd like to highlight a success story on connectivity planning to address climate change by Tristan a Nunez at all as the climate changes connectivity between areas of different temperatures could allow organisms to move along temperature gradients and allow species to continue to occupy the same temperature space in the past species moved great distances relatively unemployed given the rate of projected future climate change it is likely that species will need to move further in the 21st century and they may encounter substantial anthropogenic barriers that were not present in the past maintaining connectivity is the most frequently recommended strategy for conservation species using linkage mapper and the special tool of concerning temperature tristan a Nunez found a gradient corridor it takes into consideration this temperature he went against the standard corridor that fails to look at temperature species do need to stay in the same temperature gradients for them to survive and this is cutting edge research that will be needed to be looked at in the future after we showed you a really cool tool as well as a real-world application we now want to finish with our conclusions it's critical to insert ourselves into a situation and involve all parties for best conservation outcomes we talked about this earlier in the presentation and that you need all people coming together with different stakes in the area for the best possible conservation outcome we also must consider various focal species and the comprehensiveness of the linkage design we use the linkage mapper as our focal species and demonstrated connectivity to show least cost paths the importance of using linkage rapper in the future is able to solve the issues of extinction and habitat loss in the age of anthropogenic land use and climate change for future research we can explore ways to link study areas and remnant prairies in western Minnesota we can also determine a plan with all entities stakes in that area finally we can use a linkage mapper speed of tools with different parameters to demonstrate connectivity here is the data we used here's our bibliography and you
Up Next
123:25
Wildlife Habitat Connectivity Modeling with Maxent & Circuitscape
@DevelopmentAsia
4.8K views•2021-07-14

15:54
Life in Biosphere 2: Sustainable Ecosystems & Human Survival
@TED
334.9K views•2009-06-16
14:30
Microplastics Everywhere: How Plastic Impacts Our Lives
@TEDx
100.9K views•2018-05-08
10:28
Ice Stupa Artificial Glaciers: Solving Ladakh's Water Crisis
@SonamWangchuk66
3.2M views•2015-05-03
Related Study Plans & Knowledge Roadmaps
Structured learning paths in Environmental Science
environmental-science
Ocean Noise: Cetacean Impacts & Mitigation
01Fundamentals of Underwater Acoustics
02Marine Mammal Bioacoustics
03Anthropogenic Noise: Shipping & Seismic Surveying
+ 2 more learning modules
16h5 modules
Explore Roadmap
environmental-science
Road Ecology: Corridors, Overpasses & Fencing
01Foundations of Habitat Fragmentation and Carnivore Ecology
02The Road Barrier: Ecological Impacts of Transport Infrastructure
03Principles of Ecological Corridors and Connectivity Mapping
+ 3 more learning modules
14h6 modules
Explore Roadmap
environmental-science
Ocean Acidification: Kelp Buffering & Shellfish
01Fundamentals of Ocean Chemistry & pH
02Chemical Pathways of Coastal Acidification
03Bivalve Physiology & Calcification Under Stress
+ 2 more learning modules
18h5 modules
Explore Roadmap
environmental-science
Ice Stupas: Glacial Retreat & Water Security
01Foundations of Glaciology & Mountain Hydrology
02Climate Change and Glacial Retreat Dynamics
03The Science of Ice Stupas & Artificial Glaciers
+ 2 more learning modules
14h5 modules
Explore Roadmap