



![[필에코의 자연환경관리기술사] 91.036 경관생태학3](https://i.ytimg.com/vi/TKXfnqpX0J8/maxresdefault.jpg)














This webinar demonstrates how to use Maxent software to model habitat suitability by establishing relationships between species occurrence data and environmental variables (such as altitude, land use, hydrology, and human disturbance), and Circuitscape to analyze habitat connectivity by applying circuit theory to identify potential wildlife movement corridors and optimal locations for mitigation measures like wildlife crossings.
Wildlife Habitat Connectivity Modeling with Maxent & Circuitscape
Added:Fundamentals of Geographic Information Systems (GIS), including working with raster datasets, ASCII grid formats, and spatial coordinate systems.
Basic concepts of Landscape Ecology, specifically habitat fragmentation, core habitat patches, and the difference between structural and functional connectivity.
Principles of Species Distribution Modeling (SDM), particularly how environmental covariates (like elevation, land cover, and distance to water) are used to predict habitat suitability.
The theoretical foundation of Electrical Circuit Theory as applied to ecology, where landscapes are treated as conductive surfaces and wildlife movement is modeled as electrical current.
Advanced omnidirectional connectivity modeling using Omniscape to analyze movement without pre-defined source and destination points.
Field validation techniques, such as using GPS telemetry collar data or camera trap arrays to ground-truth modeled wildlife corridors.
Landscape Genetics, integrating genetic flow data of target populations to empirically validate and refine resistance surfaces.
Applied Road Ecology engineering, including the systematic selection and design of wildlife crossings (overpasses and underpasses) and fencing based on connectivity maps.
4.8K views84likes2:03:25Original Release: 2021-07-14
okay um good morning good afternoon good evening everybody welcome to this webinar on the modern road ecologist toolbox uh this is module three my name is karma yang zhong and i am the principal environment specialist in the sustainable development and climate change department of adb and i will be moderating the webinar today so uh before we begin we will have some opening remarks from mr hirawaki yamaguchi we can call him hero he's the director of the transport and communication division in the southeast asia department of adb and in short form we call it setc a hiro has 25 years of experience in transport policy planning and engineering both in public and private sector which includes 17 years with adb in south asia and southeast asia so he's been the director of setc since 2017 and before that he was the director of the south asia transport and communication division that's where i was before and he was my director before uh so he was the director of satc before as the director hero oversees transport and communications operations where he ensures project delivery covering various transport sub-sectors together with improved contract awards and disbursement before becoming director hiro was with the south asia department uh serving as a mission leader for transport infrastructure projects and also as the head of the project administration unit mr yamaguchi our hero also contributed to the adb wide reform initiatives as a task force member of the procurement reform task force and the strategy 2030 midterm review working group prior to joining adb he worked as a consultant for the transport planning projects in southeast asian countries australia and japan including ppp projects and with public transport agencies on bus and railway planning projects in australia so over to your hero to please deliver the opening remarks okay uh thank you very much karma uh good afternoon a very warm welcome to everyone attending this third and final module on the modern road ecologist toolbox it is great to be part of this training today i was informed that this series of training is about changing the narrative from transport at the cost of nature to transport for the nature and was invited to share some views about the changing design approaches for linear infrastructure this mainly refers to road and rail projects as we know a road and rail projects cover long distances and across various administrative and natural boundaries it is a well-known fact that social and environmental safeguards play a critical role in making or breaking these project types of projects especially where there are social resettlement issues or environmentally sensitive or protected areas involved i remember in my earlier transport projects also data collection processing and analysis was a tedious process often we relied on physical labor and manual paper-based records sharing of data across project teams was much more challenging requiring physical exchange of information which is also time consuming project planning and design can also be tricky at times due to difficulties in mapping information on critical habitats making it challenging to develop alignments to satisfactorily mitigate environmental impacts okay now fast forward to today we are in a different world from the last decades prior to the pandemic we did see advanced technologies already being increasingly deployed in transport infrastructure but in the past year even though the pandemic has severely disrupted transport systems through lockdowns and restricted movements we have also witnessed unprecedented acceleration on the uptake of technology for example we are deploying drones to overcome manpower challenges to road and rail projects in south east and south asia smart port solutions in the pacific region adb is also piloting high-level technology solutions to tackle safety and security challenges on connectivity the significant advancements in technology and availability of these resources at the much lower cost of today present a real game changer to the way we can design and deliver projects it is great to know about the highly innovative ideas that were shared in the earlier modules on data collection and the presentation using online resources apps and web-based platforms enabling smooth and efficient data sharing and analysis for enhanced ecological assessment such advancements open up new opportunities to enable a paradigm shift in the way we can deliver transport projects that does not necessarily need to be trade-offs and we can go so much further than just mitigating environmental impacts the newly available tools allow us to push the boundaries to strive for win-win solutions through transport investments ecologically friendly linear infrastructure can now exist with proper upstream planning using online ecological and spatial databases and risk schooling tools not just to avoid negative ecological impacts but also to incorporate nature-based solutions to deliver ecologically friendly infrastructure for net positive environmental outcomes this paradigm shift will require a different approach to designing solutions one that will require project teams maybe to collaborate across our thematic and sector boundaries to combine integrated solutions to address shared challenges on delivering social economic growth as well as to deliver restorative and regenerative ecosystems i understand that the first modules were very well received by participants i'm sure today will be the same with this uh i'd like to wish everyone a successful webinar and hand the floor back to you karma thank you thank you hero thank you very much for those very positive and encouraging words so now we will begin with the main part of the webinar and i will first introduce our resource persons and i hope clara's video is working now um so this time we have miss clara who will be doing the main presentation today she was not there in module 1 and module 2. so dr clara grillo is a researcher at the center for marine and environmental studies at the university of lisbon in portugal her research involves ecological modelling and studying the effects of anthropogenic activities on landscapes and wildlife her work focuses on the processes and patterns of underlying species responses towards roads namely on the effects of road networks on birds and mammals she is the executive coordinator of the project on review of red book of mammals in portugal and evaluation of their conservation status in the university of lisbon she is the co-founder of the iucn latin american and caribbean transport working group so clara is our the first speaker for today but let me also quickly introduce uh our other two resource questions for today um many of you may have already met them virtually in the last two webinars but in case we have some new participants let me quickly introduce them again um we have ben benjamin darcy he is an environment scientist and special data data specialist he works for parks canada as an ecosystem geomatics technician working on mountain goats and caribou projects he has studied the impacts of railways and roads on wildlife for the past 14 years his career has focused on developing solutions to ecosystems and transportation challenges by applying gis technologies he has worked with the china academy of transportation sciences and in a number of other countries around the world and we have dr anthony clavinger or we can call him tony he's a senior research scientist at the western transportation institute uh in montana state university over the past 25 years his research has focused on developing science-based solutions for conservation of landscapes and animal populations in areas experiencing expanding road systems he has published his research findings in over 80 articles in leading international scientific journals and co-authored three books on road ecology he has served as a principal investigator planning designing and evaluating the use of wildlife fencing and crossing structures in projects in canada the u.s and throughout the world um so this is a quick introduction of our three main resource persons we'll have another speaker i'll introduce her later today um so uh clara can i please invite you to get started with the first presentation yes and your video is working good to see that uh thank you karma um good afternoon and good evening uh to all participants depend where you you are and thank you for attending the third model that we will be focused on how to map the potential movement corridors so i'm going to share now the screen i think you can see now yeah yes i think so yeah okay um so the module um will uh here uh uh well the the model will consist in four parts um i will briefly address um uh why is important to map the habitat suitability and identify the movement corridors then i will show uh the principles and concepts of the two softwares maxine to analyze habitat suitability uh and the secret skype to analyze the habitat connectivity then we will show how to prepare the data and the gis information and then we'll run well i will do a demonstration to random model uh the modeling habitat suitability and potential movement corridors with the maxient and the secret um skype so since uh the the current protected areas that we can see here uh in in green uh are simply not large enough to uh encompass the variety of species uh process uh habitats necessary to fully conserve biodiversity and since there are plans of expansion of the linear infrastructure like transportation and we know that it is expected to increase the world network in 60 from 2010 to 2050 and we already know the impacts of the transportation infrastructures and the main effects the main negative effects are the barrier effect and additional mortality for many species one of the big initiatives is the belt and road initiative so um we it is crucial to map the species habitat uh suitability because we need to identify what are the main special drivers that explain the species occurrence and it identify what are the most suitable habitats for the species and then we can identify where we can prioritize areas for conservation so here is um one example of a study from bay and authors in 2018 for the snow leopard and you can see for all the reserve only a few areas are highly suitable uh habitat for the snow leopards in orange and in green mudra suitable habitat so we need this kind of information to prioritize um areas for conservation and protect and protect uh them and this will be also the basis for the habitat connectivity uh models so it is also crucial to map species movement corridors due to expansion of the infrastructure we need to identify barriers to movement linkage between critical areas and identify paths of movement and when if we can overlap the transportation plan the layer we can see where are the places where we can locate the mitigation measures so this is an example of a study from hamid and authors in 2020 for snow leopard in pakistan and you can see uh that in the brown the the areas that are more likely to move uh the species so if there is a road um being uh constructed uh here we can see easily where to locate the mitigation measures in the areas where is more likely to move the species in this case the snow leopards so one of the approaches that is commonly uh used is to run analysis with the maxent maxint is open source is a user-friendly uh software and establish the relationship between species ocares so here we can see the dots for example of a species in our project and then established the relationship with the special information and that special information can be altitude land use hydrology or human disturbance like urban areas or road network and uh using this relationship between the special information and species occurrence we can see what are the special variables that are related with species occurrence and then we can uh identify w where is the most suitable uh avatar so this is the output of the maxi end so you can see uh these colors uh between blue and uh and red uh the blue is um zero um it uh it is the lowest probability of species occurrence and the warm colors like red and orange are the the areas where is more likely to awkward the species so we can translate in terms of habitat suitability so the areas where is predicted higher probability of species occurs is the areas or where the the habitat is more suitable and the areas where the the there is less probability of species occurrence is the lowest habitat suitability so in our study area for the project in nepal you can see uh in blue uh the areas that are not suitable and in grey in some areas in orange and and red the areas that are more suitable for the species so there are also several approaches to run connectivity models and one popular approach is the open source and also user-friendly software it is the circuit and apply the circuit theory to predict connectivity in heterogeneous landscapes and it considers all possible pathways across a landscape simultaneously so to run this analysis we just need to in two type of information the focal uh nodes uh that is the locations of nodes between which effective current flow are to be calculated so what we want here is uh we define here the nodes in the border of our study area we wanted to know all possible combinations between the focal nodes to see where are the best places uh or where the places that can be potential movement uh curators and we need the abita suitability model the the the output from accent and with this um these two type of information we can uh generate a habitat connectivity surface and identify the potential movement corridors but the focal nodes could be not only uh in the border of our study area could be also in the abita patches that are very very suitable and we want to know where are the best uh linkage between uh the the these abita patches so um here uh we i include three uh for an example three focal nodes and uh the circuit skype will um try to see what are the uh combinations between the three uh focal nodes and for example in this case this is the best place to define the corridor so um if there was a road planned to in this location it will be very easy to know where we can implement the mitigation measures could be overpass and the best depends on the species so we can put the focal nodes in our in the border of the study area or between suitable patches that we want to know where are the best linkage and this is the output of the of the circuit skype so it's a single map with the current densities at each cell where the higher current means easier movement through the landscape so here you can see in blue the higher current and in brown the uh the low lowest uh current or zero in this case um so we have here in our roads that we we overlap with this uh uh abita connectivity surface we can see two regions where the is more likely uh the species to to move here and here where is the blue so back to our study area um we uh we have we you already know the project of nepal we have to identify movement corridors for this uh this road so this road that is in the north of chitwan national park and also that cross part of the parcel wildlife reserve and we defined a steady area of 30 kilometers distant from the road so this is our defined study area and we defined 30 kilometers but we we could define 20 or 40.
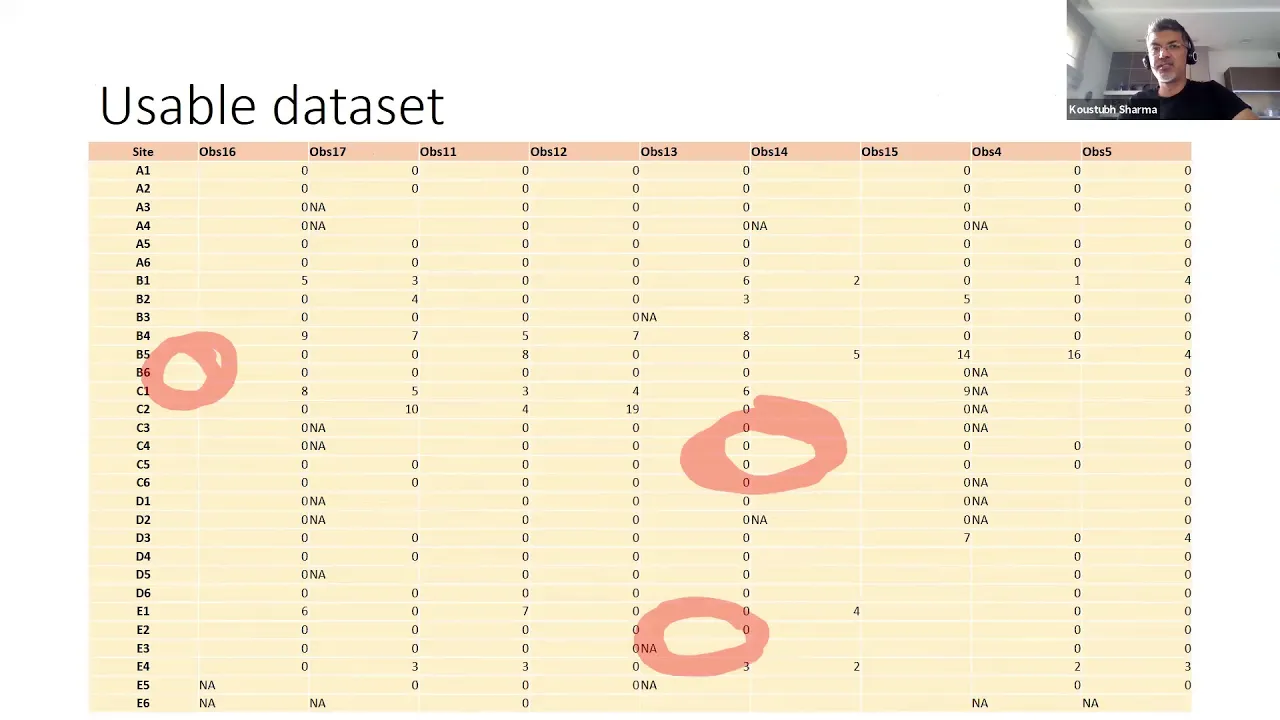
we try to um assume a trade-off between the data that we can collect from the chitwa national park that we have a lot of information and also be large enough to include several home ranges for our target species the the tiger um and not so big that include areas that doesn't help us to define the uh movement corridor so we define 30 kilometers around this road so what kind of species data we plan to to get you already know tony clevenger talked about that in the module uh one only two recall at this so we have roadkill survey a data underpass is used bird watching sign survey and uh camera trapping um well we the project started in uh the field work started in february 2020 when begin depend pandemy so we didn't have a good luck in terms of field work so we have fortunately we we could our team could implement and put the cameras on on the roads but the underpass monitoring the sign survives bird survives and roadkill survives were very limited due to pandemic so we don't have uh too much information so we will use uh that information to validate the the model the final model with the potential movement corridors so what we have now uh we have the camera trapping from the national tiger survey from the sheet one we have a lot of data and also the data from the cameras that we implemented close to the uh the road so what we need to do next uh well for the national tiger survey they gave us the table with the accuracies but for the camera our camera trap we had to classify the photos and then with all this information we could um map the species operands by species and then the relationship we established the relationship with the special variables and we can with them accent define the abita suitability for the species and with the focal nodes running the circuit skype we can generate a surface of um habitat connectivity and then identify the potential movement corridors so the first thing when we get the the cameras and this was the work most it um sharma our colleague from our team uh did it uh was the classification of the image we use this um this uh so the software time lapse that is uh open source and very user friendly you can uh download in from this link this is the web page uh it's here download and install and then this is more or less what we get so when we upload the the photos we can see the photo and then we can classify uh the species we have to prepare the time lapse then we'll show you how to do it so we had a very very simple table so it was very very easy to classify the the photo so we have a list of species of uh mammals and then for birds amphibians and reptiles the number of individuals the number of humans and comments if we didn't couldn't identify and we need for example need expert expert on some species to validate our um photo so this is the table uh from the time lapse so you can see uh like here the memo as well the colon with the mammals um the the identification of the photos and you can see that some are empty because it's a repeated uh photo or because there is nothing so we only identify one uh individual and not several several photos of the same individual we didn't consider then we have the folder that is very very important because it has the identification of the camera and with it will give us the the because we have the coordinates of the the camera it's important information because we can associate the accuracies to latitude and longitude and the date and time that is very important for us too so um the way to prepare uh the the this table is very easy and i will ask ben to show how easy is to organize the time lapse table for the image classification and then i will be back okay thank thank you karma yeah i'll just share my screen and give you everyone a quick run-through of how to create the data entry forms and the template for classifying camera trap images so from the website url that clara showed you earlier you download the time lapse software and extract it it's a very simple piece of software it doesn't even require an install here on my screen you can see [Music] um let's see let's get a simple easy version here here's the extracted file and to run the classification tool you use the timelapse2.exe but to create the template to classify the images we use this editor and i've already opened the editor here um there's some brief instructions and then there's a second tab where you do the work here so you click on template and right now it's blank because i haven't started a project yet and it's quite simple across the top we'll see the types of fields and columns and data entry form elements and then down here in the bottom of this window we'll see what the interface will look like you can create a empty template standardized for a kind of a standard project which assumes you have a file name a path and a folder the standard the standard template in the software itself it extracts the date and time the photo was taken and it gives you two fields for assessing the quality of the image and whether or not the image is something you would like to keep or delete so you can see the standard template here has already populated what the data entry form down below would look like and i'll move from this to the template we actually used for the nepal project that clara was just describing so because we had well over 600 species that we wanted to classify in our camera trap images we created a little bit more sophisticated template and so for that template what we did was we had a field that allows us to pick the camera trap location we have a field for mammals birds and reptiles and amphibians separately the good part about splitting our species lists up like this is it allows us to to pick the species quickly a common challenge in camera trap in camera trap work and classifying these images is you end up with thousands of images so classifying the data saying there's an elephant or there's a hair or there's a snake or whatever species in that photo can take hours and hours and hours so the the really the pros for using a really simple tool like this is it's very quick so by keeping the imagery on your computer and building a simple data entry form you can classify the imagery rapidly um at least more rapidly than you can doing it by hand and clara and tony and i have done that in the past and and this is definitely the the most efficient way to do it you can see some other form elements in this uh interface the number of animals of course you know because we're assessing both the species richness and abundance at a camera trapped site we not only know what to know how many species were detected at that camera tribe but how many individuals were there we also have included a few elements here this one humans not researchers for many of these sites we want to understand the levels of human use we provide a comments box here we often flag photos that we might use for media for report a really interesting or fascinating photo or for a photo where we're not sure what species is in the image many times because the camera traps work both in the dark and during the day by using a color infrared flash the animal might be blurred or hard to distinguish so once we have this form as we fill this out this form essentially creates a spreadsheet it can be exported as a comma separated values table or an excel spreadsheet and that's how to use time lapse i might share one more thought before i hand the screen back to clara and that is we use this simple desktop tool rather than an online tool due to the time it takes to upload and exchange photos for a large camera trapping project like this one moving the images around can become a large hurdle and in places with slower bandwidth uploading is often much slower than downloading data so it can be a big challenge to essentially get the imagery online and into other tools however some of the new tools being developed offer the chance to crowdsource the image classification and may even offer a chance for there to be some um algorithms that classify the images for you so they may be able to flag false positives where the camera has taken a picture but there isn't an animal in the photo and and that alone uh can save a lot of time okay thank you and i'll hand the presentation back to you clara thank you ben for the explanation so you can see how easy it is to prepare the time lapse and uh it's a lot of fun to identify the the species uh even when when when is in nepal not in my country that we don't have a high biodiversity but it was a lot of fun to identify um the species from the from the photos so we will um keep on going i'm going to share again and um so um only back to the so this was the the the table that we get from the time lapse we re organized the table so we um for for us uh in and for this study uh we have all the information on humans so we delete the part of the humans and the domestic species we add the latitude and longitude because we know where were the the we know the uh the cameras and we know the the coordinates of the camera so we add that information and we also add the order family and species to be consistent in all the table and also we can filter if we want only to analyze one order of species or family or species by species we have that information we also add some like data that we have already and the uh month and the season we used uh well we are using the the information from the dry season because it's the best um where we get more information so uh we have already prepared the species data now i'm going to show you how to prepare some gis information so we we choose altitude hydrology land use buildings human population and and roads so for the altitude uh we can get for free in this um in this link um uh this is the page that you can get and here is uh the area of nepal and our study area uh the format is a thief the year is the 2011 and the resolution is very good it's 12 meters and off so what i i have to do is use the arcgis and arcgis it's a very very good software but it's not for free um but it's a very very powerful software for geographic information system so if you have the opportunity to get a training or you already use arcgis i share here the steps to prepare the information so what we need for the magsant is we decided to have a resolution of 100 meters by 100 meters the cell cell size and all the information has to be in ascii file so um we go to r2 blocks data management we resampled the um the the altitude to 100 meter cell size and then we convert the raster to ascii so you can see here the our huster prepared for the maxine so here you can see the higher altitude and the lowest altitude and then hydrology uh we try to use ideology that was for free but we uh reached to the conclusion that was not a good resolution we found we overlapped in the google earth and the the lines were very far away from the real place of the of the river so we have to pay to the to the department of survey in nepal for this information and this is a very very good information uh with the scale of one two to twenty five thousand so it's very good and we have two types of uh of um um information uh it's the main rivers in polygons that you can see in this blue and the minor streams in this old light blue that is everywhere so uh because it is everywhere i we don't find a pattern so we decided only to use uh the distance to the main rivers so uh we need a surface of distance from the river so the blue the dark blue is where the river is and then when the uh starting to be more distant from the from the river uh the the the colors change and here you can see that is more distance and also these areas without reverse or also these areas so uh we use the arc toolbox special analyst and then we choose estimate the euclidean distance from the rivers and then we convert raster to ascii the land use and we choose uh well the dry season we get the satellite satellite image from this link this is for free and it's a image from 2020 the resolution is very good but we need to classify and the the image um i i didn't because i'm a biologist i had some training on remote say remote sensing but we had in our team expert experts on remote sensing and they did it and the the classification of the of this image satellite image so what i got from my colleagues uh was this uh map a raster with this classification that they they had um because of well uh you know you need algorithm to classify all these um image and then you need to validate um in general the classical way is to go to the field and choose random points and look at this in the field to see if it is well classified but because of limitations in terms of uh movements because of the pandemic they used google earth that is a very good resolution to validate this information and the validation was very good so what i just did was um go to resample to uh the information to the cell size that we want 100 meters by 100 meters and then convert raster to ascii for the maxient um other other uh uh information could be buildings this for it was new for me um it's in the open street map and each building is a polygon it's uh for free it's a very very good information and can give us the idea of where is the human population and the human uh disturbance so uh this is the format of a polygon and the year is the 2021. i also get from my city and i can confirm that is a very good information um and then what we did was the density of buildings so we convert the polygons to points and then points that is like centroid of the building and then we estimate uh the density of um of the of the points and then we convert to from raster to ascii so here you can see um uh the number of buildings by by meter square well the the numbers are so low i should have estimated number of buildings by kilometer square so this is why the numbers are so low but it is the same um so we have here in blue the highest density of buildings that correspond to the urban areas but we can see other buildings that are not in the urban areas and in yellow the lowest uh density you can see some yellow here so this is a very very nice information to to use for for the the models and then we have the human population that uh we get also for free from this uh link world pop org uh it's from 2020 and the resolution is already 100 meters so uh you can um i just uh convert to from raster to ascii because it was already in the resolution that we wanted the road network it was important for us to see also the human disturbance from the uh the roads um there is some information available for free of the roads but it was not good resolution for this in fact small area so we have to pay to the department of survey to get a very good information in a factorial polylines and we get different types of of roads the highway that overlap ours our roads target roads and also feeder road district road or the road that we didn't use we only used the highway because we didn't have the traffic volume but we assumed that the highway has the highest traffic volume so what we did is like hydrology we generate a surface of a distance to the highway so the red is the where the location the location of the highway and then the different colors is different distance from the from the highway so we estimate the cleaning distance and then we convert the raster to a skin so now uh we are prepared to run the maxine's model so um we have already the information prepared we just need um two in our computer to prepare and to name three folders one that is the samples that where we include the information of the species so it's a table like this the species we i call sp i limit sp but we need this header species the coordinates and save it is a csv and then we have the variables that is all the information that we convert to ascii altitude the buildings the highway the main rivers human population and the land use in the dry dry season and this is the window of the maxim so it's very very user friendly you can get the information here for the species one species so we um generate the habitat suitability model for one species each for each species one at a time and then we include all the variables from these folder variables and we can check or uncheck if we want to use all or not use all we have to be careful because some information are continuous data like altitude density of buildings human population but the land use is categorical we have different types of land use it's not a number even even is expressed as a number so each lend his time as a number but doesn't mean it's an ordered number so uh we want to know the relationship between uh the the variables and the species uh occurs likely so we check here the response curves and um and then we choose the directory where we want all the output this is the folder of output so we put here and then we are prepared to run we use the training data if we have a lot of data we can do that training date 85 percent and then test with 15 percent it's a way of validate and our model so uh the output is generated automatically in the folder that names output and this is the most important information the link that has the summary of all the output of the old information about the model and the spr ascii is the habitat suitability model the surface um so we need to know if the model is good and this is the the measure the auc area under curve that if you have a value above 0.8 is a good model so it fits to the data and you can see that the training data has a higher number 0.9 and test data has 0.92 so it's a good model it's important to know um what are the variables that can contribute for the model this is information that is generated too so in this case we can see that the land use in the dry season is the the information they had to give more provide more contribution to the model the altitude somehow but the human population this into highway buildings and manure is a very very low contribution to uh to the model and we have to understand if this makes sense for the species uh otherwise the model can generate a bias result it will not help us and this is uh the relationship between the species occurs likelihood between zero and 1 and the values of the variables so the land use dry is the most important variable for this model here is the one with the number seven so maybe we have to check if this is related with the habitat of the species um and if it is it is okay uh for example this uh variable doesn't change the human population doesn't change um the the likelihood of probability even zero or or higher number um so but doesn't contribute much so it's it's not very important in the model and doesn't buy as the result because it has a very low contribution this one is a low contribution but it has a pattern you can see that the highest species occurrence likelihood is where is close to the to the rivers and then decrease the likelihood of occurrence with the distance to the river maybe it can be a species that is more associated with the streams or rivers and then here we have a relationship to the density of buildings so it decreases as the the distance uh the density of buildings increase so a higher likelihood of occurrence with no buildings no human disturbance and sometimes happen like some weird relationships and we have to be careful if it is a artifact of our survive for example if we had a lot of information close to the highway because you put the cameras close to the highway maybe we have a positive relationship to the highway and it's not um a true it's not a reality so we have to be careful with these results and sometimes we have to delete the the the variable that we think that doesn't show the the reality and this is the output like i showed you before so it's a map that showed the probability of ocares that means the habitat suitability and this is the the map that will be used for the arbiter connectivity model using the circuit scope so now what we are prepared to run the circuit scope we just need the two information so we have already the focal nodes around our in the border of our study area and our habitat suitability is the same of conductance surface so we will use as the basis for uh the the model the only thing that we have to change here is the rabbit suitability is ascii so it's already prepared and the focal nodes we had to convert from points to raster and raster to ascii to to run the circuit screen and this is at the window of the circuit scope so you can see that it's very easy and friendly so you choose the raster and choose the modeling mode that is all the combinations of pairs in the of the focal uh nodes then you choose the avita suitability model we don't use the resistance data we check here that represent conductors instead of resistance and then we use the focal node here and then we can uh well the output so we have to put where we want our output and then the current voltage maps can help us to understand the uh the final uh map and we can run and run it may take some time if that we have a lot of focal nodes because it's all combinations of pairs of focal nodes and then we get the output so the output will generate the the secret scope will generate several um [Music] files ascii files for all the pairs but the sum of all the pathways the combination of pathways is this one i named it sp6 july but this is the common name curve map dot ask and here is the current um data so higher current uh means a higher likelihood of movement and the lowest in brown so the lowest current so it's not good for movement so we can identify like i told you before two areas for potential movement corridors and maybe these are the places where it's the best places to implement the mitigation measures so here is the the end of our demonstration of the circuit skype and then i will ask ben again to show how to add the final map of connectivity to the dashboard and you can we can show uh the very end in the module three all the information that we can use in the dashboard and also the map of uh connectivity so thank you very much for your attention and i will give the place to benjamin hi ben hi clara just checking so uh this exercise it should just take a couple of minutes right ben yes it's very very quick we're just gonna essentially complete the circle to show that we can we will use the outputs from circuitscape and accent in our cycle of communication of evaluating our progress project's progress yes because i see where we are pressed a little bit for time aren't we and we would like to take some questions as well okay yeah i'll just take two seconds here and uh we'll move right along quickly okay so just to give you a quick picture uh here we are in arcgis online what we've done is published the final outputs from accent and circuitscape as a web layer and we've published them as a tile service so just like a base map that you would use on your mobile device or in google earth or any other web mapping tool you use we've pre-selected the symbology to highlight the different types of suitable habitat and we've also published the habitat connectivity raster that was a result from cirque escape so here in the red you can see the high the height conductance or the areas where there's high connectivity based on that habitat model around the perimeter you can imagine all those nodes and so essentially what we've done is map what route based on the suitable habitat would our simulated animal go to get from each node to every other node in our study area and so the brighter red means the more likely root that animal would go so how we would use this in an actual project is we would publish this as a draft layer to promote discussion within our team we might even use a web map to identify some spots where we have maybe some roadkill data or other information and inspect that site we may print out a map or even load this into a field app that we could go out into the field and inspect the site on the ground whether that's using a gps or a data collection tool like we covered in module two okay and i will hand stop there and hand the presentation back to you karma great thank you thank you ben thank you clara so we have a couple of questions and i see that tony and ben has already been trying to answer the questions in the q a box but perhaps we can address some of these we had the first question from prince what are the parameters that you have selected uh and used for the max end model to predict habitat suitability of the particular species so i see that tony did uh answer it a bit but i think perhaps clara if you can help to answer that question uh i'm not sure what what uh is the meaning of the question um so how did you decide on the habitat suitability for the square meters yes yes okay in general we have to know the ecology of the species uh so um if we know that some variables uh explain the species occurrence this is the best um variables that we can run the the model so if there are some um information that is not associated with the habitat of the species doesn't we don't use that information so sometimes we choose some variables for one species and other variables for other species because we know that they can um they can affect the distribution of the or occurrence likelihood for example for amphibians it's important that the weather but for carnivores um in a short time it's not very very important the weather so we can use the weather or the climate for the amphibians but we don't use for the carnivores i hope it is the the question i answered the question yes i think you did and just to sort of link to that question and i also had a question but i see uh there is a question linked to this from prince again and also from roshan so the question is uh again on the question of the habitat suitability modeling of each particular parameter for species is basically dependent on availability of future projection data what are the available sources of projection data and if it is unavailable how can we generate so i guess it's got to do with the future projections like because we know that things are changing and maybe the habitat coverage or the density of forests uh will not remain the same as it is today and there may be like other things happening so how do we account for that well this is another kind of modeling uh we should well there is some projections already for the climate change for example or um it's uh we need that information like for the future years and then we can try uh using the information of what is the habitat suitable for the species if there is available habitat for the future but we need to have that information already performed so for example if we project there is a high deforestation in an area and the the the species is a forest wheeling if we have a map without forest we can see that the species will not occur so we need that parameters already generated and then we can link uh to the the species uh sweet abita suitability and see that in the future we will not have the species in that places as an example i saw by answered so we need that information before and there are scientists doing this but sometimes it's very difficult to generate because we cannot validate it's the future projection it's not a um a current model is for the future it's very hard to validate this kind of models but there are some studies that use these projections yeah thank you so the question from roshan is is there any possibility to use species abundance data so it's sort of linked uh well no for the maxient it's only uh presence only uh and it's um i choose this um this software because it's very user friendly and is open source but you can use uh occupancy model um and there are some studies that they try to use the occupancy model and they have like an idea of abundance um and it's more complex you have to run in art but yes of course you can use and this is more interesting information and more uh correct information because it's not only presence but you have an idea of the abundance and uh sorry just again so my question in relation to all of this was with regard to with the species so you showed the example of the snow leopard but obviously in a lot of the forest and particularly in the nepal project we have many species so how do you map the habitat suitability for all the species together that are present there at the site okay there are two options toni clevenger told uh in the module two uh one study that was published in animal conservation they grouped the species in terms of ecological group so like some species that has the same preferences all together and then run uh the the the model of habitat suitability for all that species all the occurrences and this is good good because maybe we don't have too much data and then we have a group of species and we have more data in our case we decided to do one by one we want to control uh some species are threatened other species are not threatened there are species that are much more abundant and could dominate the group of species and we want to understand species by species because if we have the mo the habitat suitability or the potential movement corridors for each species we can prioritize uh for areas for like the threatened species and then uh do to not give a priority for species that are more abundant so we are doing uh species by species so in this case we have we are running models for 13 species trying to um have the large carnivores the medium-sized carnivores um and others uh small small mammals and or for example primates too so different groups but we will run species by species and then we overlap all that information uh great thank you clara so um very interesting question from katie could you imagine deploying a network of e-dna sampling points across a landscape to gather data on species instead of camera trap data so either clara tony ben please if any of you have a view on this so this is the environmental dna isn't it sampling points across the landscape well if we have that information that is more hard to get more expensive to get um yes of course because it give us where is the species and i don't know the e-dna doesn't give the individuals but the camera trap we cannot see the individuals only for the species that we can't see a pattern in the defer so it's some well like maybe tiger or you know better than me but maybe only a few few species that you can see the individuals so if you have dna sample of course it's much much precise but i think it's more expensive right i don't know tony tony maybe can help because he already participates in um in studies with dna uh yeah no i i i've never i've never heard of uh it being used terrestrially i've heard a lot of it being used aquatically so to determine what species are in in different st aquatic species or in different streams but certainly certainly if there's a way to sample on the landscape just like you would with camera traps every you know in 500 by 500 meter square cells or whatever and and collect edna to identify multiple species i know there's an issue with with with the amount of time that dna has to be present it can't go back it has to be relatively fresh uh that is to say you know the species had to have left dna there within like a week or two otherwise it degrades and then you can't identify but who knows maybe in the next in the next five years you know this may be it could be used with improved technologies it could be used equally effectively as camera traps i don't know ben did you also want to say something i think i see you trying to type an answer i i was going to to share because you know i've worked for tony for a number of years collecting hair trap and dna to is essentially do just that however you know as clara pointed out it's it's very expensive and labor intensive using the techniques that we use for wolverine yeah so i'm not sure you know we're talking about multiple species the challenge would be having a sampling methodology that would capture dna from different species and that that data would also be something you could process because there's the the nuance of needing to know which species sample you have collected before sending it to a lab for example yeah and this is tony again i i was i was interpreting the e-dna sampling like like they do e-dna sampling in rivers where you're you know scooping up some sort of sample terrestrially and and analyzing that for for what species have have interacted with that actual sample um but what ben is talking about is is like collecting either scat or hair samples which is the typical way of what we call dna sampling or non-invade non-invasive dna sampling and we've used that uh quite extensively in in our our work in in canada to on both sides of highways to sample uh particular species you know black bears and grizzly bears we focused on and and and also sampling uh at the actual crossing structure so overpasses and underpasses so basically we wanted to find out um at a landscape scale what what what individuals are present uh could because we can in debate not just to to to gender but also to individual and then which in which of those individuals out on the landscape we're actually using the crossing structures because we collected samples there and then with these with the you know hundreds and hundreds of samples we got we were able to determine actual gene flow and and we could identify you know males that were using the structures to cross the highway to go breed with females on the other side and we know who the fathers were who the offspring were etc so it you you can collect you can generate a lot of samples we probably generated you know two or three thousand hair samples over a three year period but like been said it's it um it is still quite expensive and i remember the cost of those lab sampling f efforts each year being anywhere from 70 to 80 000 so so quite expensive but also provided a lot of information right so it this is an interesting idea but the cost is the biggest challenge huh um so if we can move on because we are running out of time a question from my colleague farhat for density analysis is there a way to identify animals uh individual animals as camera trap data can capture the same animal several times a day so i guess the question is more about i guess estimating the population of the species yes you need you need for species that you can identify individuals by markings you need you need typically two cameras like if you read any of the tiger studies that have been done in in um in asia they're you know they they have two cameras on it one on each side of the trail and they're able to to identify individuals that way um and once you you can identify individuals then you can determine densities in those certain landscapes whether it be protected areas or outside of protected areas or on one side of a highway versus the opposite side yeah and there's actually camera software i think ben probably remembers remembers the name that actually includes that mark recapture analysis in in within the within the actual software um for camera image classification yeah thank you tony so a very important point from uh our colleague deepak from the nepal resident mission so he's saying that this project could get benefit by using this model with with all the experts on board but the question is how could it uh how can we continue with its use in future planning by government agencies involved with linear infrastructure construction and the department of national park and wildlife conservation uh how can we improve the local ownership in use of these kinds of models so your views tony i was just gonna by local ownership i'm not sure whether deepak is referring to local communities or the local stakeholders like ntnc or the national park the government yes the national park agency the government these models could be could be run re-run with for different species with in different landscapes with different uh human impacts or different land management scenarios quite quite simply um the mod like cloudera showed the models are quite simple there's uh you know most of that data is open source relatively easy to to obtain some of what we had to purchase on the project if we couldn't obtain reliable uh recent and accurate fine resolution data um so yeah you know in short it's it's it's quite simple to to to run these in in different land management scenarios or species uh infrastructure impact scenarios as well yes and i guess one thing is continue organizing uh training programs like this and inviting government uh agencies and hopefully after the pandemic we can have like a more focused project-based one-on-one kind of training like for example ideally we would we should be sitting in nepal for example and having uh you know officials from department of road or department of railway sitting and we can demonstrate to them and then slowly build on that and establish like an environment or you know safeguards unit or something like that that would then have like a database of all of this with with an i.t person so i guess in the long run that is the part that we should take to to improve ownership amongst the local government departments so um [Music] okay the question from roshan regarding the less mobile species such as snails and slugs do we consider them as well for design of crossings yes very good question what do we do about the little ones the little species well i i can i can speak of one project that i've been involved in in washington state uh interstate 90 where it's it's a highway that bisects the u.s national forest and they've actually included slugs they've included snails and vertebrates in in their ecological connectivity plan everything from from these you know these relatively small invertebrates all the way up to black bears and wolverines and links and things like that it is generational uh you you won't you won't see these slugs running back and forth using underpasses many times during the year but at this sort of scale they you know it would require longer term research to to see species that are on opposite sides of an underpass or an overpass to eventually recolonize uh this area in the middle this overpass or underpass and actually you know connect habitats and you know another good example is this large overpass you've probably heard about in los angeles where they're they're planning on doing the exact same thing with uh you know the checkered ordinate beetle which is a native beetle in that area and and a lot of pollinator species as well to see you know how long it takes for pollinators to come in and and start using you know this this large uh land bridge uh and and connect uh habitats on both sides yeah thank you tony so um there are a few more questions but i think ben and clara is answering or they answered actually i had a few things um from the presentation that clara had made and i noticed that you had one of those maps that showed the density of the buildings so i'm thinking that this would also be useful for our understanding the social impacts particularly with regard to resettlement and impacts on structures so this modeling could also be used for uh analyzing that kind of information right clara well the the this information of the buildings is very very interesting to analyze for the social part but here it was used only to see if it affects the species occurrence you know so yeah of course you can use that information for other other purposes other other goals but in this case it was a measure of human disturbance right yeah so but then we could use that data for another purpose combine the the buildings information and then you also had on the population the human population density so i think this is something which would be useful to understand also the social impacts um my last point was on you had the map that showed all the other roads you know the the different categories of roads so i think that's very useful for understanding the cumulative impacts right of all the other well we could also add data if there is like an irrigation canal or um power transmission line or something like that so this would be very useful for cumulative impact assessment of course of course we don't have that information we know that there is a plan for example for the railway and we if we have that information we could add as a layer too to understand if uh affects the the species occurring so what we are doing now is to know what is affecting the occurrence distribution what are the areas that are very very suitable for the species to protect them and to turn these areas uh permeable for the movement and where we can locate the mitigation measures to keep the connectivity of their uh habitat so yes so any layer any information that can describe better the the study area can help us to understand what are the best places to uh to prioritize for mitigation right thank you clara i think that's very important because that's something that we really struggle with the the cumulative assessment looking at everything together as well as understanding the future directions and as much as possible we need to try to um add information on future development projects you know to understand the bigger long-term uh picture so uh thank you very much for answering the questions uh clara ben and tony and i think we should move on to the next session which is the open discussion session and if i can ask cecile to please share the slide with the five questions and um so i think we've already shared the questions uh to the audience to the participants and i hope some of you will uh have some feedback on this and we will have tony to moderate this discussion session uh so tony over to you and uh is is your video working because i noticed that your video was not on past couple of times you're talking yeah i'm i'm in the dark because i'm traveling i'm actually not sure if you can see me um i turned it on yes we can see you okay good all right yeah with um we wanted to have about 25 or 30 minutes to to have an open discussion uh but first of all i want to thank everybody for participating in the module today and then also the past modules um the webinars generated a lot of interest and a lot of excitement uh in these new tools for for the road ecologists that can streamline data collection and also engage stakeholders in a in a real meaningful way so here at this point in in this last module we really want to hear from from you the participants and and find out more of how this information was received uh by you all and how it was digested and and we look forward to uh how it might be used uh in your projects uh and how we can improve improve future webinars uh that adb puts on and also organize these future webinars um that adb um you know could could propose in the future and and and really help um adb meet their ecological sustainability sustainability objectives so there's there's five different topics or uh areas that we want to cover and i guess the first is is just finding out uh you know was there any information that you would like to to learn about that maybe not that wasn't covered in this in this webinar uh what which parts of the webinar were most relevant for your work uh on adb projects or non-adb projects and i believe we're going to try to have people actually provide the questions orally instead of trying to type them in i think chris is on hand to to to let people talk yes yes so uh i guess we can invite our participants to either raise their hands uh and then chris will help to turn on your uh audio if you would like to provide your feedback verbally or if not if you can also provide it in the chat box [Music] so um anybody and these were all sent out prior to the to the webinar tonight i think so uh yes yes you might have had time to to go over these or maybe not but we certainly like to hear hear back from you okay someone raised their hand chris can you see i think it was fatigue yeah i already allowed but uh him to talk so he can unmute uh sorry i can't see resume yes hi good afternoon am i audible yes yes good afternoon yes it was indeed a very good learning exercise for me uh i came um because i'm not working anything on the this particular uh kind of work yet but i'm a basically a social uh scientist uh uh person also i look into the ecological uh you know tools with that way but right now i'm teaching ecological economics so then i want to know that what are the different kind of tools that are used for different projects so that's a reason i attended this course in that sense it was really a great learning exercise for me so my one question like which is like coming keep on coming into my mind is that when we do the man animal conflict from a social scientist perspective uh how you know this is actually very uh useful especially in the western cut region where i do stay and you know i focus on in the southern in indian peninsula but how we can actually you know bring this communities around that that's something which i am thinking about it and also looking to the resource mapping and whether it is possible uh to use this kind of you know a tool to do the resource mapping uh before starting like as a baseline uh activity and then when maybe the later end line activity that is the concern i do have and then i would like to see some uh training programs in this regard you know in in in future thank you very much and all the uh resource persons were really good very communicative so i appreciate them and i'm very thankful to them as well and to come on you actually let the discussion very well so thanks to you as for karma thank you thank you tony do you have any comments on feedback from dr resme no i think that's a very good point i think the integration of not just you know the sociological and the ecological uh in a webinar or the ecological and the economic uh could be could be very valuable um you know it's it's not just ecological and it's not just sociological or economic but all of these things are you know play an important part in you know cumulatively and together um in these projects and and there's a need to to definitely understand you know those three camps together uh in these projects um so i i think that would be very valuable and and my recollection from previous modules was that um you know we did have questions from from the the social scientists or the the people who work with on the social programs not just the environmental so um you know there's a lot fair amount of sharing and and interchange that that could occur between the these these two disciplines right and and actually moving forward we are looking to follow a more integrated approach between environment and social issues you know in our safeguards assessment um so we i think we have uh suva suva lakshmi so chris if you can please turn on her mic yeah super lucky go ahead thanks chris uh so good afternoon everyone and good morning and good night to people who are in various regions first let me thank karma tony ben and clara for the wonderful and interesting and as well as insightful session and the modules that we have had so now going to the questions in the order that they are there on the slide in terms of relevance i would say that definitely the webinar and all the three modules were extremely relevant to adb projects because having worked on these kind of web-based interfaces and tools in the past especially in the energy sector i understand that these kind of tools you know wherein you can actually integrate both your site and fields related work and also relating it to the gis interfaces developed by esri and any other tools where you can also integrate some of the available secondary data from the sources like ipad and gb it is really good because that gives us a very detailed and comprehensive understanding of both the you know direct and indirect impacts of any project in the area now i uh you know i am basically working in the satc division which is the transport division out of the south asia regional department so i can understand that how especially with respect to linear projects it becomes more important and also especially if i take the countries like india and bangladesh where we have immense you know data but the data is not available online to integrate well with the primary baseline monitoring that we do in terms of the gaps i would say that it's not basically about gaps it's basically more about us you know getting in to do more of the role-play exercises in terms of using these tools how to integrate the data well more with the gbif and the ipad data and all other online sources because these days even the country governments are uploading a lot of remote sensing and web-based interfaces wherein you can also download the hydrological data the various other parametric parameters which can integrate well with the biodiversity and the wildlife aspects in terms of especially if i take the example of hydropower projects where you can actually you know relate to downstream and upstream impacts of various species that are available so probably we can get into more on exercises and uh you know learn so that we can also practically uh uh learn and run the tool and then get to ask you more questions when we face such issues maybe those can come in the future or forthcoming webinars if we plan to do so how could spade in new web tools definitely as i said that spade is again an interesting tool is just that we need to understand how do we integrate them well with the available data sources integration is quite possible on these web bases the only challenge that we keep on having is about the validation of the data and timely updating of such data because we need constantly some somebody at the back end who can update the data with the current ongoing changes also in the government topo maps or the maps especially when it comes to protected areas uh environmentally other sensitive areas which keep on coming up like if i take the example of india in india there are a lot of areas now which are getting defined as the ecological sensitive zone so every every quarter there is one national park or sanctuary that gets defined as an ecological sensitive zone so we need to understand how do we well or integrate and timely update this data now it coming to what types of information or use do you see for continuing the hub i think this is vast because uh all this information especially when it comes to wildlife and biodiversity and also integrating into the other environmental factors that can only one can only get that on a integrated tool like uh spade or any other web-based arcgis tool you know where you can wear sd has also uh authenticated all the data and you have all the data sources especially you can also upload your own project kml layer there and as we had learned in this session and then get the data analysis quite uh done in a proper way the last is future topics and exercises as i said it will be good if we can you know ourselves integrate and try using this tool and get on to doing more uh role play exercises on such kind of projects or take specific examples of some transport sector or say any other sector projects wherein we can define the core zone and the uh buffer zone impacts using our own data like doing the wildlife surveys where we did camera trap surveys or roadkill surveys and then using that data to extrapolate the information that's all from my site thanks again and it was really useful and insightful to attend these [Music] sessions thank you silva tony would you like to continue um well stuff covered all of them um we were i guess we could just open it up to to anybody if they want to you know we don't have to go you know one two three four five but if there's uh any any comments or or input that some of the participants might have with regards to the hub or with our regards to the gaps or for the future uh or spade yeah we'd like to hear from you and thank you suba that was very very comprehensive a lot of work to be done still yes a lot of progress made but a lot of work to still be done um it looks like we're not going to get any questions um anyone from the audience uh we see that iris has posted uh thank you training has been useful for environment safeguards especially in the current virtual setup in view of the guidance note on safeguards compliance i hope for a similar open access training series on tools for our social colleagues particularly those working on larr yes so that's very important and a very clear message so next time around we need to have uh more coverage of social impacts uh in in the webinar so that's uh something that we should uh take into consideration in the next round [Music] um so if if there are no questions from the audience perhaps we can just move on to the next phase uh what do you think tony yeah that sounds fine you can move on but uh before we move to pam's presentation and i see that all our panelists are still here uh hero is still here could we uh turn on our videos and take a group photo can i invite everybody to turn on your video and um chris says can you please help to take a photo even if uh chris cecile victor if you're comfortable please also turn on your video since you're a core part of the team pam oh yes bruce um please let us know when you're clicking okay ready smile one two three another one just in case someone's closed their eyes okay wait wait one more and ready smile one two three thank you thank you chris um so then uh we'll move on to the to the last uh presentation for today and we will have miss pamela chang from uh the transport sector group so pam is the senior transport specialist in the transport sector group in stcc the same department as me she is an experienced team leader with 20 years of international experience in the development and management of transport projects including urban transit systems railways seaports airports roads cross-border transport and regional connectivity um currently uh pam's current areas of interest include harnessing the potential of advanced technology and data analysis in developing smart infrastructure as well as promoting participatory approaches uh in co-creating future visions for influencing transformational changes in transport services to tackle multi-dimensional challenges in climate mitigation and adaptation disaster resilient infrastructure chris is that you you do you have your mic on green infrastructure road safety institutional and capacity strengthening and governance so um and as you can see from the cover of a presentation uh this is a very forward and future looking uh presentation that pam has for us uh over to you pam thanks very much karma can you hear me just to check yes yes we can hear you okay great thanks very much for the kind introduction karma and hello everyone i'm really just delighted to share our work on applying for site in transport today we've developed an alternative approach basically to support adb project teams dmc clients and anyone really to reimagine the future of transport so we embarked on this study in the thick of the pandemic last year and this was really in partnership with arrow whom some of you may aware they're a global foresight leader in this field it was quite challenging to it would be challenging to condense the work we have done in 10 minutes so please let me just share the relevant highlights and if you wish to know more please get in touch with me okay so there are quite a number of definitions on what foresight is but i just wanted to share the one that resonates best with what we are trying to achieve foresight is the practice of systematically analyzing the future to inform today's decisions and why are we doing this as we all know the the world is rapidly changing you know we're having this increasingly no face-to-face but yet we can still have this um massive training and so coming back to transport on top of urbanization shifting demographics climate change conflict access to data covet 19.
these are increasingly impacting how we live work and travel so the foresight study was intended to better understand how these shifting contexts are affecting transport and how this knowledge can be applied in designing future transport systems and this slide really summarizes the methodology that we have used we first looked at the trends that are shaping the future of transport and then the implications and based on the review of the trends we developed a series of draft visions the principles under underpinning the visions set out the development pathways to guide project sponsors and developers towards desired futures and visions so initially we identified 10 broad trends and as you can see they represent a complex ecosystem of change many of us will already be familiar with you know climate change and environmental risk but equally compelling population patterns could also increasingly um be concerning due to say aging population on behavioral patterns and you know increasingly digital lifestyles and these are particularly accelerated by this pandemic the compilation of these broad trends are really intended to spark dialogues on what the new normal for transport would look like and how can we turn uncertainty into opportunity the challenge really is not so much to identify change but how to contextualize this change and how do we capitalize on this knowledge to make better decisions today and these are some of the sub trends on the environmental degradation trend that we're witnessing at a global scale and this includes the spread of the disease and invasive species air pollution marine pollution habitat fragmentation and risk to wildlife as we have seen through the course of this training in terms of implications as we all know you know large is large-scale infrastructure such as transport they do have very long lifetimes and it can take three to five years to implement and these could even be expected to serve for up to a century right like roads and rail and the infrastructure decisions we take today can lock in development patterns for decades to come so in this context farsight techniques can help us to contextualize the emerging trends on what we should know about the future climate and environmental conditions technologies user needs and expectations etc etc to make better decisions in the design of in the design and delivery of transport systems today and to support future thinking we have created a set of visions to stimulate the reimagining how future of transport may look like and these visions set out goals and aspirations and these are intended to be inspirational so the idea is that these visions can help you to facilitate policy dialogues with our developing member country clients on what are their preferred futures by providing a picture of where we are and where we should be heading so such dialogues with our dmc clients and relative relevant stakeholders internally and and externally are going to be important in co-creating a shared vision based on which development pathways can be built to achieve those preferred futures and here are the eight visions that we have drawn up it encompasses a broad range of considerations from as you can see delivering safe reliable and efficient systems accessible and inclusive spaces to things like adoption of technology now some of you may observe that these look quite similar to the strategy 2030 operational priorities and this is indeed the case and very rightly so right because the strategy 2030 advocates a holistic approach to development challenges that calls on all sectors including transport to incorporate the seven ops into transport projects but what this foresight study has done is to look at these operational priorities along with the current trends and along with the technical disruptors to contextualize what this means for transport through these visions so let's take a closer look at the vision on environmentally considerate outcomes so four principles have been identified to support the achievement of each vision and the principles are intended to guide project developers or practitioners on the design of national strategies or sector strategies policies and projects in alignment with the selected 25th division so for environment on the left hand side as you can see these are these principles are accelerating low carbon development investing in natural capital and maximizing ecological gain which is the theme of this training minimizing resource consumptions and planning for circularity designing to minimize urban heat island effect and increasing natural solutions so across the table you will notice we also identified a range of strategies to support practitioners in thinking about the levels of ambitions that they wish to achieve to ensure relevance and taking into consideration the varying levels of development and readiness of different countries three different levels of incremental strategies have been established and these are defined as baseline progressive and transformative strategies baseline strategies present basic levels of ambition that the dmc client or practitioners should adopt progressive strategies will push the boundaries of what is possible and transformative strategies represent the most innovative of all ideas now due to the rapid evolution of these technologies what we have here these strategies should not be viewed as an exhaustive set of recommendations but rather as a starting point to inspire practitioners and project teams to embark on their own foresight journeys to develop future ready strategies and projects so under principle tool on investing in natural capital and maximizing ecological gain for example you can see that the baseline suggestion is to ensure rigorous approaches to ecological impact assessments which i believe has been the theme of this training and in the earlier modules and the more progressive strategies talk about biodiversity offsets and the transformative strategies call for integration of truly regenerative so not just sustainable but regenerative design principles like greenways and in this case biodiversity and nature-based solutions are fully mainstreamed resulting in net gain in natural capital so unfortunately there isn't enough time to share all the 32 principles across the eight visions today because i think it will be a little bit overwhelming and there's also not enough time but here's just a sneak peek of the strategy the strategies across the different visions and the idea is to offer a menu of ideas and possibilities for practitioners to embark on their own reimagining and foresight journey so we will invite all of you to have a look at these principles as soon as our publication is ready okay so the potential application of this foresight approach includes four main pathways it can be used at the very highest level to map trends or to co-create visions amongst a stakeholder group to develop transport strategy or even to generate ideas to enhance standalone projects so we are soon to publish a playbook to share methodologies to support each of these pathways and the desired outcomes are very clear the first is to build futures literacy amongst adb community and our dmc clients the second is to identify and define new investment pipeline opportunities and the last but not least is in doing so it will it will elevate adb's reputation amongst dmc counterparts as thought leaders as dmcs are also now aspiring to build back better stronger and greener and so we've come to the final slide i just wanted to share the available resources publications and the assets as you can see there's quite an extensive range of approaches and tools that are available and becoming available to help project teams identify emerging issues negotiate uncertainties to articulate future scenarios and to design robust policies and strategies to tackle emerging challenges so to wrap up i just want to leave you with a question now if there was absolutely nothing stopping us right now what transformative ideas could we pursue to make these visions particularly this one on environmentally considerate outcomes a reality so with that i thank you and let me hand you back over to karma thank you thank you pam um very very interesting and sort of game changing kind of approach that you presented here and it's very thought-provoking and it would indeed be great to think about doing what we want to achieve what we want to without any boundaries so thank you great presentation and it's great that you have environmentally considerate outcomes as one of the visions included in the in the foresight study um so we will now move on to the closing part and i will i would like to invite bruce bruce dunn um to give the closing remarks so bruce uh he's my director he's a director of the safeguards division in the sustainable development and climate change department in adb he leads a team of dedicated dedicated to ensuring the implementation of environmental and social safeguard policy principles and good practices in adb operations bruce's current rule builds on more than 20 years of experience in environmental impact assessment environmental policy biodiversity conservation and natural resources management working across asia and the pacific at adb he has previously served as the chief of the environment thematic group a leading adb's proactive agenda on environment including the implementation of adb's healthy oceans action plan as well as spoken point for the global environment facility so with that uh bruce can i invite you to please give the closing remarks thank you so much karma and hello everyone so this was a really interesting session and i really want to congratulate all of the organizers and the resource persons for successfully undertaking the webinar series and of course to thank all of you as participants for joining and i do sincerely hope that the session will be valuable for your future work now personally as carla has said i've i've been involved in environmental impact assessment and and i'm an ecologist by training so i found the approach is presented to be very exciting but also very practical you know we now have access to a much wider range of data tools and resources than ever before we're also able to you know investigate biodiversity across the landscape remotely in ways that are much more sophisticated and using modeling tools that give her a lot greater insights and obviously that that's helpful right now as we're looking at the pandemic situation and some restricted access to sites but i think it's much more than that you know these tools obviously help us supplement and support more traditional approaches you know we're used to doing literature reviews uh stakeholder consultations and site level ecological data but these tools can obviously make those much more targeted and effective but also help us to to go beyond it can help us to design better projects essentially and to uh you know move towards some of the vision that we're also hearing from pamela presenting you know the future of transport i think a few of the things that they can help us to is answer some of the wider questions um you know and these are ones you've been talking about through the training you know where in landscapes are critical habitats where is it most likely that threatened species will occur where are the most important movement corridors for species and then based on those it allows us to think through optimum locations and design parameters for infrastructure now this helps us at the project level but i want to make also a link here to the work at uh sort of sector planning or transport planning level this can really help us as we move upstream and it can help us do better planning but also avoid those scenarios where projects are proposed in landscapes that are going to have impacts that can't be fully fully avoided or perhaps not even fully mitigated and in some cases not even offset so knowing that these impacts can occur and if we can consider them at a much earlier stage in the planning process it can really help us to improve the quality of the work that we do and um i think some of you will know what i'm talking about you know i've worked in this area for many years in asia and i think some of you will also have seen these constraints at project levels where you're boxed in you might have some options uh maybe you can look at the design of overpasses or underpasses for wildlife but if you can get in earlier you really can make a big difference so you know i do hope that the increasing use of these analytical tools can be a real game changer uh for our ecological impact assessments and can help us i think as uh hirosand was saying earlier at the opening for this session uh move the transport sector investments in ways that do not come at the cost of nature now of course this is really important uh some of you will be aware that we're already well into what is being referred to by scientists as the sixth mass extinction crisis for biodiversity and also beyond uh what professor johann rotstrom and others are talking about uh planetary boundaries for biodiversity uh we need to start to move uh you know sort of into a safe space for humanity where we're not compromising the ecological services delivered by nature and what this means moving forward is that we have to transition to a stage where we can achieve net zero loss of nature now we talk about no net loss of biodiversity at project levels but we need to move to a much wider level of you know net zero loss of nature at society in the same way that we're seeking to transition towards net zero greenhouse gas emissions to address the climate crisis so you know let's see your participation in this training and the adoption of these newer more sophisticated tools as a timely opportunity to kind of step up our joint efforts at addressing some of these uh you know local but also global challenges now at adb this is something we're thinking about a lot uh as karma mentioned i'm leading the team that is uh responsible for our safeguard policy statement and we're currently in the process of reviewing this we plan to update the policy by march 2023 and as part of that we're really looking carefully at our existing requirements for biodiversity and how we can enhance biodiversity impact assessment and management so again i think these tools really can offer us some good insights into how we can go about that in addition of course data management is very important and we're currently developing what we're calling an integrated safeguard information management system and i think better data around biodiversity uh can certainly feature into that system helping us to to track uh our projects at a more sophisticated level than we've ever had before plus uh we're exploring ways to systematically store project data in ways that can be more easily accessed and reused in future projects and you know i think many of the projects that we support and finance and projects that governments are working on create these great data sets for biodiversity but they usually stay at the project level they're not being shared more widely and they're not influencing uh further work around biodiversity and landscapes or the design of future projects so this is something we can improve on and i think the the online hub and the data dashboard created for this training it was demonstrated in the previous module shows that this is very much possible so it's something to build on and incidentally for our participants today i understand from the organizers that the online hub will remain open for the next couple of months so i would encourage all of you to continue exploring the hub and trying to use uh the tools that have been demonstrated in this training in your own projects and you know moving into the future uh you know we'd certainly be interested to work with you and support the use of these tools within the projects that adb is helping to finance and also picking up these tools in uh work with our developing member countries uh moving forward so looking ahead um it's great training i feel really hopeful and with the increasing use of this sort of modern roto-collages toolkit and with all of you starting to use these tools i think we can do better and we can certainly uh improve the design of transport projects you know effectively for both people and nature and that would be a win-win scenario so with that i'll hand back to you karma to close things out and thanks very much take care thank you bruce um yes uh there is still a lot of hope and we will continue to organize uh these kind of uh trainings um so before we close i have to thank all the people who have been working behind the scenes to put this training series together webinar series together from the uh environment uh thematic group team we have a christa bunger cecile velena victor tamilba isawa endo and aguado so thank you so much to my colleagues who have been working behind the scenes consistently and coordinating with colleagues in other departments um from the transport sector group uh thank you pam your pam is the lady who presented today uh thank you to noel and diane for helping to um to spread the word on this training amongst the transport community uh and thank you to our colleagues from the it department and a big thank you to our colleagues from the department of communications uh that's why we have this great website with all the information on the webinar series and all the presentations and recordings uploaded all neatly in one place um so we have shay real neil and april uh thank you very much and uh so the i think we've already shared the recording and the link to the dev asia page which has all the information material and in turn uh ben will be helping to also add a link to the hub a link to the training page uh within the hub website uh and a very big thank you to our uh three resource persons clara tony and ben uh excellent presentation excellent discussions and uh last but not the least to our audience and participants uh thank you very much for all the interesting questions and and um hanging on and sticking there i know some of you uh participated in module one module two and i still see you today so thank you very much uh and last thing i would like to inform you uh this is in reference to what bruce had mentioned on the hub so the hub page will still be live and active for up to next a few months maybe six months it really depends on how much demand there is so we invite you to please uh continue to try the exercises and actually there is an exercise three that has been posted which links to the demonstration that was done by clara and ben today so i invite you to please continue trying out the tools and apply it to your projects that would be really great if you can try to apply the tools to your project and uh ben will be adding a contact us a tab on the hub so if you get confused or stuck with anything you can still reach out to them and ask them for help so we look forward to seeing uh some some of you uh doing some of the exercises and seeing some maps being uploaded in the hub um with that uh thank you again to everybody i really enjoyed uh these webinar series and i learned a lot throughout the process and uh and yes one last thing is we will be sending um a feedback form and we will also be sharing um the recording of this webinar together with module one and one uh one and two and in the feedback form also we will again ask for your feedback and if you can please uh really give us feedback particularly on how we can improve and what would be most useful for you in the future trainings that we organized so with that uh i close this webinar and thank you bye bye and good night to tony and ben and uh i think it's still afternoon and morning for for other participants in the webinar thank you karma bye-bye bye-bye thank you thank you
Up Next
6:37
Wildlife Crossings: Evidence-Based Solutions to Reduce Roadkill
@Vox
2.5M views•2017-07-03

15:54
Life in Biosphere 2: Sustainable Ecosystems & Human Survival
@TED
334.9K views•2009-06-16
14:30
Microplastics Everywhere: How Plastic Impacts Our Lives
@TEDx
100.9K views•2018-05-08
10:28
Ice Stupa Artificial Glaciers: Solving Ladakh's Water Crisis
@SonamWangchuk66
3.2M views•2015-05-03
Related Study Plans & Knowledge Roadmaps
Structured learning paths in Environmental Science
environmental-science
Ocean Noise: Cetacean Impacts & Mitigation
01Fundamentals of Underwater Acoustics
02Marine Mammal Bioacoustics
03Anthropogenic Noise: Shipping & Seismic Surveying
+ 2 more learning modules
16h5 modules
Explore Roadmap
environmental-science
Road Ecology: Corridors, Overpasses & Fencing
01Foundations of Habitat Fragmentation and Carnivore Ecology
02The Road Barrier: Ecological Impacts of Transport Infrastructure
03Principles of Ecological Corridors and Connectivity Mapping
+ 3 more learning modules
14h6 modules
Explore Roadmap
environmental-science
Ocean Acidification: Kelp Buffering & Shellfish
01Fundamentals of Ocean Chemistry & pH
02Chemical Pathways of Coastal Acidification
03Bivalve Physiology & Calcification Under Stress
+ 2 more learning modules
18h5 modules
Explore Roadmap
environmental-science
Ice Stupas: Glacial Retreat & Water Security
01Foundations of Glaciology & Mountain Hydrology
02Climate Change and Glacial Retreat Dynamics
03The Science of Ice Stupas & Artificial Glaciers
+ 2 more learning modules
14h5 modules
Explore Roadmap