













![[Tutorial GEE] Analisis Fenomena Urban Heat Island secara Multitemporal dengan Google Earth Engine](https://i.ytimg.com/vi/E1LyuxX7hRI/maxresdefault.jpg)




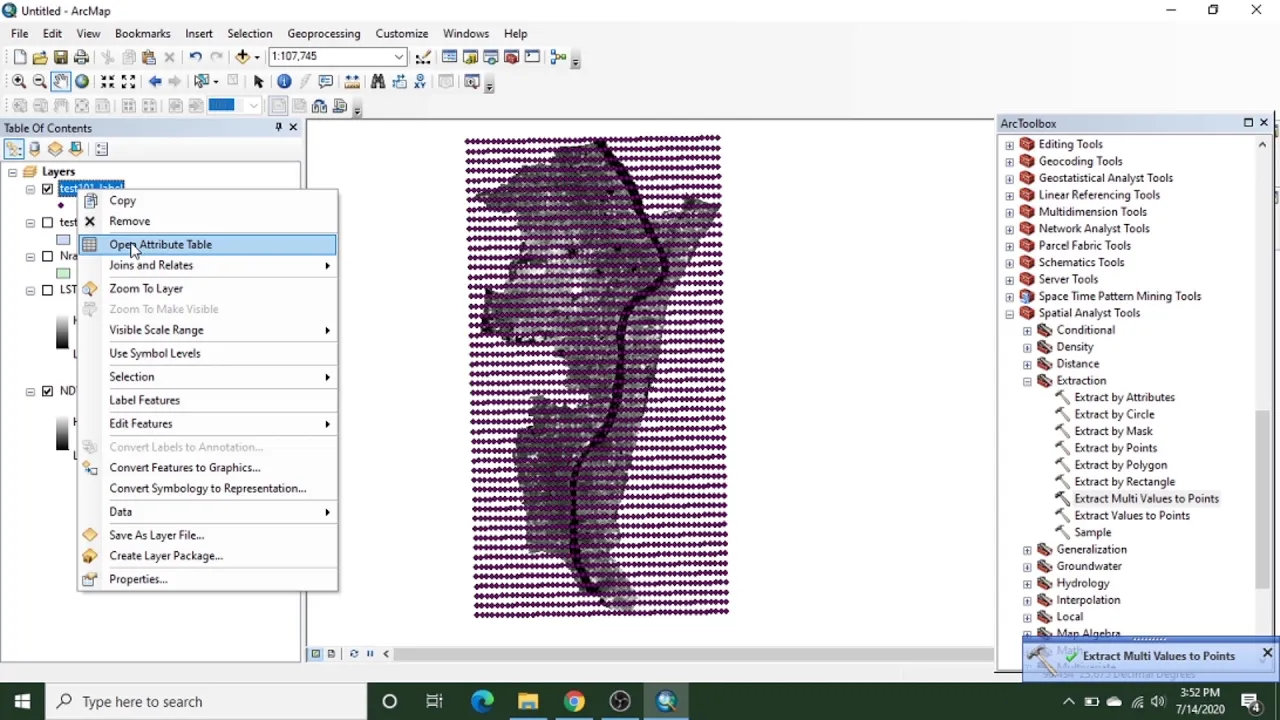
This tutorial demonstrates how to assess urban heat islands using remotely sensed land surface temperature (LST) data and GIS technology. The process involves calculating the UHI index using the formula UHI = (LST - LSTM) / LSD, where LST is the land surface temperature, LSTM is the mean temperature of the study area, and LSD is the standard deviation of temperature. The workflow includes extracting LST data for a specific area using the Extract by Mask tool, calculating statistical parameters from raster properties, applying the UHI formula through the Raster Calculator, and creating a stack profile using the Stack Profile tool to visualize temperature variations across urban landscapes.
Urban Heat Island Mapping with ArcGIS and Remote Sensing
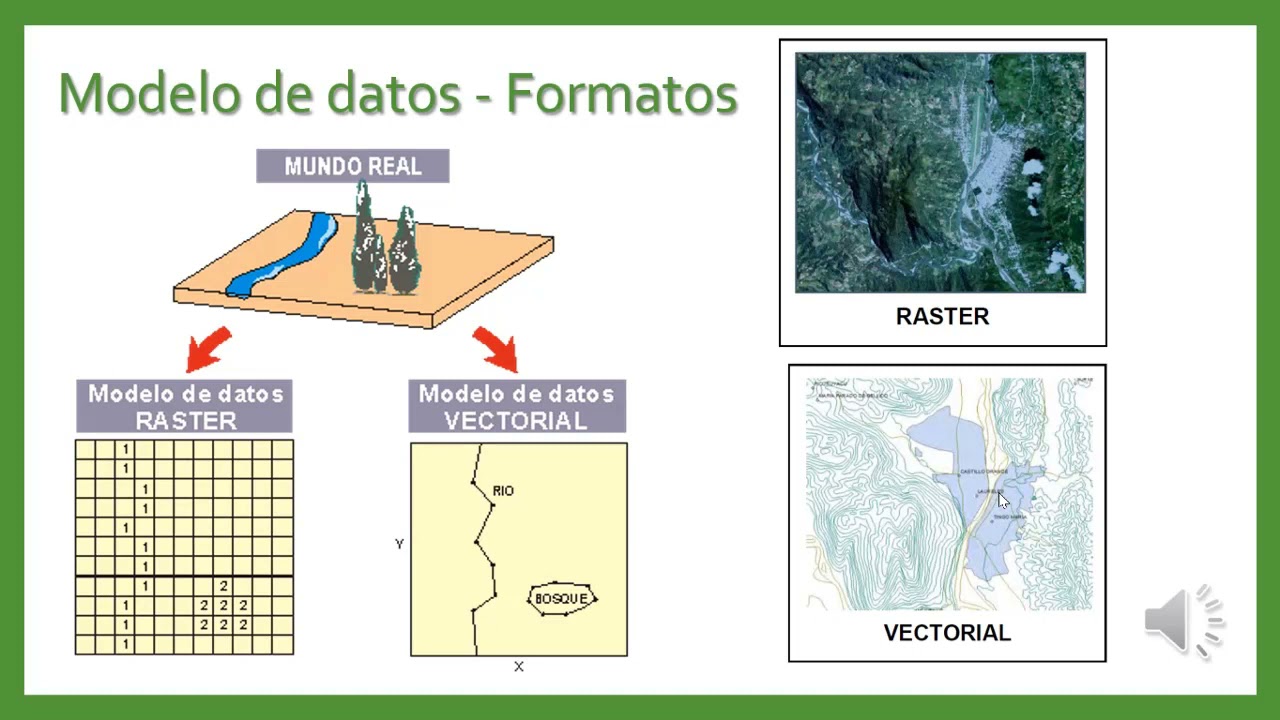
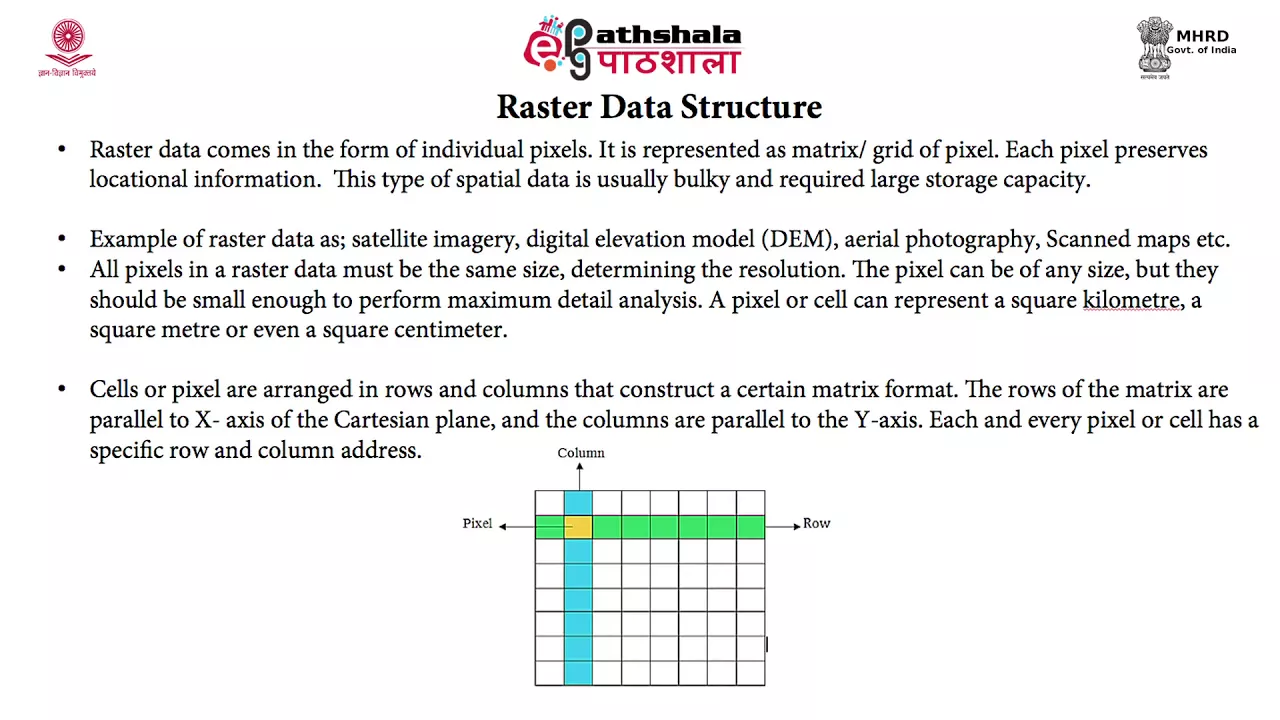
Added:Fundamental concepts of Geographic Information Systems (GIS), including raster data structures, coordinate reference systems, and spatial analysis workflows in ArcGIS.
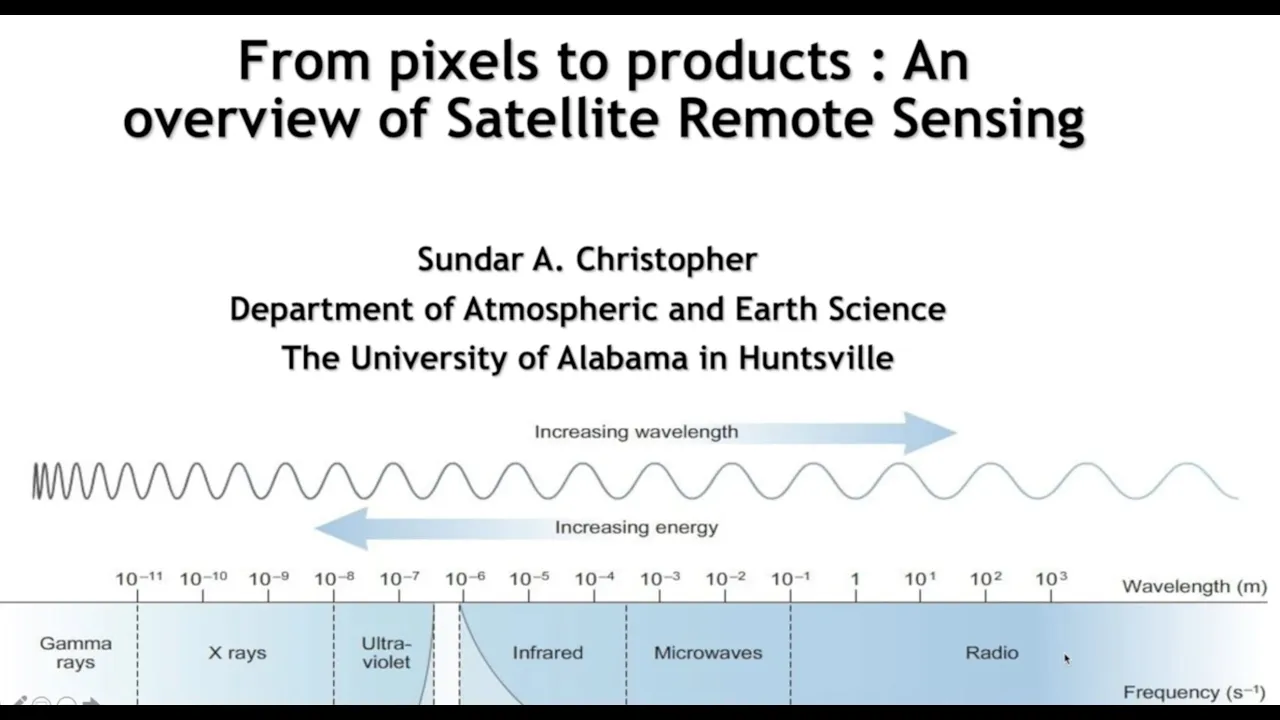
Basic principles of remote sensing, specifically how satellite sensors capture electromagnetic radiation, the role of thermal infrared (TIR) bands, and image preprocessing.
An understanding of Land Surface Temperature (LST) as a physical variable, and how it differs conceptually from ambient air temperature measured by weather stations.
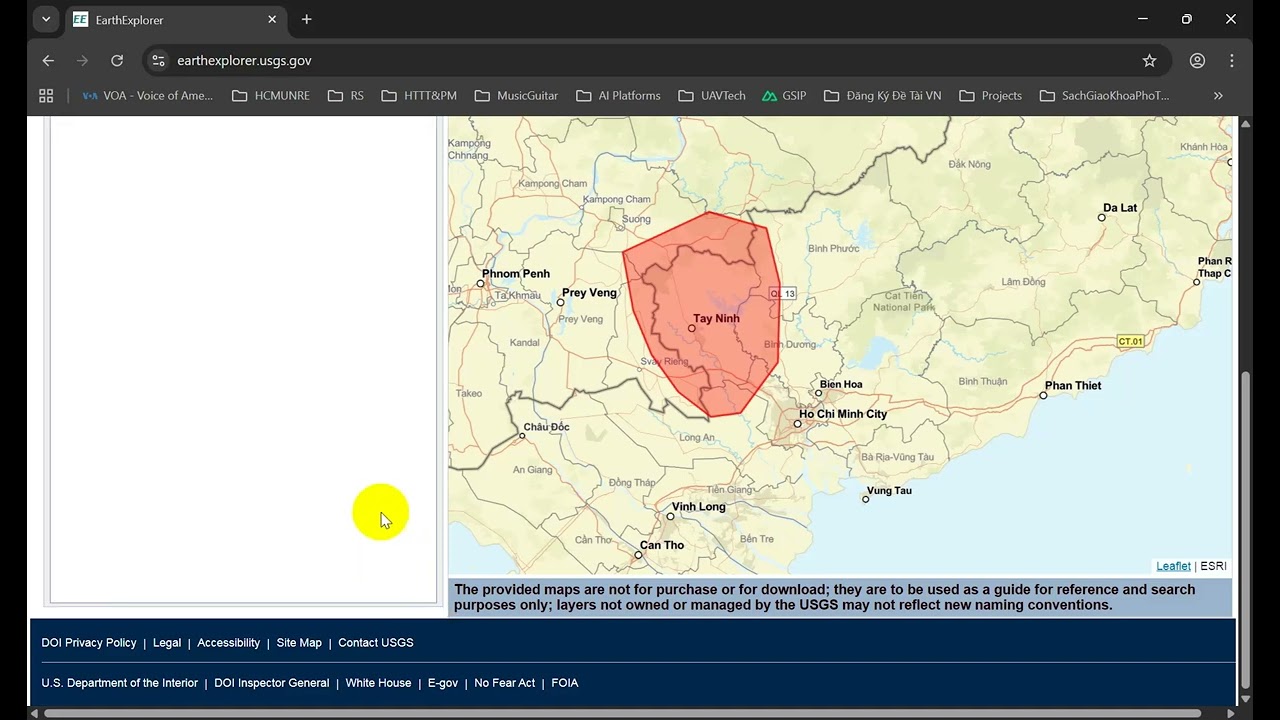
Familiarity with the Landsat satellite program, including its band designations and the process of sourcing open-access imagery from repositories like USGS EarthExplorer.
Analyzing the statistical relationship between LST and surface characteristics using spectral indices like the Normalized Difference Vegetation Index (NDVI) and the Normalized Difference Built-Up Index (NDBI).
Developing Urban Heat Vulnerability Indices (UHVI) by integrating socioeconomic demographic data with physical heat mapping in GIS.
Conducting multi-temporal and seasonal thermal analysis to track how rapid urban sprawl and land-use change affect microclimates over decades.
Evaluating the cooling effects and spatial influence of urban green infrastructure and high-albedo materials through microclimate modeling tools.
37.9K views690likes10:40Original Release: 2023-05-19
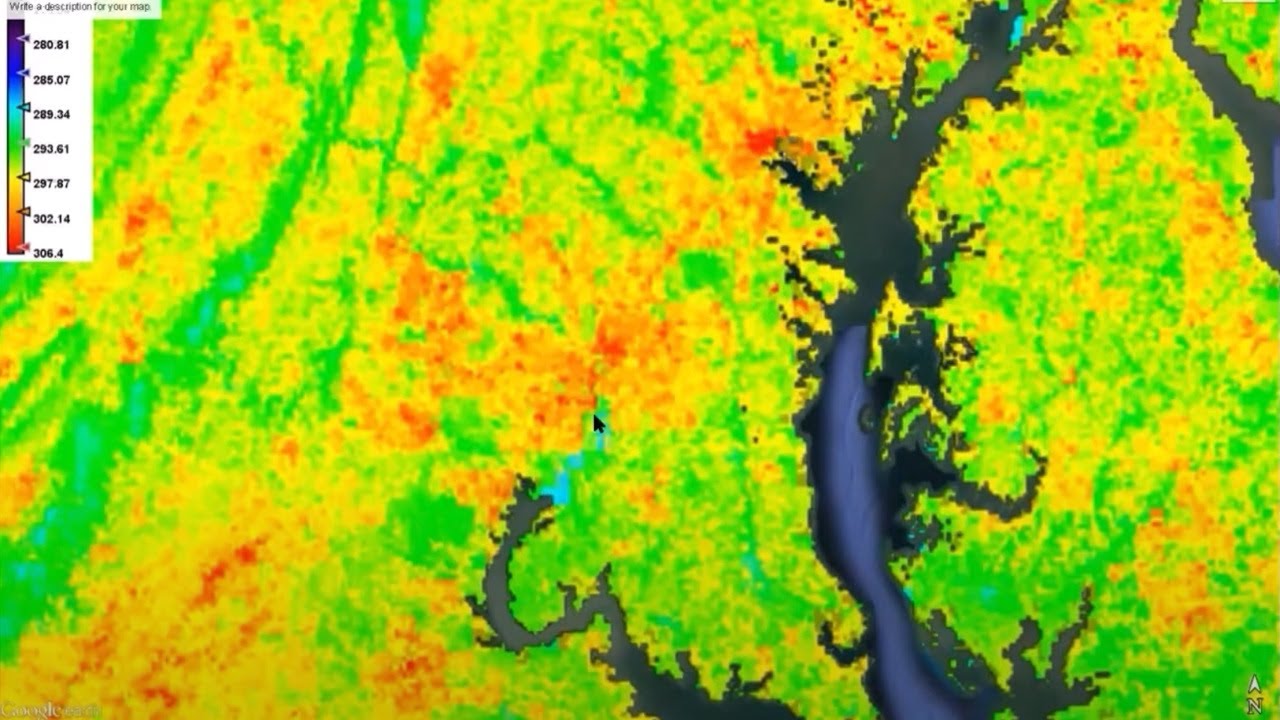
hi everyone welcome to JS and rs solution YouTube channel I hope you all are doing great today we have an exciting tutorial on how to prefer an urban heat Island map and create an urban heat island stack profile for our district in Bangladesh for instance um the process is straightforward so just follow along I have shared the documents Link in the description section which provides step-by-step guidelines additionally I have included the data used in this video moreover you can find a reference paper link on Urban heat island in the description section as well uh I hope you will find this tutorial useful without further Ado let's get started here you can see land surface temperature map Urban heat island and arborhead Island profile Urban heat island refers to the phenomenon where urban areas experience higher temperature due to human activities and the build environment there are several causes for this harmony Thailand you can see here also how we can calculate turbine heat island using arcgis here is the equation you can follow this equation and here uhi means Urban Italian service temperature lstm that means mean temperature NSD standard deviation we need all the data to prepare Urban heat Islands map here is the lens service temperature map you can see I have already prepared this air surface temperature map and here is the step-by-step guideline you can see here how two people and surface uh temperature using landsat 8.
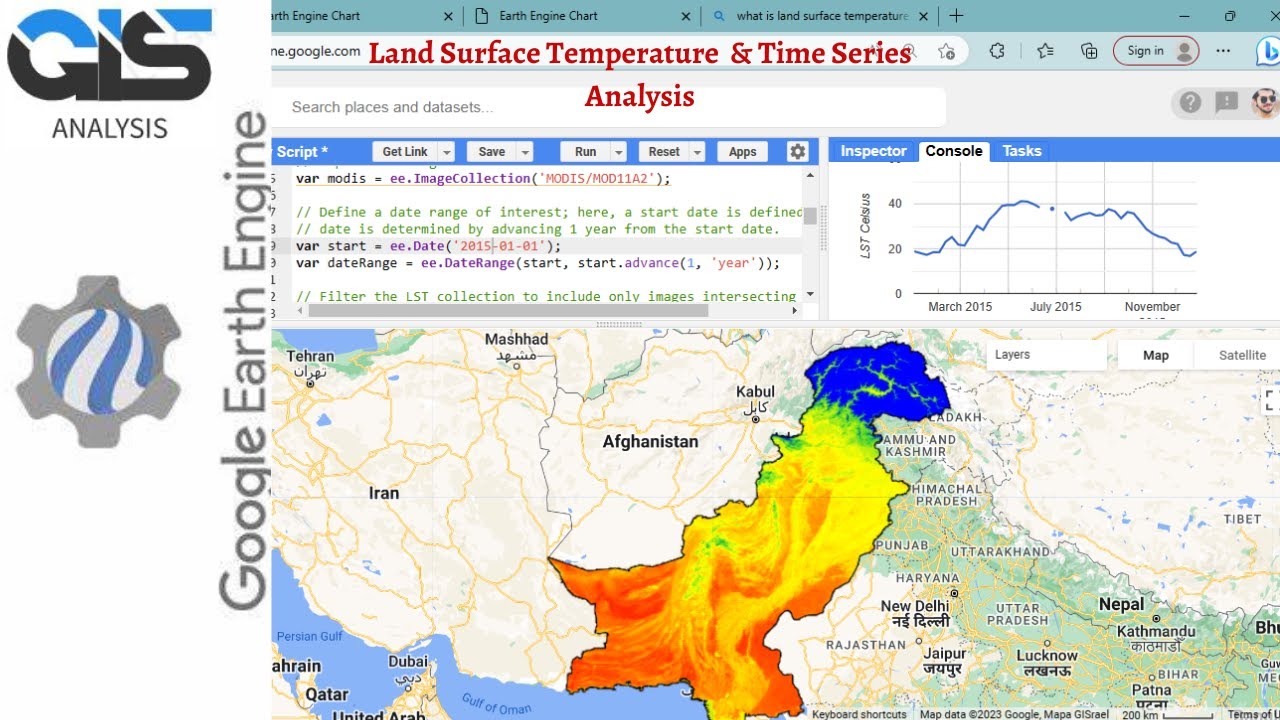
the easiest steps just you have to follow the steps as I have already prepared land surface temperature or map so uh that easy steps you will find from my channel just go to my channel and right here LSD inserts and you will find here two tutorial about LST uh first on land surface temperature your lens 38 using landsat 8 uh just you will find this tutorial is very uh helpful I think so we need this land surface temperature map uh to prepare Urban heat Island map for an area just follow that tutorial uh here you can see my land surface temperature that I have already prepared and now I will extract uh let's surface temperature uh as per my study area so first uh go to uh special analysis tool and extract by mask input roster will be length surface temperature map total processing extent it will be default and raster analysis uh mask it will be a start area then click ok output raster you can save output raster uh you know folder in your PC and then okay so here is the land surface temperature for my study area so I have just renamed this LST aoi I mean area of Interest or you can save it any in any name I will change the color you can change the color so let's surface temperature this is the lens surface temperature now I will prepare a urban heat Island map using this equation you can see here LSD we have already prepared this map and we need a mean temperature of the land surface temperature and standard deviation of temperature so where we will find this data just go to the LSD and go to properties and here go to source scroll down and you you will see here mean LSD just copy this mean LST and paste in notepad or or or just mean value I have pasted this mean value from the LST and standard deviation of temperature so again I'll go to arcgis and then standard deviation I'll copy this and paste here this is main temperature and standard deviation of temperature so we have found all the required data to calculate so our body heat island go to a special address tool and map algebra Master calculator and here raster calculator just first we have to input LSD I mean land surface temperature so yeah uh LSD and minus lstm I mean mean temperature of the land surface temperature of mastered area so mean value is on copy and paste here and then divided by standard deviation I will copy this and then paste here so after that output raster you can save your product in any folder of your PC and then click ok so we have uh we have got Urban heat island go to properties and then go to Simply symbology and you can change the color so we have we have uh we got our body Talent map high value and low value of urban heat island and after that we have to create Azure file so I have already created a folder named uhi and from that from here I will create a polylation file I'm giving the name Urban heat island profile and feature type will be polyline and then foreign for my zone it is 46 North you have to go to projected coordinate system UTM and then wgs984 for my zone it is uh wgs 9080 for UTM John 46 North and click ok so I have created Urban heat island profile uh polyline so using this polyline first we have to start editing okay and then go to create feature [Music] first I will create a polyline here I'm going to create a carbon heat island stack profile say edit and stop editing and after that go to our toolbox or 3D analyze tools and here you will find functional surfaces and from functional surface you will find a stack profile so stuck add uhi profile I mean urban heat island profile uh as input line feature and profile targets will be the arbor heat island uh um uh map and so I have added an output table you can save your output table in a new folder of your PC and output graph name optional it is optional so um anyway I'm going to rename it as a uhi stack profile then click ok so you you can see here you can see over here Urban heat island strike profile so here is the temperature and this is the distance so Urban heat island grab profile uh I have created uh you will uh you will you will find from the open entry Open Table the total of temperature and distances from here I think is this very uh easy steps to uh create Harbor heat Island map and hit Islander profile and you can save this graph as different format jpg GIF and PNG and so many formats and then you can save now you can create the map layout according to your preferred design I have so many videos that have shown the preparation of a map layout you can follow those videos for guidance in another video I will demonstrate how to perform the urban thermal field variance index which is a utfbi model is in address anyway if you like my effort please like share and subscribe this channel stay safe and stay healthy bye bye
Up Next

17:14
Evaluating Urban Heat Maps and Models for Planning
@UACLIMAS
175 views•2017-10-06

15:54
Life in Biosphere 2: Sustainable Ecosystems & Human Survival
@TED
334.9K views•2009-06-16
14:30
Microplastics Everywhere: How Plastic Impacts Our Lives
@TEDx
100.9K views•2018-05-08
10:28
Ice Stupa Artificial Glaciers: Solving Ladakh's Water Crisis
@SonamWangchuk66
3.2M views•2015-05-03
Related Study Plans & Knowledge Roadmaps
Structured learning paths in Environmental Science
environmental-science
Ocean Noise: Cetacean Impacts & Mitigation
01Fundamentals of Underwater Acoustics
02Marine Mammal Bioacoustics
03Anthropogenic Noise: Shipping & Seismic Surveying
+ 2 more learning modules
16h5 modules
Explore Roadmap
environmental-science
Road Ecology: Corridors, Overpasses & Fencing
01Foundations of Habitat Fragmentation and Carnivore Ecology
02The Road Barrier: Ecological Impacts of Transport Infrastructure
03Principles of Ecological Corridors and Connectivity Mapping
+ 3 more learning modules
14h6 modules
Explore Roadmap
environmental-science
Ocean Acidification: Kelp Buffering & Shellfish
01Fundamentals of Ocean Chemistry & pH
02Chemical Pathways of Coastal Acidification
03Bivalve Physiology & Calcification Under Stress
+ 2 more learning modules
18h5 modules
Explore Roadmap
environmental-science
Ice Stupas: Glacial Retreat & Water Security
01Foundations of Glaciology & Mountain Hydrology
02Climate Change and Glacial Retreat Dynamics
03The Science of Ice Stupas & Artificial Glaciers
+ 2 more learning modules
14h5 modules
Explore Roadmap