





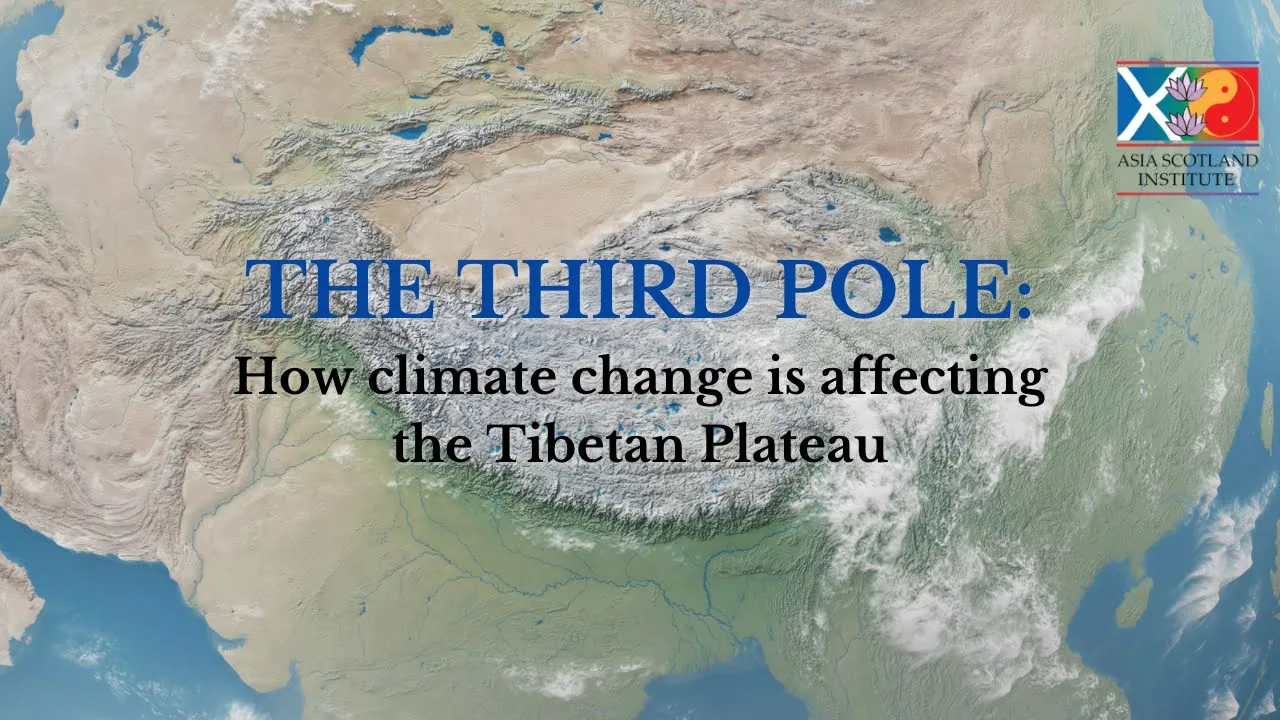












In pristine high mountain Asia river systems, climate change is causing dramatic increases in riverine sediment flux, with temperature increase contributing 65% and precipitation increase contributing 35% to this rise; the Active Contributing Drainage Area (ACDA) concept explains how seasonal temperature variations control sediment dynamics, and while pristine basins show increasing sediment flux due to enhanced permafrost thaw and glacier melt, marginal areas with cascade dams experience sediment trapping that fundamentally alters downstream geomorphic processes.
Riverine Sediment Load Responses to Climate Change in High Mountain Asia
Added:Fundamental concepts of fluvial geomorphology, including erosion, sediment transport dynamics (suspended vs. bed load), and deposition processes.
The hydrology of glacierized catchments, specifically how temperature changes affect glacier melt, permafrost degradation, and seasonal runoff patterns.
Basic geography and climatic characteristics of High Mountain Asia (often referred to as the 'Third Pole') and its role as a major water source for Asian river basins.
The basic function of dams, reservoirs, and deltaic systems, including how they interact with riverine sediment and water flow.
Advanced predictive modeling techniques (such as climate-glacier-hydrology-sediment coupling models) to forecast future sediment flux under various emission scenarios.
Engineering and management strategies for mitigating reservoir sedimentation, such as sediment flushing, bypassing, and dredging in alpine regions.
The downstream ecological and socio-economic consequences of altered sediment loads, including delta subsidence, loss of agricultural soil fertility, and coastal vulnerability.
Transboundary water governance and policy implications, exploring how changing river dynamics affect international water sharing agreements in South and East Asia.
245 views7likes1:06:07Original Release: 2021-02-25
no problem okay are you ready let's start i see you like yeah hello uh good morning and uh good afternoon and good evening and uh i warmly welcome you to this world river and the delta system the source to sink of webinar series and today we invite a professor Xixi from national university of singapore and his phd student dongfeng lee come here talk about the global warming impact to the himalaya mountain area so the riverine sediment load response to climate change in that high mountain asia area so before i introduce uh xi and the dongfung i want to mention that this coming friday this coming friday uh we have uh um uh uh other talk uh uh given by Uisdeand Nicholson from uk he will talk about another very interesting river the Amur river or the kylong jiang river this is the river between the asia the china and russia uh as i mentioned last week this is the relatively unstudied river we we know a very little about this river and the delta system so please mark your calendar coming here this coming friday the same time and she is uh as i mentioned the professor in the national university of singapore and he got his ph.d from university durham and department of geography and so he's a co-editor senior for journal of topical geography associate associate editor of hydrological process editor board of earth surface pro of process and landforms shishi is a physical geographer with research and teaching experience in fruitful geomorphology particularly in the river sediment and the carbon flux in large asia river system like he has been started studying the yellow river uh the yangtze river the pearl river battery were the mekong the solar and the and he organized co-organized the many workshops and also gets the editor for the quaternary international and don phong as i mentioned is last semester phd will get a phd very soon and don is also a very active uh promising young fellow he has already published the five leading author articles in a very well uh known journals like drl w water research and espl you know geomorphology etc so i think i already talked enough so now i want to give that uh the flow to professor hishi please share your screen and for the presentation mode yeah go ahead okay okay can you see yeah it's good yeah although it's not a full screen now i understand yeah sorry about that anyway thank you um paul uh for your introduction uh as uh paul mentioned today's talk will be uh shared uh with my phd student dong foong actually he will talk the most of the slide i i just talked at the beginning around the 10 10 slide the topic for today's talk is the fluvium sediment resemblances to climate change in higher high mountain asia this is also a new project i just started this year and founded by the ministry of education in singapore so where is the higher mountain asia i don't know if you have a heard of this uh name or term basically uh this area refers to um tibet plateau and it's a slothing uh mountains like himalayas and uh hindu kushi and the karakoram if you move to the further northwest and that's that also include the tsr mountains okay and as we know this is a hard water region or for many interesting rivers particularly for our wow do you think you can cover the whole thing if you can let's let's go ahead do it and okay yeah i will have a try yeah if you log in there we give him a chance to talk to answer the question ready okay thank you thank you i really really sorry for the technical issue and i will try to pick this uh this is nice and i will share my screen yeah go ahead okay go ahead i see yeah yeah okay thank you uh hello everybody i'm doofen and sorry for the technical insurance thanks for all for giving me the chance to to speak and i'm still a student so please feel free to interrupt me if so if you have questions uh she has mentioned that the the our study area is focused on the high mountain asia it is a new term but it is basically located in the tibetan plateau and also the surrounding high mountains including the the himalayan from blind mountains into kush tension so we know that from this uh sediment bible we know that the asian rivers are very important in terms of the land ocean sediment transport so and we also know that the mountains are often the most important sediment sources and therefore we can see that the high mountain asia they are globally important in terms of the global and ocean sediment transport so that's why we study this focus on this area and the actually the monkey asia is uh the climate change here is very fast for example uh the climate warming is warming at a doubling rate of the global average since the 1950s this is because of the high elevation effect and the precipitation here is also overall increased especially after the mid-1990s uh so because of the fast climate change we can see there are many studies awesome studies that they have look at the climate change issue and also the glacier glacier is melting and the snow snow cover is melting and also the permafrost is slowing and releasing carbon to the atmosphere and the water cycle is also changing for example in this paper professor loss and in mozilla they report that there will be a consistent increase in the asia's run-off due to the increase inflation melt and the precipitation uh to 2015. so when in 2017 when i started my phd project i i was thinking how modern climate change can affect the fluvial setting flux in high mountain asia this is my this is the overall fundamental research question for my phd project well this figure shows the the how the climate change they can they can alter they can alter the ela here is the equilibrium altitude and the periglacial processes will occur after racial retreat and the sediment flux will increase and our study area is is focused on the headwaters of the in the high mountain asia most of the patients are as rich permafrost dominated but they have a very a small coverage of glaciers in the upstream uh ghost go go through this because uh it's that are not my here okay so there are basically there are three specific research questions uh basically there are three specific question the first question is for the code pristine high water reverse and we hope to ask uh what about the sediment source and the seasonal sediment dynamics for for the code pristine river that are underlined by both glaciers and also permafrost and what about the long-term change of the sediment flux is there are increase due to climate change and what about the drivers and so for the third question is to is to to try to ask can we just distinguish the impact of climate change uh from human activities because you can see that in high mountains asia's margin uh in the marginal area there are many many banks that have been built and some of them are being being constructed or being planned uh let's focus on the first case study area it is located in the head water of the yachts river it is the true headwater of the enzo and the todoho highway basin it is a high altitude region elevation range from 50 uh 4500 to 6600 meters above sea level and it is a monsoon-dominated base and a pristine basin there's no human activities no dams no water transfer project so it is a perfect place to look at the climate change effects uh the data we use is from this protocol station tdh station it is located in the basin athlete uh so to my knowledge it is the world's highest long-term sediment gating station for the undisturbed coding environments and the data here is really awesome it is it has the daily discharge and sediment concentration data from uh since 1985 so that is really awesome and one point i want to say is that they only matter data from may to october during the math season because in other monthlies the the river is largely frozen uh the basin as i have mentioned that it is a permafrost dominated basin but in the very upstream there are two percent coverage of glaciers and here you can see the thermal issue features in awami permafrost landscapes including the thermocourse lake solid fraction the active layer detachment thermal garlic and the sauce lamps so here i want to say that the channel connected exhaust lamps are really really important setting sources for this patient based on our view work and in addition to the glitches nomad and the beneficiaries are also important the same source they can produce both fan green sediments and also the coarse green sediments the river pattern here is the the river pattern here is the breeded river systems and with well developed floodplain and now let's look at the results the figure shows the monthly variation of the discharge sediment concentration and also sending flux we can see that most of the discharge and sediment constant sediment flux occurring in the two months of summer during july and august followed by june and september uh one point we can see that in september the discharge is still relatively high but the sediment concentration in september is is much lower and from the written curve the discharge sediment relation we can also see that uh the discharge sediment concentration relations they change throughout the season for example in september you can for the equivalent uh this the level of discharge the standing concentration is much lower than uh than other other monsters and this is related to the permafrost saw seasonal salt processes and i will explain this later don't worry do you can you use your mouse to point out the data the curve you are talking about and i also speak a little bit slowly pretty good slowly and because too much information we cannot catch up okay thank you thank you thank you so in this study we we we proposed a a new concept it is called the active contributing drink area it denotes the unfrozen irritable landscape that contributes runoff and sediment processes within a coating environment so basically the active drink area it is defend the area below the freezing land altitude so in our basin uh during spring the uh fla fleeting land altitude is roughly here so below this area is is classified as the active drink area and in summer this land will go go upstream you can see that so most of during this time during the summer time most of the uh the basin are engaged in producing ground orphan sediment and in autumn this land we will go downstream so only a small fraction of the basin are the active drink area so if you look at the figure you can see that the red figure you can see that the relation between the acda the active print area and the discharge and also sediment flux you can see there's a very good correlation between the monthly monthly ecba and the discharge and sending flag so we can see that the acda is our first order control of the of the monthly variation of the discharge and the sending setting flux for this code reason and so what about the specific underlying uh processes in this in this basin so in spring mostly it is dominated by uh snowmelt processes for example here the bottom figure shows the the hydrographs of discharge and also sediment concentration uh we here we identify the five sediment process so the first one it is caused by insecurity inspiring in june it is caused by the snowmelt during processes it is clearly seen by the snow cover that you can see that during this time the snow cover reduced it suggests that the melt of the snow pack and with associated with the temperature increase the green lane here the second second course is in summer is caused by uh the the second setting pause is uh caused by the uh the rainstorm events so you can see that during during this time it corresponds well with the uh the the rainstorm events rainstorm events is defined you know case is defined as the top one person there of all the presentation uh data over the past three decades so you can see above the 15 millimeters so you can see that this corresponds with well it is driven by the rainstorm events that can can produce the elements through both the conventional uh slope wash and mess with team and the third third and fourth parts you can see that during this two periods the precipitation the green bar here is very low and by the temperature is very high so they are caused by the thermal driven geomorphic processes for example the glacier melt the permafrost the source lamps and the thermal valley processes in this study we also explained the impact of active actively active layer free source cycle on the discharge and sediment concentration dynamics for example in the bottom bottom red figure you can see that from may to august the uh with the increase of the temperature the both sediment concentration and also discharge they increased from mid to august and this is uh associated with the increase of the hormone forest actively and actively is the top layer of the property of the permafrost at that source during the summer and refreezes in the wintertime however if you see the data you can see that from august to september there is a shock reduction of the sediment concentration and this is caused in september in the late source season but actively reaches its maximum and during this time the top layer of the active layer becomes dry because there are more infiltration and and so so during this uh um the little sauce season the run of freedom it is a underwater dominated regime so which means there are less uh surface flow and less surface usually so the sediment concentration is very low uh we also explained that that the rainstorm event is often determines the ssd event the peak assets the events is also defined as the top of one percentile of all the sediment concentration data over the past three decades for example in 2008 you can see that after uh five days rainstorm events uh it triggered uh uh historical sediment concentration peak it is 7.4 kilogram per cubic meter this number is really relaxed and it is comparable to many large rivers i think and historically most of the big access events are driven by the rainstorm events and followed by glacier permafrost melt and snow melt okay now let's move to the next question we look at the long-term change of standing drugs now the data here shows that the long-term change long-term data over the past three decades from 1985 to 2017 the precipitation temperature ran off and also sediment flux so we can see if we use a petty test it is a statistical test that you can give you there is abroad change after 1997 so if then we have two periods to compare the best land periods be before the 1997 and the change period after 1997. if we compare the two periods we can see that the runoff increased by 80 percent and the selling flux increased by more than double or 135 percent so this this figure is really alarming it reflects how how fast our landscape is changing and the change of the landscape changing the landscape can be reflected by the fluvia sediment flood state and this is a in response to the warming climate and also the wetting climate uh here in our case the temperature over the past three decades increased by uh one point plus 1.5 degree and precipitation increased by 30 percent so if we compare our update with the global global studies we can see how unique our data side is for example in this work led by nathan and also professor stewart lin they they said that we know a little about the effect of modern climate change on the landscape and the decadal time scale because the complex non-linear and the pathway dependent nature of the response of a landscape too climate change and also because of the difficulty of quantifying spatially distributed impacts at the tenth year of decade to centuries so here the conclusion they say that the landscape response to climate change is not necessarily reflected in the valley but in the valley system processes and the on sediment disease and another study lead by m east they they look at the geomorphic demographic and sedimentary effects of modern climate change in the western u.s so here their conclusion is that they found the evidence of climate change on the slope stability so there are more slope instability and also the increased airline activity however they according to their data side according to the usgs website they don't have the they don't see the increased sediment cloud signal uh based on their debt side this is uh likely because most of the basins even the water basins they are disturbed by the human activities and in the russia arctic we can see that uh here they have the 68 six decades data and most of the data they don't show our increased signal about for this culinary version it shows us uh increase but also they attribute to this increase to the uh the good mining activity so also there are permafrost throwing uh processes but the human activities strongly disturb the signal so we can't one hundred percent sure say this is caused by the climate change and in the arctic for example in the greenland and the antarctic uh there are also awesome studies to look at the glacial resolution due to climate change however we know that so far there are still no long-term observed studying fraud state in the greenland and also the antarctic so here i want to say compare with the global studies our data is really really unique and it reflects how how modern climate change can change our landscape so fast and so how can how climate change can increase the fluid sediment thrust on the one hand temperature increase over the past three decades can expand the the acda the yoga landscape and to allow more to a lot more uh someone preview-driven geomorphic processes within the code basin and also in our case we also found that over the past decade that the windstorm events are increasing uh for example you can see that most of the uh and more room form events have triggered a more fluvial extreme events including more extreme sediment concentration and also more extreme discharge events the remote sensing date also showed that the source lamps are increasing for our for our study area led by professor in the landfill university and here i want to see that the the source lamps for the permafrost basin it is really large scale and several tests most of the time they can some of them they can the spatial skill of the source lamps can can can be several kilometers or even bigger so once they are connected with the river channels they are very important setting the source and actually here is the video i haven't i'm not sure i can i'm not sure whether you can see all the landscapes are changing it is in the headquarters beyonce river is a it's a permafrost basin on a slope you can see how how the landscape are changing due to climate change and in this event it is called the earth flow and it destroyed a car and also a house nearby okay so based on our understanding of the these sediment sources within the basin and also the seasonal underlying processes and also the long-term change of the sending flux we propose introduce this conceptual framework to better uh explaining how modern climate change can and influence the fluid sediment flux so basically with the temperature increase it can enhance the glacier melt thermodriven geomorphic processes including glacier ratio clamps glacial issue aberration and also permafrost soil erosion and snowmelt issues and with more precipitation it can enhance the slope wash processes and also mass wasting and you know in our basement with uh in you know warming and watching climate the drought is also increasing so it can cause more bank intrusion and with all the buffering systems within the basin we can see that we can see that the the sending flux is increasing very fast within this space so if we know that temperature and the precipitation are the two fundamental factors that influence the fluvial sediment flux so if we want to know the quantity of relationship our data shows that the sending flux they increase nonlinearly specifically it is an exponential correlation between sediment flux and the temperature and for the precipitation it is more likely a linear correlation between a precipitation and sediment flux and in this study we also we also introduced the uh uh attribution method to hopefully we hope to quantify the relative impacts of precipitation and temperature we hope to know that the increased setting flux is caused by more cost more likely cost by the thermal driven processes or more likely caused by the preview driven processes and there are three steps to to do the attribution i will not go details but if you are interested you can you can go to paper but i will show the result shows that uh here in this figure all the figures in on the loops are the contribution a contribution to the setting of sediment flux and also the contribution to the increased runoff and also increasing increase the sediment concentration so here our result shows that the temperature increase is the major cause for the increased setting sediment flux it contributed to 65 of the uh increased sediment flux and the enhanced precipitation they contribute 35 percent uh implication for the future so um well this study i lead by professor wonton published the this year you need to kind of change the based on the climate scenario uh at the predict and also the hydrological model they project that's the uh for this uh the appliance river that the total runoff they will continue to increase uh throughout this 2100 throughout this century so the here the big runoff is not a peak butcher here water is the visual water here the big round off is the peak annual total rain off so they will continue to increase continue to increase beyond the 2100. here our we our hypothesis that the peak settlement will arrive a decade two centuries later than the off we can we explain this by the as a periglacial concept because you know that when the glacier retreat um there are a lot of materials left by the facials that are easily to be mobilized by the through lumia processes and also mass wasting processes so these processes after the degreation is called the paraglacial paragraph the progression proposed by charge ito and unless the progression processes in many study readings had they have they have that these processes can last centuries or even thousands of years we think that the peak segment will arrive much later than the total runoff so here we and our data is our hypothesis is also supported by the recent modeling study in irani so from her from sorry from his modeling studies that you can see that here you can see models all the posted runoff and also the sediment flux over over the next 100 years you can see this chart is roughly here in the 40 next 40 years and by the is in the next hundred years the same segment flux they continue to increase so uh with this hypothesis that that the setting flux will continue to increase throughout this century throughout the tunnel 2100 based on this drive model we predicted that the future sediment flux uh in the in aprilians river at the shubu station and we choose this station because it is above this station so far there are still no dams and but below this station there are several dams that have been constructed and we can see from the historical data the red line is the the sediment flux data over the uh since 1960 it is increasing drastically and we predict that uh over the next eight years from 2020 to 2100 there would be 5 800 million million ton sediments that would be trapped uh behind the dams downstream of downstream of the sugar station the hypothesis is that there will there would be no dams above the shugo station yeah uh now let's move to the next question is to uh just try to look at how can we distinguish the impact of impact of climate change from human activities because you see that in uh in the marginal area there are a lot of dams have been constructed and we focus on the jinsha river it is the aprilian river one part of the aprilia's river we chose this station because this is a river ginger river because historically the jinsha river is the largest sediment source way latest sediment source in the yangtze river historically transports roughly from the black dots you can see that roughly 300 million ton segment per year however after 1999 when the archendam begin operation the sediment flux you can see from the ginger river they reduced significantly and after 2012 when there are more big banks some chinese colleagues know that the the bachelor tandem and the abaddon or shiloh to them they are super large than them on the main mainstream of the ginseng river so after 2012 uh the selling sediment frogs from the ginger river they reduced almost to zero another case is the the gianlin river basin the giant river basin is the historically it is the second largest largest sediment source for the young's river it transports roughly 200 million ton uh spending flux a year and also you can see this you can see because of the human activities and also climate change that the same flux reduced significantly uh in recent years the red line here and for this space and the general basis is more complex because it has a different types of human activities in addition to dams they are also a real reforestation project for example uh from this people we can see that that in in the last decade that china is a tennessee reforestation project has captured the world's attention and actually in the in the upper young river in the southwestern china uh before the construction of the sugar system the government implemented a large scale reforesting deforestation protects after the 1980s and also after the 1990s so here the question is can we isolate the relative impact of daming reforestation and also climate change here we introduce a multiple also called the multiple double mass curve method and the assumption is that the dams doesn't affect the mean annual growth so with this assumption we can isolate the impacts of climate climate and also the impact of reforestation and dams i will show the result uh so our results shows that dams is the major cause for the reduced sediment it contributes to roughly 60 to 70 percent and followed by climate change and also reforestation from the red figure you can see that it is it shows it shows the ndvi data and device the normalized difference of meditation index you can see it somehow it reflects the validation status of the basin you can see that over the past decades since 1985 the ndvi increased significantly this is associated with the reduced sediment flux and here we can see that the reforestation project in afghanistan's river they are they have consort uh conserved the soil and reduce the intrusion and the contribution is roughly uh 10 to 20 percent in different basins they are a little bit different uh we also analyzed the impact of the ventral earthquake and the angular fluid sediment flux transport uh we know that the ventral squig is a is one of the largest earthquake in this century and it has triggered a lot of uh extensive landslides increased flows and this uh super slow processes the sediment has been transported to the fluid systems and we can see from our data after after 2008 the sediment flux there's a less than uplift it shows the increased signal and because the electrons we can mainly influence the uh the left part and the mainstream of the giant river basin and for this the red the red part the chijang river it it is still far away from here so there's no signal in this in this basin however this this increase caused by the earthquake is continuous that doesn't continue very long it also can last roughly five years uh because in in 2014 there's a magdam connecting the kotem that have been operated in in the mainstream of the gallon river it is the largest dam in this basin so we can see that after 24 the increased signal they disappear so from this uh analysis we can also see that historically the the sun increase the sediment flux uh due to earthquakes due to the uh due to the mass wasting processes that can be transported to the downstream in the lower part of the yangtze river however with many many dams that have been viewed directly in the apparent river so all the sediment even the earthquake the impact of the earthquake cannot be seen easily so the implication for this regard is time uh we know that it is the world's largest hydropower project and because of there are more dams now in the upper junction iran and the upper german river basin so the sedimentation um in the uh gorgeous reservoir they decreased very sharply from here you can see the sediment input to the circular stress of the rebels here it reduced especially after the 2012 and the green dots here it shows the the the rest of the sedimentation based on sediment body method you can see that after 2012 and 2013 uh the segment the segmentation in this regardless reservoir is reduced uh significantly and in 2018 or 2019 i heard that there's no almost no net zero sedimentation in the circle this reservoir the world's largest vessel is really really interesting so it is good for the circular reservoir but it also means that there will be no sediment being transported to the middle laureates river and for example in this uh he translation we know that it is directly downstream of the goddess wrestler so you can see that in recent five years after the operation of the circle this reservoir the sending flux reduced almost to zero the broader implication for for the downstream since since historically we know that the upstream business are the sediment source and this sediment source will be transported to uh transported to the delta and an s3 and container shelf however uh in in recent years because of many dams in the in african river and the the sediments produced from the african river basin have been directly trans trapped in the cascade dams but it means the clean water released by after released from the circular stress overlay they will erode the riverbind and cause the channel in session thank you and also the shrinking of the channel bars so this two study has a really good good worker lead by professor golly chung and also professor dijin and this is really awesome works that have explained the downstream impacts of downstream geomorphic impacts of the three body stem actually i also did another study to look at the the downstream geomorphic impact of the circuit side reservoir but focus on the mid-channel bars in the middle mid-yangs river so our data shows that after the operation of this record is the reservoir it has caused a lot of issues for the middle lawyers river for example the chinese station bank fusion and also midterm battery change this this figure shows the the area variation of the of this island it is a island in the in the middle of the river it is a just downstream of the circular stem you can see that the the bar the island is decreased by roughly 30 percent over from 2003 to 2015.
so you can see how uh how the hungry water can erode the island and for this cross section it is also in this part you can see that on the left side the channel inside the roughly 10 meters but this is for this typical cross section but the overall channel incision for the middle lower entry is roughly 1 to 2 meters uh so and but this process is still continuing and the bank illusion for example for this cross-section you can see that uh the bank retreated by 150 meters in just several years this is a really fast change finally brought the implication for the setting source to think concept so according to professor shum he's a very very well-known luvio geomorphologists that i believe everybody know so he classified our river system into three zones the upstream uh source one the middle part as the sediment transporter and the downstream part as the sediment sinks for the river system enhanced anthropocene with the both climate change and the cascade dams the the sediment sources in the upstream business are increasing due to the glacier increased enhancing glacier melt and also permafrost saw and however this increased the sediment force segment source have been directly transported uh trapped in the in the appliance river due to behind the cascade banks and because uh the clean water the hungry water they will erode the uh riverboat so the middle lower part of the basin has now become a new sediment source by uh through uh channel incision bank illusion and also the shrinkage of the channel bars and the same thing in the delta in the continuous shelf has decreased in in anthropocene so this is the the conclusion here is based on the yangtze reversing it applies also applies for many other big river systems uh for example the may call the amazon lady yeah so my country my thesis contribution is focused on the resources to show the increasing sediment flood signal due to climate change the final conclusion so for code maintenance environment we we think that the irritable landscape or the acda it's not static it evolves with a seasonal variation of temperature and for the pristine basin that are underlying by glacier and permafrost the time temperature regulates the seasonal patterns of sediment dynamics by controlling the acba and also the multiple thermal processes these storm events often determine the extreme events and over the past decades runoff and setting flux have increased substantially and in a warmer and wider future we predict that the sediment flux will continue to increase beyond the 2100 and for the dam rivers in the marginal area with future cascade timing we think that the trading segments will be would be trapped behind the uh behind the cascade the rest of us in hmas martin and the relative impacts of damming of reforestation and also can change can be disentangled and also the setting source to sync processes are completely changed in the anthropocene well thank you i will also take this opportunity to thank our collaborators including uh engine irena and also albert they helped us a lot during the field work and and the paper discussion and inputs and also we we thank professor bob watson professor tom down and also professor swelling for providing very constructive comments to our previous papers thank you thank you for your time and i'm happy to repeat your questions okay uh thank you donphone very much and particularly thank you for saving the situation and actually i called her professor i just saw he just relocking and this is still the winter break for the chinese lunar new year i guess he is in his office his building just lost the internet connection and you know maybe the upgrade something and so but now i saw him back so she do you want to see anything more oh no really i guess uh uh many apologize for this i i was not aware of the this until i finished my talk i don't know which slide i wanted to i don't wanna share you know don't go through most of stuff but if you want to see a couple minutes that would be great you still can share something i didn't say i didn't say many of the slides in your part yeah yeah what you want what do you want from me which one i i got lost um maybe just the second one i guess you just started actually yeah oh really yeah oh my god then i didn't know you did until i asked you and the donkey and say uh you can share now then i realized that my god there was no response also i i got i got lost very earlier yeah oh i don't know we worry about you we we are afraid there is any heart attack or any healthy issue but i'm very glad you're back i'm still healthy that was not happening but i i was not aware of her yeah until i i finished my talk and then i asked you at the time you can share now then i realized no there's a bunch of from your guys okay please go ahead if you want to share screen just go through quickly a couple slides you know because then don phone didn't really talk about much about the you know your yes yes oh okay i i try to let me find out if uh well this is the first time we have this kind of uh incident but it's okay you know we cover most of stuff yeah apologize for that that's fine let me find out i guess uh let me find out today just open your ppt and chest i run back to my home are you back to your home yes yes oh i'm sorry because like you don't know this is still oh there's no weirdo on your compass i i know it's a brick are you seeing the screen now not yet oh really oh okay ah my god don't know what is it no that's fine don't worry about it okay yeah it's uh no yeah right here uh no no yeah oh no it's coming okay good good good okay that is good go ahead i don't know which one i had yeah you just second we just started this one okay we lost you i guess uh since it's almost one hour i guess uh i don't want to talk too much a because there were basic stuff so what i wanted to mention is that a these are top double mass curve or triple double mass curve a it's a straightforward method and it's very simple yet it's a robust to separate the contributions from some of the uh uh control variables for example a particular studies of allah eight large chinese rivers we we actually separate the contributions from at least from these three variables by precipitation and by water reductions and by mechanical rotations of sediment including reservoir constructions sand bindings and vegetation recovery as well and interestingly you can see for the south for the rivers in south of china that is subtropical regions they actually the precipitation has been increasing and that increased the water discharge and also the uh sediment load but overall the sediment load has been declining so this kind of information is uh has been buried buried within that that overall declining you cannot just tell right but so does the work we can actually uh find out the precipitation actually they contribute could potentially contribute the increase of the sediment okay um and more interestingly and we use this simple method can actually assess the segment the load sensitivities to climate change water discharge sensitivities and sediment to load the sensitivities and you can see from the empirical uh regulations and one percent change in precipitation and they can potentially result in 1.15 roughly over one percent of the increase in water discharge but for say domain right it's um it's a double so one percent change in precipitation can increase or reduce the two percent of the sediment the load so in other words sediment it's a much sensitive to climate change in this case it's a water okay and you can see also water and sediment sensitivities to uh temperature change okay for sediment at the one degree uh increase in temperature can result in container 30 percent of uh sediment uh decline okay under this result is a consistent with the power from james szabowski's work basically prophet zawaski found that two for every two degrees warming and that's a decrease of the a 18 of a sediment in tropical environment so for a large river large chinese rivers it's a majority of the landscape located in the uh not tropical but the subtropical and the temperate environment okay and of course uh in the higher uh latitude and high altitude regions increase in temperature well increase in the sediment load okay so the my point i wanted to uh what i wanted to make is this a simple method seems to be robust to attribute the contributions of the major uh controlling variables because uh we know there's no better way or method to do this okay so i guess that is what i wanted to talk and maybe we move to the question and answer okay lord yeah okay thank you thank you shishi once again i think your team did a wonderful job you know help us understand exactly what caused that water and statement to load the change is you know with complex issues could be driving by climate could be driving by the human activity even you we don't know what's caused by the dam or deforestation or of reforestation you know all the factors i think this is a very important work so anybody if you have any questions please go ahead and mute yourself and ask okay okay i have a question on your slide number 43 you mentioned almost in 2015 that sweet because the sweet goat damn there's almost a new sediment really released at the downstream of the streetcar dam what's the main reason i mean that's a very serious problem because in the beginning starting from 2003 we still receive with some of sediment to bypass just regarding them to the downstream so can you share your screen at the 43 year slide uh yeah i think it's for 43 yeah cassie nope no oh no it's moving i know your question yeah in the uk station at the guitar station there are the setting flags after in recent years in newton year is almost to zero right yeah yeah yeah i i know yeah i think it's not uh still there are several uh roughly 10 10 million segment it's not a couple slides this is 49 can you do upper couple 43 uh this is a 49 yeah yeah use your keyboard use the keyboard and move up let me share my screen that's fine that's fine that's okay okay let's move on okay dave you have a question i saw you i'm mute yeah uh very nice talk new wonderful data set and uh very interesting and uh enlightening um i my question i have is in their pristine high mountain system where you have the warming occurring you know uh between 1985 and 2017 i'm wondering if uh the yield how much sediment is generated per unit per square area if the yield changes um when you have the permafrost uh move to a higher elevation you know if you correct for the increased amount of i know the sediment discharge increases but i'm wondering if you correct for the increased area that is where the permafrost has melted is there a change in uh sediment yield yeah of course if you uh the sudden yield is also also changing because the seven flags are changing meaning i mean uh i mean the second year the way we actually if we use the uh the active area to calculate the diamond yield yeah yeah didn't do this actually i didn't do this yeah but uh if we we use the the total area so it's definitely increasing i didn't do this it's a good question really good question thank you i would think that the yield would increase as the permafrost uh retreats because you are in a a much steeper part of the water basin or the drainage basin so that you would be having the retreating permafrost be in a fairly steep and high sediment generating area but that that is just a guess yeah i think so yeah yeah thank you thank you for that question so follow this question i know many people already published the data about the ice coverage change over the tibetan play to you know the himalaya area so is anybody show the promo forest the dynamic line or the area dynamic change because climate change i think there are some studies but mostly to my knowledge they focus on the active literature uh there are also the spatial the special change of the permafrost for example the smartphones that change to seasonal flow and ground okay there are basically that the land the permafrost land is also increasing i mean in terms of the altitude increasing from the low altitude is a high altitude region okay most studies they focus on actively because uh yeah this this proxy is a since uh important in the promo foster community and they actively is increasing very fast and they have the long-term projections in the 2100 yeah okay overall the observation for the permafrost in this tibetan platform is very rare compared with the pressure and money monitoring yeah okay we're overseeing the observations are located along this uh qinghai and the tibet highway along this highway the road oh i see others are very hard to access yeah i see yeah yeah yeah yeah yeah okay any any other question people so when we get ready reading the questions so um you mentioned they also started the copy flux so anybody do you know anybody downs on the radio isotope of this carbon from pump forest the reason i asked because in u.s many started conduct in alaska in the promo forest because the preservation of those uh very fresh carbon and in the high latitude area we have a couple talk talk about food and so anybody do this from the your study area show the carbon signature change because that preserved freezing carbon now released to the river yeah i guess uh i have a little bit of experience on the carbon transport and also the carbon emissions from our water bodies and this was actually one of my proposals and a few years back we wanted to quantify the the age of the carbon from in the river systems in the tibet palate himalayan but unfortunately uh my proposal was rejected two times and so as far as i know uh normal life marvin 14 right carbon 14 uh not many people has done that this will work on the measurement because we everybody because many people um hypothesis that the carbon actually getting younger the because of the because of the permafrost degradations yeah yeah but uh i haven't seen a major papers okay on this this could be our future work you know uh it could be something either time could be very good research project research okay uh nah is that 10 20 local time 10 15 10 13 okay anybody any other question yeah maybe i should you know maybe invite you again to talk about more and so but today you know i think we we can stop here and uh oh you have too much information and too much data and i need to read it very slowly because each slide have many interesting figures to curve and too much that's very good thank you thank you very much i know it's 11 p.m so i'm sorry you run from your office back home and so i mean um it's a my phone it's my university's fault well apparently he didn't inform you you know they will you know have an internet interruption but anyway so this never happened over the past 20 years yeah you know okay uh uh you known i think we can stop here and
Up Next
95:32
Fish Pass Design: Key Criteria for River Restoration Webinar
@WetlandsInt
311 views•2018-02-14

15:54
Life in Biosphere 2: Sustainable Ecosystems & Human Survival
@TED
334.9K views•2009-06-16
14:30
Microplastics Everywhere: How Plastic Impacts Our Lives
@TEDx
100.9K views•2018-05-08
10:28
Ice Stupa Artificial Glaciers: Solving Ladakh's Water Crisis
@SonamWangchuk66
3.2M views•2015-05-03
Related Study Plans & Knowledge Roadmaps
Structured learning paths in Environmental Science
environmental-science
Ocean Noise: Cetacean Impacts & Mitigation
01Fundamentals of Underwater Acoustics
02Marine Mammal Bioacoustics
03Anthropogenic Noise: Shipping & Seismic Surveying
+ 2 more learning modules
16h5 modules
Explore Roadmap
environmental-science
Road Ecology: Corridors, Overpasses & Fencing
01Foundations of Habitat Fragmentation and Carnivore Ecology
02The Road Barrier: Ecological Impacts of Transport Infrastructure
03Principles of Ecological Corridors and Connectivity Mapping
+ 3 more learning modules
14h6 modules
Explore Roadmap
environmental-science
Ocean Acidification: Kelp Buffering & Shellfish
01Fundamentals of Ocean Chemistry & pH
02Chemical Pathways of Coastal Acidification
03Bivalve Physiology & Calcification Under Stress
+ 2 more learning modules
18h5 modules
Explore Roadmap
environmental-science
Ice Stupas: Glacial Retreat & Water Security
01Foundations of Glaciology & Mountain Hydrology
02Climate Change and Glacial Retreat Dynamics
03The Science of Ice Stupas & Artificial Glaciers
+ 2 more learning modules
14h5 modules
Explore Roadmap