

![[공인모] 2022공인중개사 시험대비 부동산학개론 이영철교수님 기본이론 11강](https://i.ytimg.com/vi/HoX6YAocPuo/maxresdefault.jpg)


![Comment un marché concurrentiel fonctionne-t-il ? [Partie 3/4, Chapitre première]](https://i.ytimg.com/vi_webp/pQduO4JAxow/maxresdefault.webp)









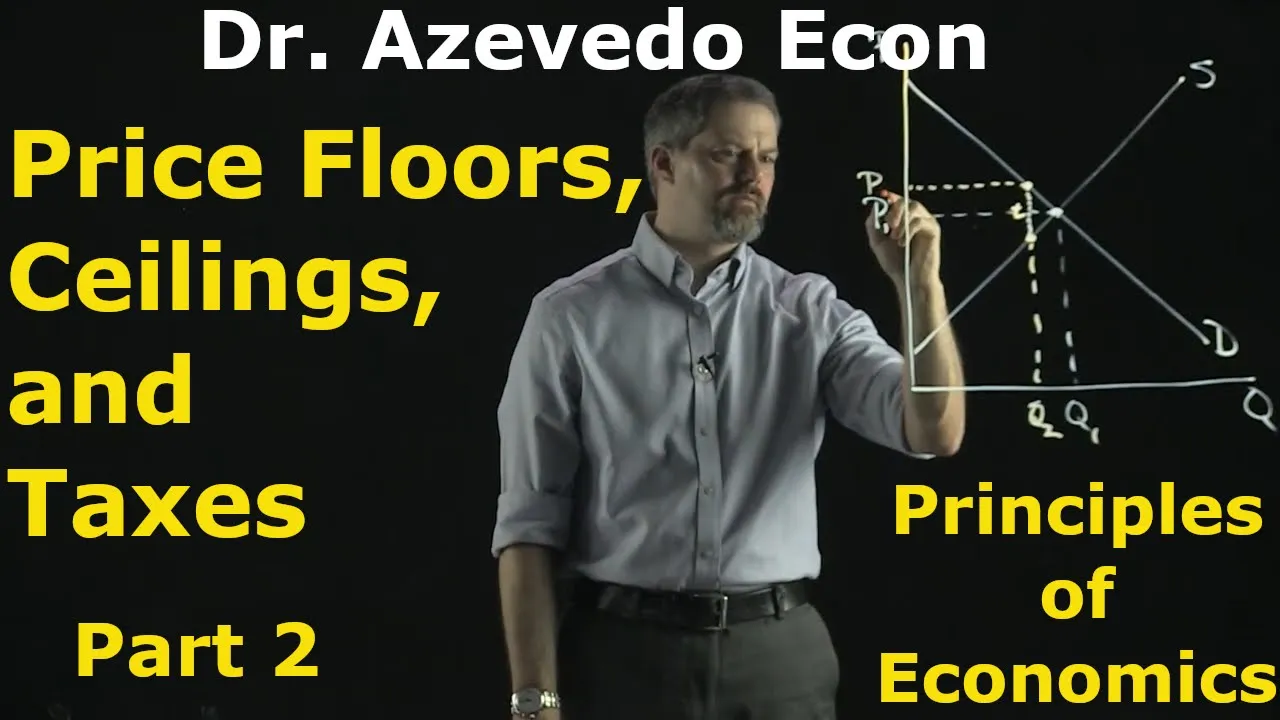



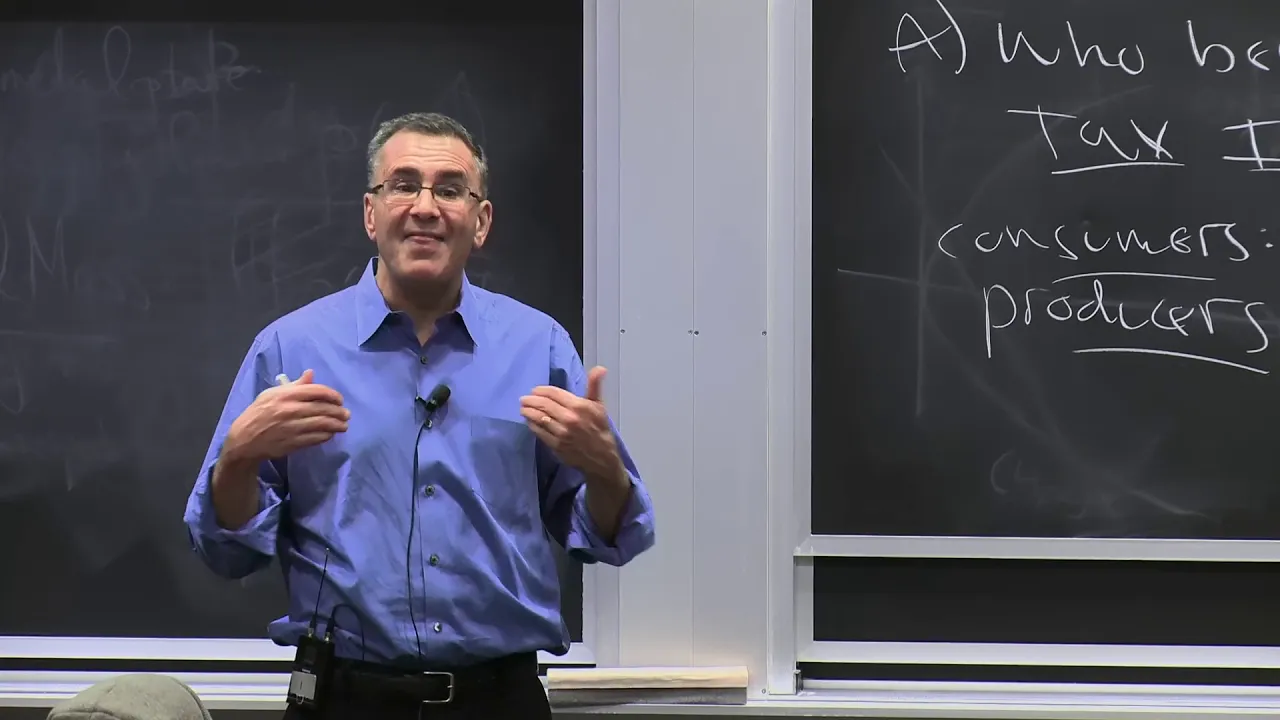


Tax incidence refers to how the burden of an excise or per-unit tax is shared between consumers and producers, which depends on the relative elasticities of supply and demand; when demand is inelastic, consumers bear most of the tax burden, while when supply is inelastic, producers bear most of it, and when either is elastic, the opposite occurs, with the more elastic party being able to avoid the tax burden by changing their behavior.
Tax Incidence Graph: Full Guide to Per-Unit Tax Burden
Added:Understanding standard supply and demand curves and how to identify market equilibrium.
The concept of price elasticity of demand and supply, specifically how elasticity determines the slope of curves.
The definitions and graphical representations of consumer surplus and producer surplus.
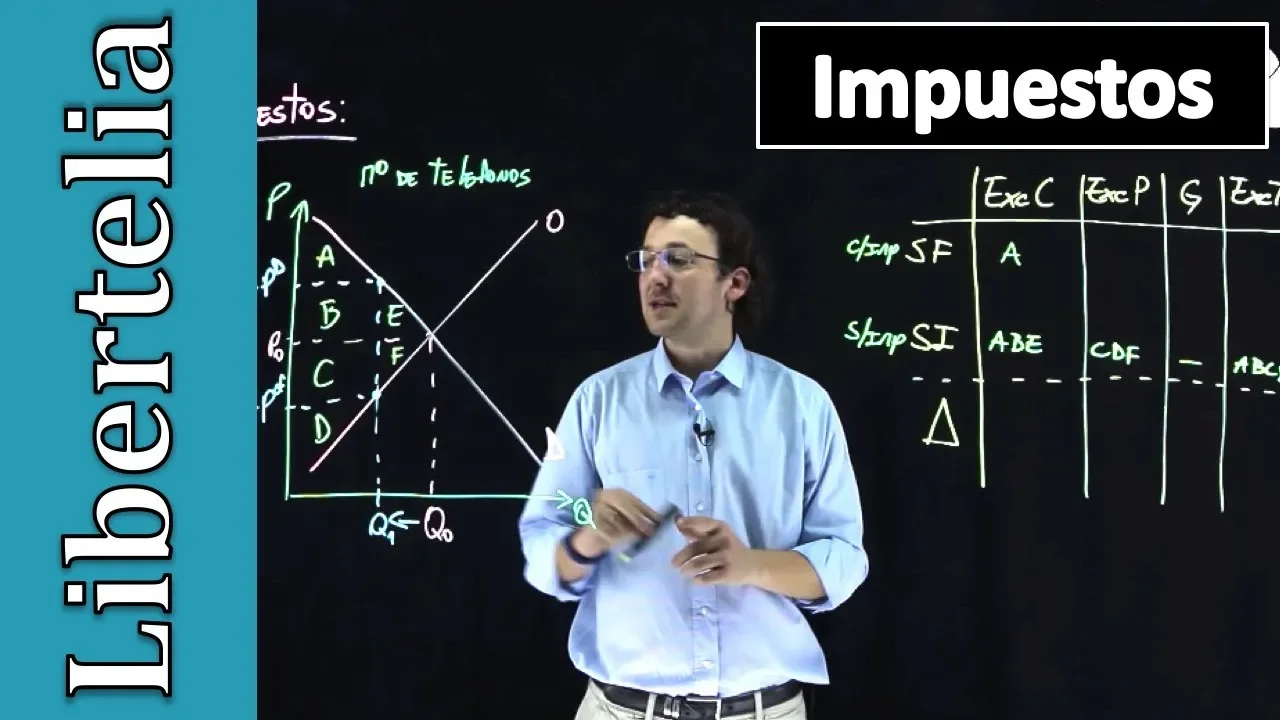
How a per-unit (excise) tax shifts the supply or demand curve vertically by the amount of the tax.
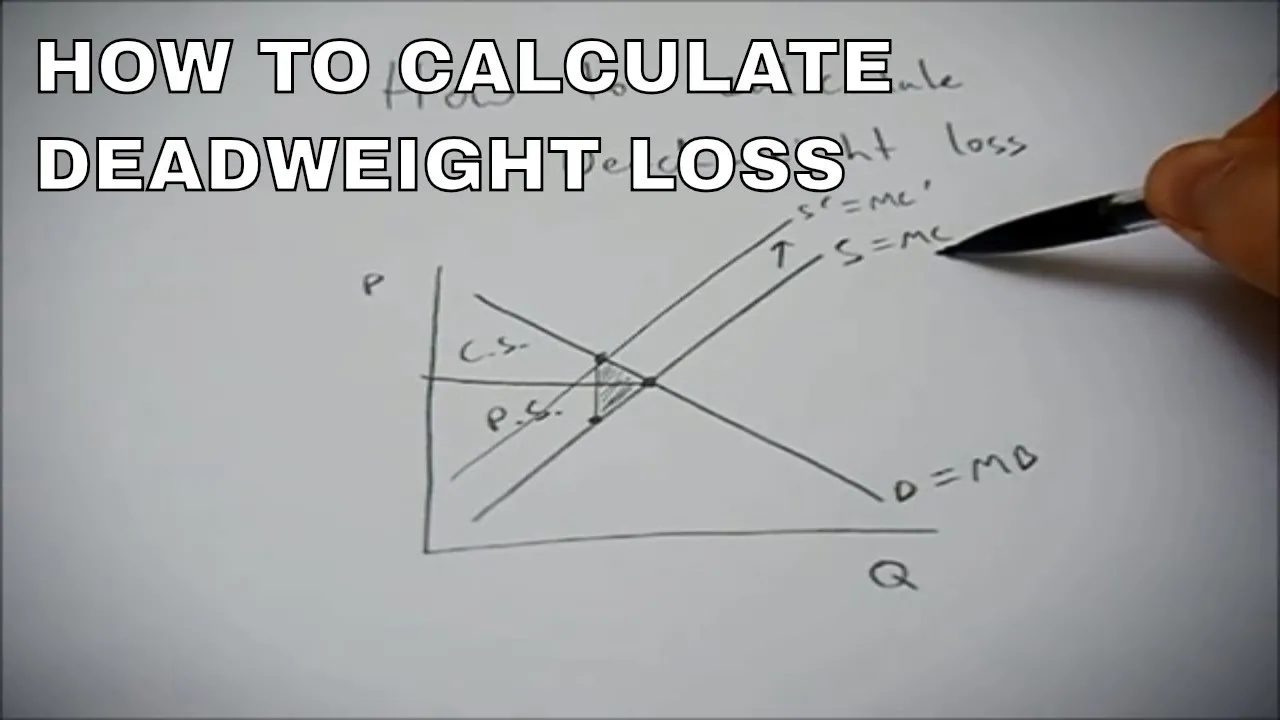
How to calculate and visually identify deadweight loss (allocative inefficiency) caused by a tax.
Calculating total government tax revenue and analyzing how elasticity affects the amount of revenue generated.
The economic impact of subsidies, which function as the graphical and conceptual opposite of taxes.
Applying tax incidence theory to real-world policy analysis, such as evaluating the burden of 'sin taxes' (e.g., tobacco, alcohol) or carbon taxes.
48.1K views350likes14:30Original Release: 2011-11-10
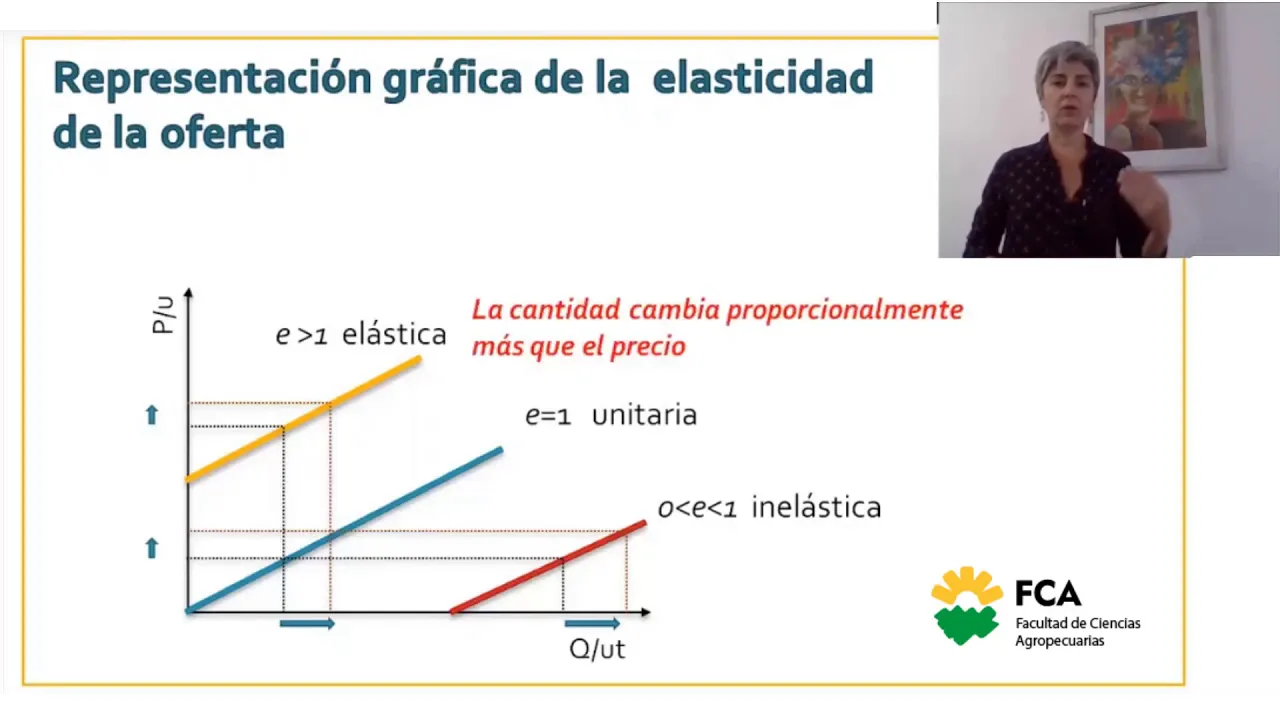
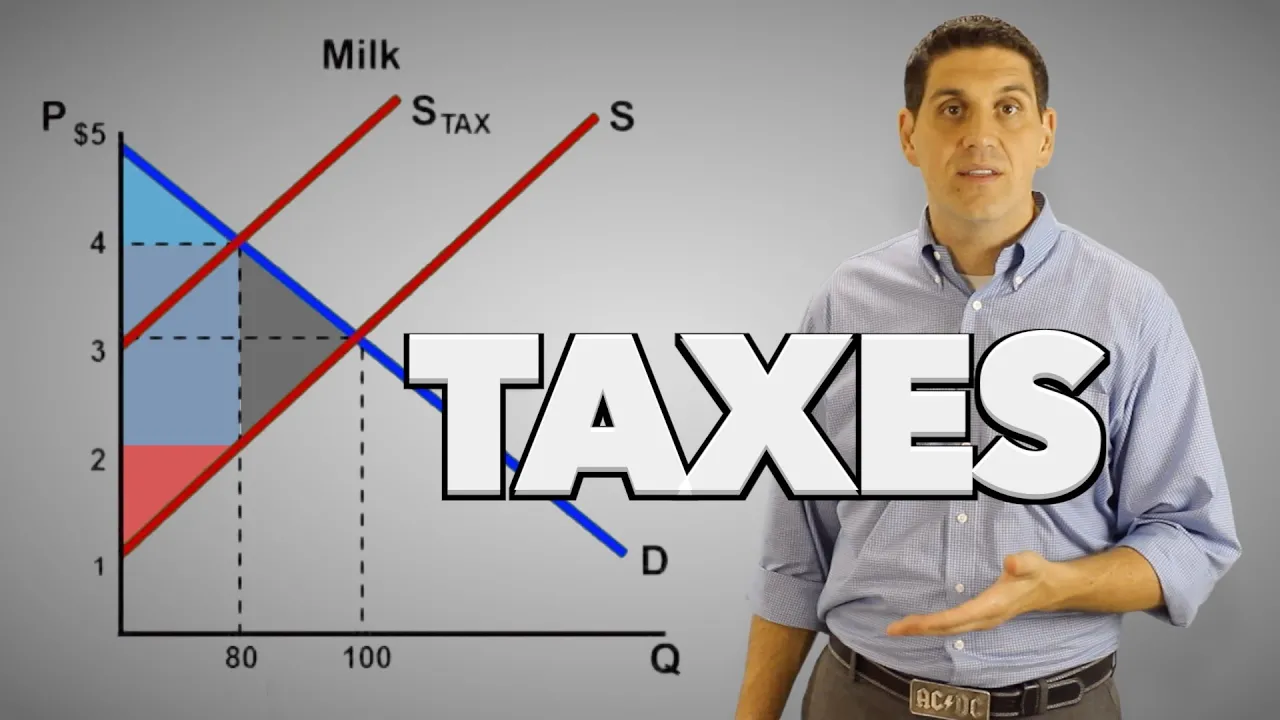
hi folks Mr perer here with you again we are going to spend this video talking about a concept called incidents of Taxation or tax incidents and see how that concept relates to the concept of elasticity essentially what we're going to be figuring out here is when the government imposes an excise tax or a per unit tax we're going to try to figure out how much of that tax is ultimately paid for by the consumer how much of that is ultimately paid for by the producer ucer so when we say incidents of Taxation we're basically talking about a the burden of Taxation how much of a particular tax is paid for by individuals and then how much of that is going to be paid for by consumers unless we're dealing with a situation of perfect elasticity of supply or demand or perfect in elasticity of supply or demand the amount of a per unit tax is going to be part partially paid by both producer and consumer and in most instances worldwide it's the producer that collects the tax and then it'll send the proceeds of this per unit tax onto the government so let's do some analysis we're going to take a look at just a normal market and when I impose a per unit tax what I'm doing uh is I am placing an increase amount of price on each individual quantity that is available for sale so what that looks like then is a shift of the supply curve now it isn't there hasn't been any change in supply all we've done is we've increased the price of every unit available for sale in the market by the vertical distance of the tax so these red arrows would represent the per unit amount of the tax and so when we label our new supply curve we're going to label it Supply but including the tax and so this again this red vertical distance here between S and S plus tax is the per unit amount of the tax so if this happens then we really have the establishment of a new market price and Market quantity Where the S plus tax curve intersects with the demand curve at Point a P2 then will be our new market price and Q2 will be our new market quantity note that market quantity has fallen from Qi to Q2 I also want you to make note of something else take a look at the vertical distance here which is the per unit amount of the tax and then what I want you to do do is compare that vertical distance to the vertical distance associated with the change in the market price from P initial to P2 it looks like the value of the tax is greater and that is indeed the case so what this means then is that the the consumers have paid some of that per unit tax but it is also the producers that have paid another portion of it which underscores the idea that for any excise tax or per unit tax uh the burden of the tax is going to be shared among producers and consumers let's see how that really looks then in this further analysis the diagram Point C is important for us to establish because uh it allows us to get a a an idea of the price that the producer is going to be able to keep now I found Point C by taking a look at the new market quantity and where that market quantity bisected this the initial supply curve and I made a note of that price this is the price that the producer gets to keep as a result of the sales now he's ultimately collecting price P2 but remember he has to deliver some of that the proceeds of the each sale to the government in the form of Taxation and so he's going to pass P2 minus P3 this amount off to the government and he's going to be able to keep the rest so this pink shaded area then represents the burden of the taxation or the incidence of Taxation that's paid for by the consumer it's the market price initial market price and then it's the new market price so it's the consumer that's been paying that per unit increase times all the units that have being for sale which is 0 to Q2 and so this rectangular shaped area represents the burden of Taxation the incidence of Taxation on the consumer to find the tax burden on the producer again we take the market price and we find the difference between the market price and the amount that the producer gets to keep and again we have another kind of Revenue box here and that that graad area box represents the burden on the producer if we were to take this together right this rectangular area that's bounded by P3 C A and P2 we would get the total amount that's paid to the government after being collected by the producer now I want you to make a note of something else if we were to I were to ask you what the in uh the original total revenue that was collected by The Firm before the imposition of the tax was hopefully you would say well that was Zero Q initial b and Pi I and so we would have this rectangular shaped Revenue box after the imposition of the tax I want you to take a look at the new Revenue that uh The Firm gets to keep after the tax has been imposed zero Q2 now because sales have dropped C and P3 because it's P3 that is the price that the con the producer gets to keep so this Revenue box is noticeably smaller so we've seen for the firm the result is of it really any any tax is going to be uh probably a fall in total revenue now we have another area here a triangular-shaped area bounded by ABC triangle and what is what is that well that's a an efficiency loss because we've passed this particular tax we've lost so Society has lost some amount of consumer surplus and some amount of producer Surplus when we combine that total we call that either a total loss of efficiency or dead weight loss to society so uh this is a great graph showing you the basics of how to figure out the incidents of Taxation the next thing we have to do is see how this concept of incidence of Taxation affects or is impacted by elasticity and so really what we're going to figure out is the incidence of an excise tax or a per unit tax given different elasticities of supply and demand we're going to start with a case of inelastic demand first and note that I've drawn a very very nice steep steeply sloped demand curve to indicate relative in elasticity when I pass my tax remember it looks like a shift in the demand curve or supply curve not really but that's what it looks like and remember that the vertical distance between S and S plus tax is the per unit amount of the tax so I'm going to label that s plus tax I'm going to make a note of where that that tax inter my demand curve that's going to be my new market price note the increase of P initial to P2 and likewise the decrease in the quantity demanded from Q initial to Q2 and that's not a big drop in demand uh sorry quantity demanded now I need to figure out the price that the consumer gets to keep I find that again uh where the new market quantity intersects the initial supply curve and this is P3 here and this analysis shows me that with in elastic demand it is the consumer that is going to Bear most of the tax burden and that is indicated by the pink shaded area the producer's tax burden is represented by the gray shaded area and you see that that is relatively smaller you know why is that it's because our consumers cannot change their buying patterns as a result of the increase in in price and so they're going to shoulder the burden of the tax increase we still have some degree of dead weight loss or loss of efficiency uh to society and I've noted that in my orange triangular box let's take a look now at the case of elastic demand so you'll see now that I've drawn a nice shallowly sloped demand curve I'm going to pass my tax I'm going to label the new curve s plus tax I'm going to make a note of where that tax intersects my demand curve going to establish my new market price and my new market quantity note that in this particular case that the market quantity has fallen by quite a great bit the next thing I need to figure out is the price that the producer gets to keep P3 and um I note then that the taxation burden in this particular case with in or with elastic supply has not Fallen as much on consumers as it has fallen on producers why is that it's because the demand is elastic and that means that consumers are sensitive to prices changes and that they've had the ability in this case to probably substitute out of consuming this particular good or service and that then leaves the producers with bearing the burden of the taxation we still have in fact quite a great deal in this particular case of dead weight loss or loss of efficiency to society now let's take two more cases first case elastic Supply I've drawn a nice steeply sloped supply curve to find the tax I'm going to uh shift my supply curve up by the amount of the per unit tax label my new supply curve s plus tax find out where that tax intersects my demand curve and establish a new market price and a new market quantity then I have to figure out out the amount the price that the consumer gets to keep or sorry the producer gets to keep and in this particular case I note that it looks like it is going to be the consumer that gets off with the lighter tax burden and it's going to be the producer that is going to B bear the brunt of this particular tax why is that it's because the producer cannot make any Supply changes as a result of the imposition position of the tax and so he's going to be stuck with bearing most of the burden of that taxation we still have some degree of uh inefficiency uh dead weight loss to society and again I've indicated that in Orange last one uh case of elastic Supply so I've drawn a nice shallowly sloped supply curve here I'm going to uh shift the supply curve or what looks like a shift to the supply curve to s plus tax the vertical distance between those two curves again represents the per unit amount of the tax I find out where that tax intersects the demand curve and I establish a new market price and quantity at P2 and Q2 respectively then I want to take a look at the price that the producer is ultimately getting to keep here at P3 I now note that relatively speaking it's going to be the consumer that bears most of the burden of this taxation relative to the uh consumer why is this it's because of elastic Supply and as a result of the imposition of the tax The Producers been able to make some changes fairly quickly and that means uh he's able to shift out of producing this particular good or service and produce something else so it's going to leave the consumer with uh paying the brunt of this particular tax note again uh the dead weight lost to society because of the imposition of the tax at triangle ABC so what have we learned here well um really uh five things I guess the biggest thing is that um the concept of incidence of Taxation or tax incidence is highly related to the concept of elasticity we also have four situations that you might want to commit to memory in the case of inelastic demand it's consumers that can't change their buying patterns and so they're going to pay the burden of the tax with respect to the elastic Supply it's the producers that cannot change their production uh uh capabilities and their production possibilities and so they're going to pay the tax burden with a case of elastic demand uh consumers can change uh and so it's going to be then the producers that pay the tax burden with the case of elastic Supply it's producers that can change and so it's the consumers that are going to pay the tax burden so I hope it's clear how these two concepts are related um uh look forward to seeing you soon bye
Up Next

8:20
Producer Surplus Explained: Microeconomics Example & Graph
@khanacademy
522.1K views•2012-01-09

5:07
Impact of Yuan in Indo-Russian Trade Amid Sanctions
@WION
261.9K views•2022-07-01
10:33
Behavioral Economics Explained: Rationality, Nudges, and Risk
@crashcourse
1.1M views•2016-03-12

113:18
The Age of Easy Money: Fed & Inflation | Full Documentary
@frontline
21.2M views•2023-03-15
Related Study Plans & Knowledge Roadmaps
Structured learning paths in Economics
economics
Sovereign Debt: Defaults, IMF & Restructuring
01Introduction to Sovereign Debt & Government Bonds
02Debt Sustainability & Credit Ratings
03Anatomy and History of Debt Crises
+ 2 more learning modules
12h5 modules
Explore Roadmap
economics
Market Design: Matching Theory & Gale-Shapley
01Introduction to Market Design and Price-Free Markets
02Two-Sided Matching & The Gale-Shapley Algorithm
03School Choice Systems and Mechanism Design
+ 2 more learning modules
10h5 modules
Explore Roadmap
economics
Impossible Trinity: Forex, Capital & Policy
01Introduction to Monetary Policy and Central Banking
02Exchange Rates and International Capital Flows
03The Mundell-Fleming Model
+ 2 more learning modules
8h5 modules
Explore Roadmap
economics
Healthcare Economics: Market Failures & Systems
01Introduction to Healthcare Markets and Market Failure
02Asymmetric Information and Adverse Selection
03Moral Hazard and Insurance Design
+ 2 more learning modules
12h5 modules
Explore Roadmap