











Seismic acquisition involves generating acoustic energy using sources (such as dynamite, vibrator trucks, or marine air guns) and recording the reflected waves that return to the surface using receivers (geophones for land or hydrophones for marine environments), with the goal of creating 2D or 3D seismic data volumes that adequately sample subsurface geology through optimized source-receiver configurations, common midpoint (CMP) gathering, and stacking techniques to enhance signal quality and reduce noise.
Seismic Acquisition: Land & Marine Methods Explained
Added:Basic principles of wave propagation, including reflection, refraction, and Snell's Law.
The concept of acoustic impedance and how differences in rock density and seismic velocity affect wave behavior at geological boundaries.
Introductory Earth science concepts, specifically subsurface layering, rock types, and structural interfaces.
Fundamentals of signal characteristics, such as frequency, amplitude, phase, and the concept of a seismic wavelet.
Seismic data processing workflows, including noise filtering, deconvolution, and velocity analysis to improve signal-to-noise ratio.
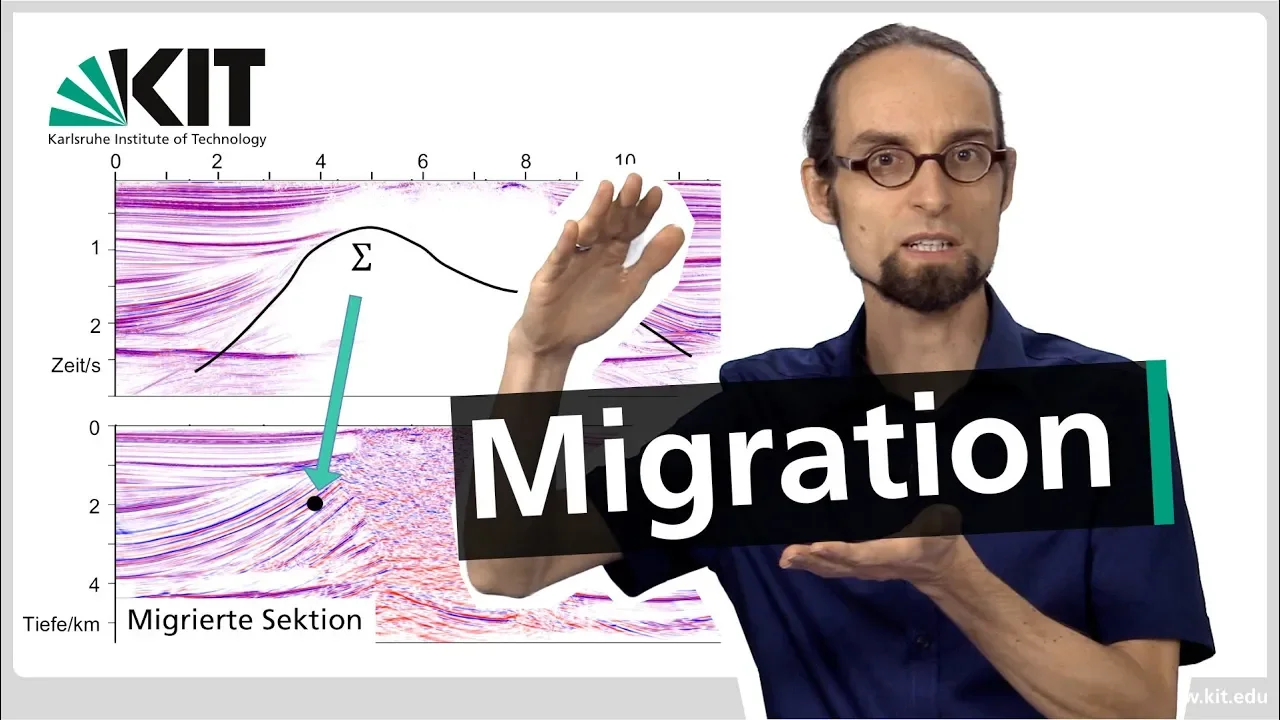
Seismic migration techniques, which mathematically reposition reflections to their true subsurface locations.
Subsurface structural and stratigraphic interpretation, converting processed seismic images into geological maps.
Advanced acquisition technologies and trends, such as 3D/4D (time-lapse) seismic, ocean-bottom node (OBN) surveys, and environmental mitigation strategies.
33.9K views389likes41:27Original Release: 2017-08-22
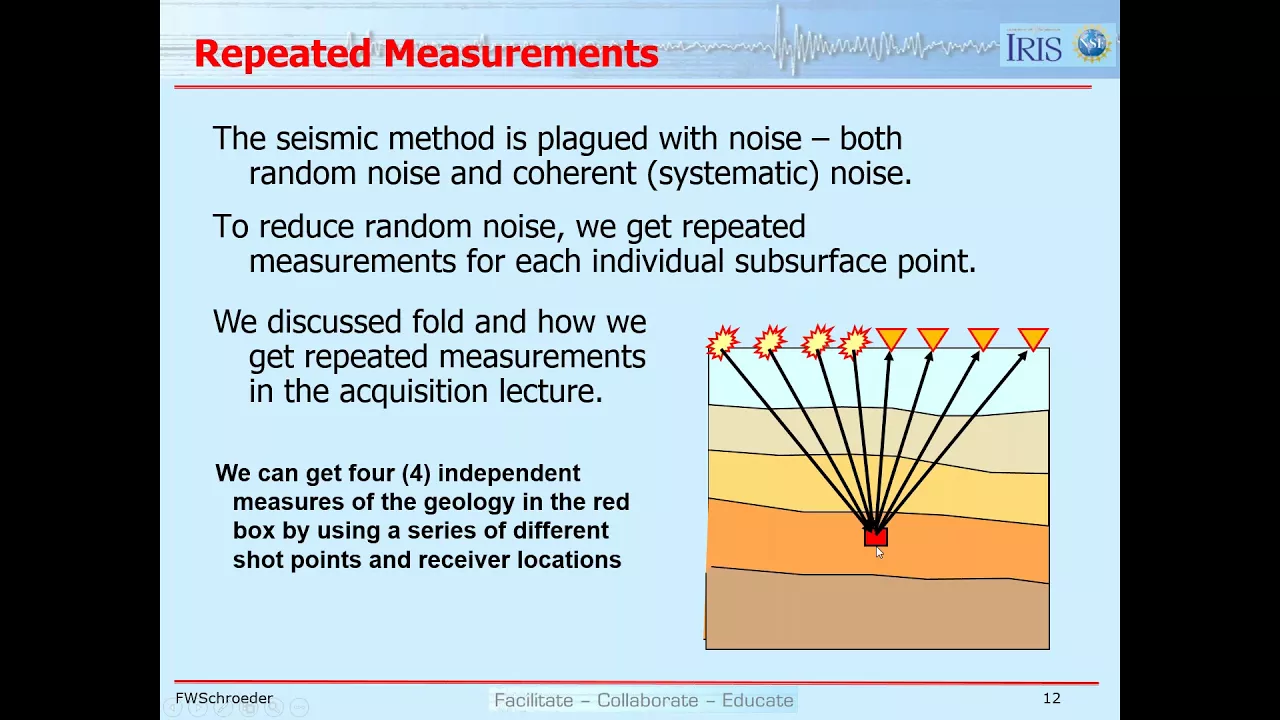
Danyelle and good afternoon to everyone that is watching this afternoon today as Danielle mentioned we'll talk about seismic acquisition and for some eye candy I have up here some vibrator trucks that looks like one two three four of those and then I have a marine seismic acquisition vessel so we'll talk a little bit about land acquisition will also talk about marine acquisition I've added this terms of use it is on the website I'm not going to read all the words here but the intent is that these materials the lectures the exercises the videos are for full-time students and for teaching staff at the universities they are not intended to be used by people who are already working or any type of in-house training whether that's done by a company for their own employees or if it's a contractor coming in and doing teaching or training so a seismic damage we have to combine that seismic data acquisition and the seismic data processing so today we'll focus on the acquisition part and on Thursday of this week we'll talk about seismic processing acquisition and processing has to work together in order to produce the best possible final imaging the acquisition process includes first generating a signal with an energy source and we'll talk about the energy sources that we use and then we have to detect and record the reflections that we have come back up to the surface and we use receivers and we'll talk about the types of receivers our ultimate goal is to create either a 2d line or series of 2d lines or a 3d volume of seismic data that adequately samples the geology that we're trying to map and interpret and make business decisions on we want to optimize the data through signal enhancement and also through noise reduction some of the signal enhancement and noise reduction is accomplished in good data acquisition and additional signal enhancement and noise reduction is accomplished through seismic data processing which I'll talk about on Thursday so keeping this goal of getting good images and worrying about costs then we have to specify a series of acquisition parameters some of which is the type of source and its source characteristics the receivers and how far we space the sources and receivers we need to worry about the surface area we need to acquire the data from the record length how many seconds of two-way travel time information are we going to gather and then methods that we can use in acquisition to try to mitigate noise the seismic signal is sampled at discrete time intervals and we call that the sample interval or the sample rate in the 19 jumping down 0.3 in the 1960s prior to that the industry was recording the Wiggles as you would see on a earthquake seismograph and then in the 60s we started actually recording the data as digits and so we have to have a certain sample rate and so typically the sample rate in industry is four milliseconds although there are cases where we might have seismic acquired at a two millisecond sampling rate or even one millisecond it depends on the velocity structure that we're trying to focus in on and the depth and how much resolution we need to get out of the seismic so going from analog to digital in the 60s revolutionized our ability to process the seismic data and do a signal enhanced so we produce the signal we use an energy source at the surface and that energy propagates down through the subsurface and we can contain we can think of that as the energy let's say we have dynamite that's not too common of a source these days but it is still used in certain cases we have a stick of dynamite it explodes the energy goes down hits an interface and comes back up and our receivers or listening devices catch those reflected waves the red lines show how the energy spreads out spherically and the black arrows are ray paths so that energy from the explosion the seismic shot or the dynamite explosion will go out along the surface horizontally but it will also go down hit an interface part we'll record that we need to capture the reflected energy at the surface and we want to try to get rid of unwanted noise the arrivals that come back to the receivers are recorded digitally and so each shot is recorded in the field with equipment we move the equipment along and repeat a second shot listening third shot listen fourth shot listen and so on and so on until we get the data coverage that we are interested in we can attenuate noise by using a raise of sources and a raise of seeds of receivers and so if we have several sources and there's a lot of science in how we build these arrays and what their properties are what we want to do is maximize the vertical down going energy and we'd like to cancel out the horizontal energy through interference effects similarly with the receivers there's a lot of science that goes into how design receiver arrays and so we have one two three four five six receivers but they're coupled to give me one response at the central location again what we want to do is cancel out the horizontally propagating energy and focus or concentrate or enhance the vertical energy coming up as reflected energy from the subsurface to enhance the signal what we'll do is we'll sort the traces from multiple shocks in two receivers and we do that sorting based on a common midpoint CMP so we have a shot here energy goes down let's say we're interested where this little red circle is interested in that little piece of the subsurface the energy reflected energy comes up and hits this receiver then we have this source send energy down hits the same area it comes up and just recorded in the second receiver the third source is activated energy goes down hits where the red circle is and is picked up by this receiver so what we will do is we'll take our field record that is a organized shot by shot by shot and we'll resource the data so that we get common midpoints a certain shot coupled with a certain receiver will get us information at a common midpoint or a CMP the benefit of doing this and summing the common midpoint ray path which is referred to as stacking that allows us to reinforce the geological signal while diminishing through destructive interference random noise source generated noise unwanted multiples and surface ways some of the things that are in our raw data set that we can correct for using proper acquisition methods so let me talk about Marine acquisition first here's a picture of a Marine acquisition vessel what we use in the marine environment for the source for the energy or air guns that's the standard and when we are working in a marine environment this shows a floatation advice and we have one air gun here another air gun suspended here this will be a few meters in depth in the water you can see the cables that are coming out some of those are electrical cables some of those are for compressed air we put compressed air in a chamber within each of the air guns when the gun is fired a piston is open of hatches open a piston forces the air out rapidly the venting air creates a bubble or series of bubbles and the water pressure will collapse those bubbles and when the bubble collapses that's what generates our acoustic energy or our pressure wave so it's kind of like blowing up a balloon blowing it up doesn't give out a lot of energy but if you pop it with a pen you get a fairly large pop of acoustic energy so here's a picture here's the vessel acquiring the seismic data we typically use two or more source arrays so this on the left is labeled source array 1 or a I'm sorry and then source array B B has just fired you start to see some of the bubbles a has fired the maybe five or six seconds previously so the boat sails along at about speed of 10 knots a fires B fires a fires B fires a fires B fires and so we are able to position the a sorcerer raised such that we can get a lot of subsurface coverage I'll show more diagrams to help illustrate that in the marine environment our receivers our listening devices our hydrophones we are detecting pressure waves so we have an outer casing of metal and inside that we have pressure sensors there's holes in the in the metal so that the pressure can be sensed we put these devices inside of tubes called streamers we fill them with fluids and they're close to being neutrally buoyant so these silicon filled flexible tubes will trail behind the acquisition boat and these days those cables are on the order of five six seven kilometers in length so here we have a little cartoon here's my acquisition boat here's my source array three purple air guns and I have one two three four five of receiver arrays the energy is going to go down we're going to be worried just about this interface between the yellow and the brown and the point of reference that I'm interested in is marked with the red circle and as I click through this animation the boats going to go along the Ray paths are going to change as the source position and the receiver position change and I want to count how many times I get a reflection or a bounce point off of this little red circle so here's a time to time three I still don't have any bounce points and so that's what this zero corresponds to time for I have a first bounce point the energy from the array goes down and comes up and is detected by the closest receiver and then by the second receiver then by the third then by the four and then by the fifth so fold is a name that or a term that we use in acquisition and processing for how many common source receiver payers we have that illuminates a particular point in the subsurface and so as I went through this little animation is a fold went from zero all the way up to five and for this length of cable only five receivers five would be the maximum okay and so in an acquisition we collect the shot records in processing what we look for our common depth points or common midpoints and so with different shots locations different receivers will have a reflection point or a balance point at that little red circle so we talked about the fold of the data that corresponds to how many different source receiver pairs would illuminate a particular point in the subsurface this is a an example of the shot record this is the raw data that we get in a marine situation here is to a travel time in milliseconds so this would be one second to a travel time this would be 1/2 this is the receiver number which is also equal to the distance behind the boat we have hope I thought there was some animations the line coming down diagonally straight that's the direct arrival through the water column the slope of this line tells me what the book what our velocity is if we see straight line segments at a steeper dip those would be refracts ins and reflections are the events the blacks and the whites that are curved slightly downward they are hyperbolic in shape and we understand the physical equations here we can calculate what those hyperbola are and based on the shape of the hyperbola we can get the average velocity to a particular depth point so here again is a photo with some overlay on top of it so here's source array a here source array B and this boat is pulling one two three four five six seven eight streamers so those are those silicon filled tubes that have the hydrophones in them and they can be four five six seven eight kilometers in length a lot of equipment to keep track of to tow through the water and try to keep spaced in the way that we want them to be spaced so again a diagram here's my this is looking from above here's my sort of my acquisition boat here's array the blue array and the red array and I have one two three four streamers and so if I consider from this source into this receiver the midpoint would be this blue dot this source into this receiver would be this blue dot this source into this receiver would be this blue dot and so I can map out where I would have bounce points or reflection points when the blue gun fires I can do the same thing with the red gun when it fires and so if I count the numbers of lines of blues and red circles I have four blue and four red so in this situation every time the boat sails in one direction it's collecting eight lines of subsurface data the quick way to do that is take the number of sources in this case to multiply it by the number of receiver lines or streamers for two times four is eight so I get eight lines of subsurface data switch now to land acquisition this is a vibrator truck it can roll into a position you use GPS so that we know exactly where the trucks are we don't use a single truck we use usually four or five that are working to generate an array the main part of the equipment is on this metal plate the truck rolls into place hydraulics push the plate down to the land surface and then it continues to push so that it actually jacks the truck up and the wheels will not touch the ground so the entire weight of this truck will be on that plate and then we have equipment that will vibrate that truck either up and down to generate P waves or left-to-right back and forth to generate shear waves and we will sweep through different frequencies whether we're generating P waves or shear waves one option for land sources is to use dynamite we have to drill shallow shot holes five to thirty meters deep so that increases the expense of using dynamite because we have to have equipment to drill the holes the depth of the hole is chosen based on where we would get best coupling between the explosion and the and the subsurface it is expensive it's labor-intensive and there are safety issues because there are people that are not geoscientists that would use dynamite for purposes other than collecting reflection seismic data we use these in areas where we can't get the vibrator trucks in and so that might be where we have gravel or sand and the vibrators don't get good coupling it might be in mountainous terrains well we can't drive those four or five trucks or it could be in areas that are swampy the water in the swamps doesn't allow us to coupled to the land very well or in dense jungles again where we can't get those trucks driven into the most common I would say probably 90 to 95 percent of the land acquisition uses by Versailles is to use these vibrator trucks which I've talked about the plate is lowered and we generate either P waves or S waves the impact on the surface is very minor it's much less expensive than dynamite the very sweet through a range of frequencies and that sweep is later compressed into a compact seismic wavelet through a process called correlation I know of an example where they use vibrator trucks at dallas-fort Worth Airport and they had these trucks vibrating on the tarmac of the runways and you can imagine that the airport wouldn't permit that if these trucks were going to rip up their one runways and have to have the runway shut down for several days in order for them to repave it the receivers for land are called geophones they detect emotion and the older ones which is shown here would have a central magnet and wire wrapped around it and as the magnet moves as the land surface moves that would induce a current in the wire that is wrapped around it and so that the electrical voltage is recorded as a signal and so that is how we collected the land data up until maybe 10 or 15 years ago now we have other types of receivers for land they're called Mims and they do not involve magnets and coils so here's a little cartoon here's my vibrator truck this meant to represent the array of vibrator trucks I have a couple of receivers to the left and three to the right here's the little red dot this is the portion of the subsurface I want to keep track of and so at this position the vibrator sends energy down it reflects and comes up and is recorded by geophone number one and then it's recorded by two so we have a fold of two at this point and then it is recorded in geophone array number three threefold fourfold fivefold six-fold so again with the common midpoint gathering that will do during processing we will build a data set in this example that would be six folding this is an example of a land shot record this is called split spread because the vibration or the midpoint I should say is in the center and then we have data that is to the right and that could be north or east or northeast and we have data to the left this is where my animations are we can have refractions that we capture which would be straight lines we can have brown roll and all the big excursions the big sweeps of black and whites near the midpoint is ground row and the reflections are the hyperbolic events either to the left of the midpoint or to the right of the midpoint here's a picture and if I can count the tires there's one set two sets three sets four sets I don't know if there's a fifth truck back there but it's either four or five vibrators that are going to vibrate the ground in a map view we are going to have the vibrators vibrate when the red X's are and the geophones are located where the little green circles are located and so we could vibrate at this point and the red represents the midpoints that this would be for the southern line of receivers this would be for the central line of receivers this would be for the northern line of receivers and as we move from this shot point to this shot point to this shot point to this shot point you can see how we're starting to get patches of subsurface coverage and if we did this for the entire survey we can generate a three-dimensional volume of seismic data there is some artifacts some things that are not geologic that comes about because of the way we acquire the data we will see amplitude artifacts that is typically oriented in the direction that the equipment was moving this is more apparent in marine surveys than in land surveys and so on the right I have seismic line a to a prime this kind of magenta reflector that has the dotted cyan line through it that's the water bottom if I were to ask the computer show me the amplitude values for that water bottom reflection the cyan horizon this is what it would look like in map view line a to a prime is here a to a prime and what you see in here is lineage or striations or stripes that are oriented east-west and that's because this is a marine survey and the boat sailed west to east turned around sailed east to west turned around went west to east etc etc and so it takes some time in terms of depth or to a time to heal up the fact that we don't have continuous sampling along the surface we have individual points shot points that are typically on the order of 12 and metres apart processing assumes that we have consistent acquisition geometry artifacts will decrease in magnitude as we get deeper and deeper into the subsurface or deeper and deeper in terms of to a travel time there are ways that we can try to mitigate some of these artifacts in acquisition if there's an area where we didn't have enough shots we can go back and do some infield shooting we can do some pre-processing by flexing bins or by doing something called trace interpolation trying to estimate what the data would have been if we collected it in locations where either it was poorly sampled or we had excessive noise we can do several things in processing to try to help that and then post-processing we can do something like taking this amplitude map and doing some map filtering to try to smooth out some of the high frequency noise that's a purely cosmetic process that is not what I would call science-based solution to a problem so in summary land seismic our source produces ground motion that reflects off subsurface interfaces it is recorded by geophones that detect the ground movement the typical source for ground motion is the viber size trucks although occasionally we still use dynamite in areas where vibra size is not effective in marine acquisition we use compressed air and use the air gun or air gonna raise the recording the or the receiving devices are called Hydra phones that are pressure detectives detectors there's a lot of efficiency in acquiring a marine 3d survey and that's acquired by boat that tow more than one source array most of the time it's two or three source arrays and they tow multiple streamers typically these days I don't think you would find a seismic vessel with less than eight cables and there are some specialized acquisition vessels that can tow I think 20 or maybe 24 streamers is the maximum that is acquired these days okay so that concludes my prepared remarks again there's a lot that we could say about seismic acquisition but in a 35 minute presentation I've tried to give you the main highlights and before I turn it over to dr. sue me I'll just put this up this keeps track of where we are we just finished seismic acquisition lesson 16 Thursday we'll talk about seismic processing so dr. sue me I'll turn it back over to you if there are some questions from the audience thank you what if some psychic energy output comparison between fibrous ice and dynamite what is the seismic energy and then I heard viber size and dynamite but I didn't hear the middle what is the seismic energy output comparison between fibrous ice and dynamite the main difference is that dynamite produces a single pulse of energy with various frequencies in it kind of like you would think of as an explosion or an earthquake the vibra size we are shaking the earth and we shake that at different frequencies the vibrators will sweep either high to low frequency or low to high and so it's not a single event it's a series of shaking with different frequencies and that's why we have to do the step that I mentioned correlation to get that back to replicate what it would have looked like if it was a single impulse like an explosion great is our first and only question so far I've seen here we go um Dominic asked the geophone offset flash spacing is 12 meters as you said this is this is our English is a little weird um that's supposed to me that's not right but that we cannot see any structures less than 12 meters in radius or small than the line spacing yes okay um first of all typically the the receiver spacing will be 25 meters and then when you consider the the fact that the energy is going down bouncing and coming up at a reflection angle that cuts it in half so it's 12 and a half meter trace spacing and I'm trying to remember what their what the other point that I was going to make oh the that does limit both our vertical resolution and our lateral resolution we'll talk Thursday about seismic migration seismic migration greatly enhances lateral resolution and so typically with today's seismic at the depths that we're typically interested in our lateral resolution can be on the order of about 25 meters and if we're in an explorations mode we certainly can live with 25 meter lateral separation even if we're in field development or field production we may want to understand where a particular fault is positioned in the subsurface and if we have a lateral resolution on the order of about 20 meters or so that is usually more than adequate in order to answer the business questions so there are limitations but in terms of the scale of things that we're looking at it usually isn't too much of a handicap great and Joann asked I have heard mention of using Terra found in the marine environment how does that compare the type of marine acquisition you were describing with that Paracels Terra sound and you take that in for me nor it's not a term that I'm I think I'm familiar with Paris sound okay I do not know what that is so rather than guess and be totally off-base I'll just say you stumped the presenter are we still connected sorry I was on mute so okay Joanne says okay sorry the sign and Carla's ask how to do seismic acquisition on hypocracy terrain on hi topography terrain I would say mountainous regions that is where oftentimes we have to rely on dynamite again if we can't get vibrator trucks to give us the necessary surface coverage then the fallback is to use something like dynamite in some cases if it's a mountainous terrain but there are a series of roads they will use modeling of seismic acquisition to see what sort of coverage they could acquire if they just had the vibrator trucks vibrate on the on the roads and the logging paths and any place where they can get those those fairly heavy fairly wide vehicles into position great John asks how are ground rolls extracted from the seismic data without loss of relevant reflection data you know I think I'll talk a little bit about that on Thursday but what we what we do is we try to figure out how can we isolate an unwanted effects such as ground roll or multiples and they then subtract that from the basic data and hopefully have a less noisy data set to work with and so a lot of times we'll do a Fourier transform and we'll take things from the two-way time domain into the frequency domain and we can design filters in the frequency domain that will take out things such as ground roll and multiples and so there's a lot of work that has been done in the past to try to eliminate the different types of noise and it's still an area of very active research how can we minimize the noise enhance the signal and when we do subtract something such as as ground roll how can we try to safeguard that the data that remains is trust weather's great Fernando asks do you expect seismic acquisition projects in the near future especially considering their recent oil and gas downturn yes I acquisition will continue I think it has continued it is probably not at the same amount of work say per month as it has been in the past and a lot of times what that means is the companies that specialize in seismic acquisition have cut their costs so in the really good times in terms of high oil and gas prices acquisition costs can go up quite a bit and you may have to wait up to 12 to 24 months in order to get a slot so that the companies that acquire the seismic get around to doing your particular project in the downturn such as we've been in for almost two and a half years the price goes down and also your wait time goes down maybe to almost a couple of weeks and so right now all of the seismic acquisition companies have downsized quite a bit they are still trying to to get work for their people for their company companies are still looking at new areas they are still requiring new seismic data companies that have fields that are on production they are still acquiring seismic data at a higher density a higher data quality so that they can make the right business decisions on how to manage the field so as the price of oil drops and you're in a oil and gas production phase you have to try to save money as well and it may sound counterintuitive but it may be beneficial to spend a few million dollars on acquiring better seismic data so that you can position your wells better the other area that acquisition is quite active is in our resource plays or unconventional plays so places like the Williston Basin and the basins in West Texas where there's a lot of unconventional oil and gas drilling going on I believe that the seismic acquisition activity is pretty high in those areas great Norman asked do airguns produce enough energy to go through the whole water depth and reach to the seafloor with high energy or weak signals reach to the seafloor oh with the air guns we are able to get energy down to 40 to 50,000 feet so we don't have trouble generating enough energy to get down to and even beyond the zone of interest that we're interested in right so that's all the questions but people wrote in thank you for this exciting Q&A session Fred and we look forward to Thursday on-site and processing so thank you everyone okay thanks everyone for your interesting for your questions and all you again on Thursday okay all right bye everyone hey goodbye
Up Next
16:09
Toroidal Propellers: Redefining Marine and Aviation Efficiency
@TwoBitDaVinci
454.8K views•2023-04-13
30:32
Ultrasonic Transducers: Resonant Frequency Measurement and Horn Design
@imajeenyus42
229.9K views•2017-02-22

54:16
Polymer Environmental Degradation: Mechanisms & Stabilization
@iit
1.8K views•2012-07-10
33:39
How a Student's Question Saved a NYC Skyscraper from Collapse
@veritasium
22.8M views•2025-04-26
Related Study Plans & Knowledge Roadmaps
Structured learning paths in Engineering
engineering
Building Acoustic Levitators: Physics & Arduino
01The Physics of Sound and Standing Waves
02Piezoelectric Transducers and H-Bridge Drivers
03Arduino Programming: Generating 40 kHz Signals
+ 2 more learning modules
14h5 modules
Explore Roadmap
engineering
Building Peltier Cloud Chambers: Particle Tracks
01Cosmic Rays & Cloud Chamber Physics
02Thermoelectric Cooling (TEC) Fundamentals
03Custom Liquid-Cooling Loop Design
+ 2 more learning modules
18h5 modules
Explore Roadmap
engineering
Yagi-Uda Antennas: Modeling, Build & VNA Test
01Introduction to RF and Antenna Fundamentals
02Yagi-Uda Antenna Design Principles
03Antenna Modeling and Simulation in 4NEC2
+ 2 more learning modules
18h5 modules
Explore Roadmap
engineering
ECG Monitor Design: Op-Amps, Filters & Noise
01Electronics & Breadboard Basics
02Op-Amps and Instrumentation Amplifiers
03Bioelectricity and ECG Fundamentals
+ 2 more learning modules
18h5 modules
Explore Roadmap