Urban trees reduce summer heat through two primary mechanisms: shade, which blocks direct solar radiation, and evapotranspiration, which releases water vapor that cools the surrounding air; however, effective urban tree planting requires adequate water infrastructure and maintenance, making partnerships with institutions like schools essential for successful implementation in built-up areas.
How Urban Forests Reduce Summer Heat: Trees, Shade, and Equity
Added:Deep Dive
The fundamental concept of the Urban Heat Island (UHI) effect, including why urban areas experience higher temperatures than surrounding rural regions.

ESE 2025 Prelims | Energy and Environment | One Shot Revision by MADE EASY
15.6K
Urban Heat Island (UHI) is a phenomenon where urban areas experience higher temperatures than surrounding rural areas. It occurs because: (1) Urban areas have more industries and vehicles, (2) Less vegetation, (3) More concrete structures, and (4) Heat from air conditioners and refrigerators. When isotherms are drawn, urban areas show upward bending, creating a dome-shaped structure of heat energy over urban areas. The concept was given by Luke Howard in 1800 while studying London's temperature.
Click to watch →

UPSC Geography Terminology Series | Urban heat island and Urban wind cell | StudyIQ IAS
5.9K
Urban Heat Island (UHI) is a phenomenon where urban areas experience significantly higher temperatures than surrounding rural areas. The effect is caused by multiple factors: anthropogenic heat from fossil fuel burning, vehicle emissions, and industrial activities; low albedo from dark-colored surfaces like asphalt and concrete that absorb rather than reflect solar radiation; and reduced evapotranspiration due to lack of vegetation. Temperature differences range from 5-7°C during the day and up to 9-10°C at night. The effect is more pronounced at night because rural areas cool rapidly without anthropogenic heat sources, while urban areas retain heat.
Click to watch →

Fundamentals of Extreme Heat and Climate Change with Dr. Ladd Keith of University of Arizona
2.3K
The Urban Heat Island (UHI) effect is a phenomenon where cities become significantly warmer than their surrounding rural areas due to the built environment. This occurs because construction materials, waste heat from vehicles and air conditioners, and reduced vegetation create additional heat. Cities can be up to 20 degrees Fahrenheit warmer than their rural surroundings. This effect has been documented since 1818 by meteorologist Luke Howard in London, but serious planning attention to it has only emerged in the last decade.
Click to watch →

Pollution dome,Urban heat island,Urban wind cell and other related concepts.
769
Urban Heat Island (UHI) is a phenomenon where urban areas experience significantly higher temperatures than surrounding rural areas. This occurs due to several factors: (1) Concrete structures and buildings absorb and retain heat, (2) Reduced green spaces and vegetation, (3) Decreased water bodies, and (4) Lower albedo (reflectivity) of urban surfaces. The inverse relationship between albedo and absorption means surfaces with low reflectivity absorb more solar radiation and heat up more. Rural areas with more natural landscapes, water bodies, and vegetation remain cooler. This temperature difference creates pressure gradients that drive air circulation patterns.
Click to watch →

Urban heat islands
215
Urban Heat Island (UHI) is a phenomenon where urban areas experience significantly higher temperatures compared to their surrounding rural areas. This occurs because urban environments contain materials like concrete and asphalt that absorb and retain heat, while rural areas have more natural surfaces like soil and vegetation that moderate temperature. The temperature difference between urban and rural areas can be substantial, with urban areas often being several degrees warmer.
Click to watch →
Deep Dive
Basic plant physiology, specifically the process of evapotranspiration and how plants regulate their temperature and moisture.

Transpiração vegetal - Biologia - Ensino Médio
38.3K
Transpiration is the process by which plants release water in vapor form through specialized structures called stomata located on the underside of leaves. This process, also known as evapotranspiration, serves two primary functions: maintaining the circulation of xylem sap (seiva bruta) throughout the plant and regulating plant temperature. When environmental temperature rises, plants increase transpiration to cool themselves, as water has a high specific heat capacity that absorbs excess heat during evaporation, preventing metabolic disruption.
Click to watch →

Transpiration in Plants / B.Sc 2 year Botany/ Plant physiology and Biochemistry
232.8K
Transpiration regulates plant temperature by converting water to vapor, which requires heat energy. During hot conditions, leaves can increase temperature by up to 36°C per minute due to solar radiation. Transpiration cools the plant by releasing water vapor. Additionally, transpiration serves as an excretory mechanism, eliminating harmful metabolic waste products and excess substances from the plant body. This dual function makes transpiration essential for plant survival despite water loss.
Click to watch →

🔴 ПРЯМОЙ ЭФИР! LIVE Смешарики. ПИН - код | Познавательные мультфильмы
718.3K
Plants regulate their temperature through transpiration, the process by which water evaporates from leaf surfaces. As water evaporates, it absorbs heat from the plant, effectively cooling it. This is similar to how sweating cools humans. The rate of transpiration depends on environmental conditions: stomata (leaf pores) open wider in hot conditions to increase cooling, and close in cold conditions to conserve water.
Click to watch →

٣- الإخراج في النبات 🌿🥀أحياء تانية ثانوي الترم الثاني ♥️
450.8K
Transpiration helps regulate plant temperature through evaporation of water, similar to how sweating cools humans. When water evaporates from leaf surfaces, it absorbs heat and lowers the temperature of the protoplast (living part of the cell). This prevents damage to cellular structures and maintains optimal conditions for metabolic processes.
Click to watch →

احياء الخامس علمي 2026 | الفصل الخامس | المحاضرة 1
173.4K
This section covers how plants manage water movement and temperature. Water is transported from roots to leaves through three methods: transpiration through leaves, water uptake through roots, and replacement of lost water. Transpiration releases excess water through stomata on leaf surfaces, with over 90% of water lost this way. Plant temperature increases due to sunlight and metabolic processes, and plants cool themselves through water evaporation from cell walls. Three factors increase transpiration rate: decreased humidity, increased temperature, and increased wind speed.
Click to watch →
Deep Dive
The concept of albedo and how different surface materials (such as asphalt, concrete, and soil) absorb and reflect solar radiation.
Earth As a System NCERT Line By Line Explanation | Class 9 New NCERT Science 2026-27 |Nikita Ma'am
1.2K
Different materials absorb and heat differently under sunlight. Land heats faster than water. Dark surfaces absorb more sunlight and heat up quickly, while light surfaces reflect more and remain cooler. Albedo measures the fraction of solar radiation reflected by a surface. High albedo surfaces (like snow with 0.80-0.90) reflect most sunlight and stay cool. Low albedo surfaces (like black soil and ocean water) absorb more heat and warm up quickly. This principle explains why wearing dark clothes in summer feels hotter, why concrete buildings heat up faster than mud houses, and why snow-covered areas remain cold while dark surfaces become warm under the same sunlight conditions.
Click to watch →
Ilhas de Calor e Inversão Térmica - Prof. Fábio Monstro
25.4K
Albedo refers to a surface's ability to reflect solar energy. Urban surfaces like asphalt and concrete have low albedo, meaning they absorb rather than reflect solar radiation. This absorption of energy contributes to increased temperatures in urban areas. The more asphalt and concrete present, the lower the albedo, and the greater the heat storage capacity of the surface.
Click to watch →

ปัจจัยที่มีผลต่อการรับรังสี ตอนจบ
468
Different surface materials on Earth have varying abilities to absorb and reflect solar radiation. Dark surfaces like asphalt roads absorb more solar radiation and convert it to heat, while light-colored surfaces like snow reflect more radiation. Albedo measures a surface's reflectivity, with snow having a high albedo of approximately 0.9 (reflecting 90% of radiation) and asphalt roads having a low albedo of approximately 0.04 (absorbing 96% of radiation). This difference in absorption properties affects local temperatures and contributes to phenomena like urban heat islands.
Click to watch →

SOS ProEnem 2020 | Clima | Geografia | Leandro Almeida
37.7K
Albedo is the rate of solar radiation reflection. Dark surfaces have low albedo (absorb more radiation, causing more heating), while light surfaces have high albedo (reflect more radiation, causing less heating). This explains why wearing dark clothes feels hotter than light clothes in the sun, and why polar regions are cold partly due to high albedo from ice and snow reflecting solar radiation.
Click to watch →

1 Ano - Aula: Fatores Climáticos (Albedo, Massas De Ar, Continentalidade E Maritimidade)
317
Albedo measures a surface's reflectivity of solar energy. High-albedo surfaces reflect more energy and absorb less, while low-albedo surfaces absorb more heat. Examples: asphalt (5%), concrete (similar), dark earth (8%), green fields (20%), dry wheat (30%), desert sand (45%), snow-covered mountains (90%). This explains urban heat islands where asphalt and concrete create higher temperatures. Albedo depends on surface chemical composition, not just color. Surfaces with low albedo absorb more solar energy, heating the adjacent atmosphere, while high-albedo surfaces reflect energy back into space, cooling the local environment.
Click to watch →
Deep Dive
An introductory understanding of environmental justice and social equity, particularly how socioeconomic factors influence access to natural resources.

ESS topic 1 Compilation (new syllabus)
13.7K
Environmental justice is the right of all people to live in pollution-free environments with equitable resource access regardless of race, gender, or socioeconomic status. Equitable differs from equal—people get what they need, not identical amounts. Environmental injustice occurs when marginalized communities disproportionately bear pollution burdens. Examples include the Deepwater Horizon oil spill disproportionately affecting low-income Gulf Coast communities, NIMBY (Not In My Backyard) policies placing landfills in poor neighborhoods lacking legal resources, the 1984 Bhopal gas tragedy in India's densely populated low-income areas, and Masai displacement for conservation creating safari tourism profits while indigenous peoples lose ancestral lands.
Click to watch →

Unequal Grounds: Advancing Environmental Justice - Mutually Inclusive
931
Communities are set up based on socioeconomic factors, affecting access to engage with the environment. Questions about who can access parks, whether outdoor spaces are safe, and who can vacation at national parks reveal environmental inequities.
Click to watch →

Intervento integrale Alex Langer Assisi 1994 su "Futuro amico"
2.8K
Environmental protection and access to nature are more critical for the poor than for the wealthy. The wealthy can purchase nature, create synthetic alternatives, or visit inaccessible locations, while the poor depend on clean water, accessible natural spaces, and sustainable resources for their quality of life. This perspective frames environmentalism not as a luxury hobby for the privileged but as a fundamental issue of social justice and equity, requiring those with resources to advocate for environmental protection that benefits all people.
Click to watch →
👨 Saber Direito - Direito Ambiental - Aula 1
16K
Since natural resources are not infinite, equity in their use is necessary, focusing on both environmental and social justice. The environmentally excluded are those without access to minimum natural resources for life—people lacking clean water, quality soil for agriculture, or recreational areas. This exists due to wealth distribution problems that must be corrected. Equity ensures access to environmental resources for all, derived from Article 225 (environment belongs to everyone) and Article 3 of the Constitution (reduction of inequalities and elimination of poverty).
Click to watch →

NMC #10 - INCÊNDIOS FLORESTAIS E COMBATE A INCÊNDIOS
215
Environmental justice requires attention to social equity: (1) Environmental hazards often disproportionately affect vulnerable communities; (2) Environmental protection should be a priority for all communities; (3) Environmental justice requires addressing both environmental and social inequalities; (4) Communities have the right to a healthy environment; (5) Environmental justice requires conscious effort to address historical and ongoing environmental injustices.
Click to watch →
Prerequisite Knowledge
- Concept 01The fundamental concept of the Urban Heat Island (UHI) effect, including why urban areas experience higher temperatures than surrounding rural regions.
- Concept 02Basic plant physiology, specifically the process of evapotranspiration and how plants regulate their temperature and moisture.
- Concept 03The concept of albedo and how different surface materials (such as asphalt, concrete, and soil) absorb and reflect solar radiation.
- Concept 04An introductory understanding of environmental justice and social equity, particularly how socioeconomic factors influence access to natural resources.
Subsequent Learning
- Step 01Urban forestry management practices, including species selection for climate resilience, soil volume requirements, and long-term tree maintenance strategies.
- Step 02Using Geographic Information Systems (GIS) and remote sensing data to map urban canopy cover and identify priority zones for greening initiatives.
- Step 03Policy instruments and urban planning frameworks, such as green roof mandates, zoning laws, and municipal tree ordinances.
- Step 04Microclimate modeling techniques to simulate and quantify the cooling benefits of various urban design interventions.
Canopy Study
Cooling Methods
Canopy Study
0:00Playing Section
- 1
Tree San Diego measures canopy shade effects on urban heat surfaces.
- 2
Unshaded asphalt gets hottest but cools most when shaded.
- 3
Goal to increase canopy coverage to 35% in targeted areas.
Green Gentrification and Urban Forestry Disservices
While urban forests provide vital cooling, critics and researchers highlight the phenomenon of 'green gentrification' and the unintended 'ecosystem disservices' of urban greening. Expanding tree canopies in historically underserved neighborhoods often drives up property values and rents, ultimately displacing the low-income residents these initiatives were meant to help. Furthermore, urban forestry presents resource and environmental trade-offs. In arid or drought-prone regions, the high water demand required to establish and maintain trees can deplete scarce water supplies. From an air quality perspective, dense tree canopies in narrow 'street canyons' can trap vehicular emissions at ground level by restricting wind circulation. Additionally, certain tree species emit biogenic volatile organic compounds (BVOCs) that react to form ground-level ozone, while others exacerbate seasonal allergies through high pollen production. This counterpoint argues that without integrating anti-displacement policies and careful, climate-specific species selection, urban forestry can inadvertently worsen social inequities and local environmental challenges.
Deep Dive
Urban forestry management practices, including species selection for climate resilience, soil volume requirements, and long-term tree maintenance strategies.

ATEE-FNCCR - Rafraîchissement urbain et confort d'été : : on commence par quoi ?
142
Urban permeability assessment evaluates how different surfaces manage water runoff: (1) Considers coefficients of runoff for different materials, (2) Identifies opportunities for permeable surfaces, (3) Assesses trade-offs between permeability and other urban objectives, (4) Supports sustainable urban drainage planning. Urban tree management: (1) Urban trees have shorter lifespans than natural trees (50 years vs. 100+ years), (2) Requires careful species selection for climate resilience, (3) Needs appropriate planting conditions including soil volume and irrigation, (4) Requires maintenance for long-term survival, (5) Biodiversity considerations should guide species selection. Effective urban tree management balances cooling benefits with long-term sustainability.
Click to watch →

Toolbox Tuesday: Extreme Heat Mitigation
264
Urban greening serves as a critical adaptation strategy against rising temperatures, offering multiple co-benefits including improved mental health, reduced air pollution, enhanced active transportation, energy savings, stormwater reduction, and GHG emission decreases. Effective urban forestry programs require adherence to best practices: site-specific species evaluations, adequate soil volumes for mature canopy development, comprehensive 10-year care plans with watering and pruning, high biodiversity for pest/disease resilience, and community engagement for long-term stewardship. Cities should develop formal management plans and tree ordinances. Tree selection for climate resilience requires evaluating species against projected environmental changes including increased temperatures, altered precipitation, and higher salinity from recycled water. Multiple geospatial tools aid decision-making: USDA canopy data overlays with pollution and health indicators, California Healthy Places Index identifies social vulnerability factors, and the California Urban Forest Inventory provides data on 7 million trees. Methodologies involve spatial substitution comparing current species distributions against projected future conditions. Notably, few native tree species are expected to survive future conditions, requiring inclusion of both native and non-native options in resilient palettes.
Click to watch →

Montgomery Planning Board Live Stream: 11/6/25
159
Trees in urban areas may die due to extreme heat, inappropriate soil volumes, species selection, and diseases. Streetscape standards should address this by: (1) revising tree lists based on site conditions (shade, overhead wires, existing species), (2) providing guidance on maximizing soil volumes and improving planting methodologies, (3) separating storm water management systems from tree planting beds to allow trees to reach maturity, and (4) introducing climate-resilient species mixes to reduce vulnerability to diseases and infestations.
Click to watch →

Waldbegehung Taubensuhl 2020
658
Urban forests face interconnected challenges from climate change requiring adaptive management strategies. The city of Landau manages 2,500 hectares of forest providing climate regulation, drinking water, hunting, and recreation. Climate change creates core problems: if climate-stable species are eaten by wildlife, forests lose diversity. The bark beetle (Borkenkäfer) exemplifies these challenges—warm summers enable infestations where adults bore into bark, larvae destroy the cambium layer, causing rapid tree death. Hot, dry summers with insufficient winter precipitation cause widespread drought damage across most species, with beech being particularly vulnerable. Foresters adapt by selecting 'future trees' based on vitality, stem quality, and crown development potential over 200 years. The city's forest distribution (30% beech, 30% pine, 11% high-quality oak) reflects regional soil conditions. Oak serves as a core climate-resilient species, with the strategy emphasizing diverse species mixtures for long-term forest resilience.
Click to watch →
Growing trees for climate change resilient cities
166
Urban forests serve as essential nature-based solutions for climate change resilience, providing multiple ecosystem services including carbon storage, temperature reduction, flood prevention, and improved human health and wellbeing; effective urban forestry requires long-term maintenance planning, appropriate species selection based on local ecological criteria, and integration into comprehensive urban nature plans to ensure sustainable urban green infrastructure development.
Click to watch →
Deep Dive
Using Geographic Information Systems (GIS) and remote sensing data to map urban canopy cover and identify priority zones for greening initiatives.
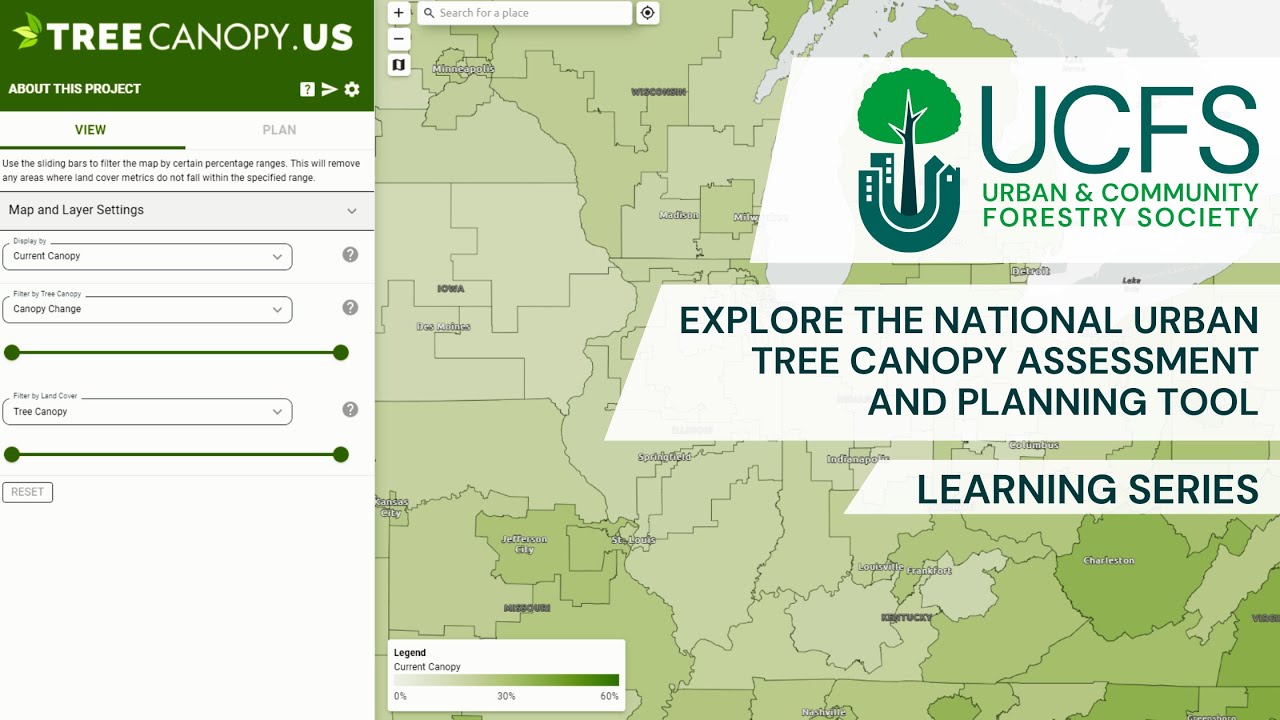
Mapping Urban Forests: Explore the National Urban Tree Canopy Assessment and Planning Tool
173
TreeCanopy.US includes a planning tool enabling multi-criteria analysis for identifying priority areas for urban tree canopy expansion. Users can filter and color-code maps by canopy cover levels, canopy change, herbaceous land cover (planting opportunities), heat risk scores, and demographic data. This supports grant applications and policy development by visually demonstrating where urban greening investments will maximize impact. Technical implementation uses USDA NAPE imagery from 2022-2023 with some states using 2021 data; prior to 2014, no suitable high-resolution digital imagery existed. The assessment covers census urban areas with populations of 5,000+ (recently expanded to 1,000+), including US territories with alternative methodologies. For standardized change analysis, new census boundaries are applied to historical data. Continued funding and interagency partnerships will determine future update frequency. Data is available through treeswork.org with downloadable vector and raster formats for advanced GIS integration.
Click to watch →

IanHanou UrbanForestryApps 3 29 2016
213
This section covers landscape-scale urban forest analysis and canopy assessment tools. The workflow includes remote sensing and land cover classification using multispectral imagery, object-based image analysis for high-resolution analysis, quality control processes, and summarization of canopy data based on target geographies (citywide, watershed boundaries, political districts, neighborhood, or block level). The tools enable filtering data with slider bars to show areas meeting specific quantitative measurements including air quality, urban heat islands, vulnerable populations, and socioeconomically disadvantaged areas. The software provides View, Plan, and Grow functions for assessing urban forest conditions and identifying priority areas for tree planting.
Click to watch →

Urban Tree Canopy Assessments
362
Canopy assessment data enables sophisticated urban planning analysis through GIS overlay capabilities. Applications include: evaluating development code effectiveness by comparing canopy before and after construction; identifying urban heat island hotspots through canopy-to-impervious surface ratios; determining priority areas using equity indices combining canopy, income, and health data; and analyzing historical land use patterns. Case studies demonstrate practical applications: Louisville used three assessments (2004-2012) to identify rapid heat island growth and project future trends; Cleveland developed an equity index directing canopy improvements to areas of highest need; Tallahassee revealed canopy growth coincided with agricultural-to-residential land conversion.
Click to watch →

Understanding Our Urban Forest Assets: Methods of Tree Inventory and Urban Tree Canopy Analysis
304
Urban tree canopy analysis serves multiple applications: quantifying total tree canopy cover in an area; prioritizing tree planting and protection efforts by identifying areas with low canopy but high planting potential; informing municipal urban forestry policies; supporting goal-setting for canopy cover targets; and educating the public and decision-makers about urban forest resources. When combined with other GIS layers showing land use, ownership, and socioeconomic attributes, canopy data enables sophisticated analysis for strategic planning. For example, queries can identify parcels with less than 20% existing canopy but greater than 20% available planting area, guiding targeted outreach and policy interventions to increase canopy coverage.
Click to watch →
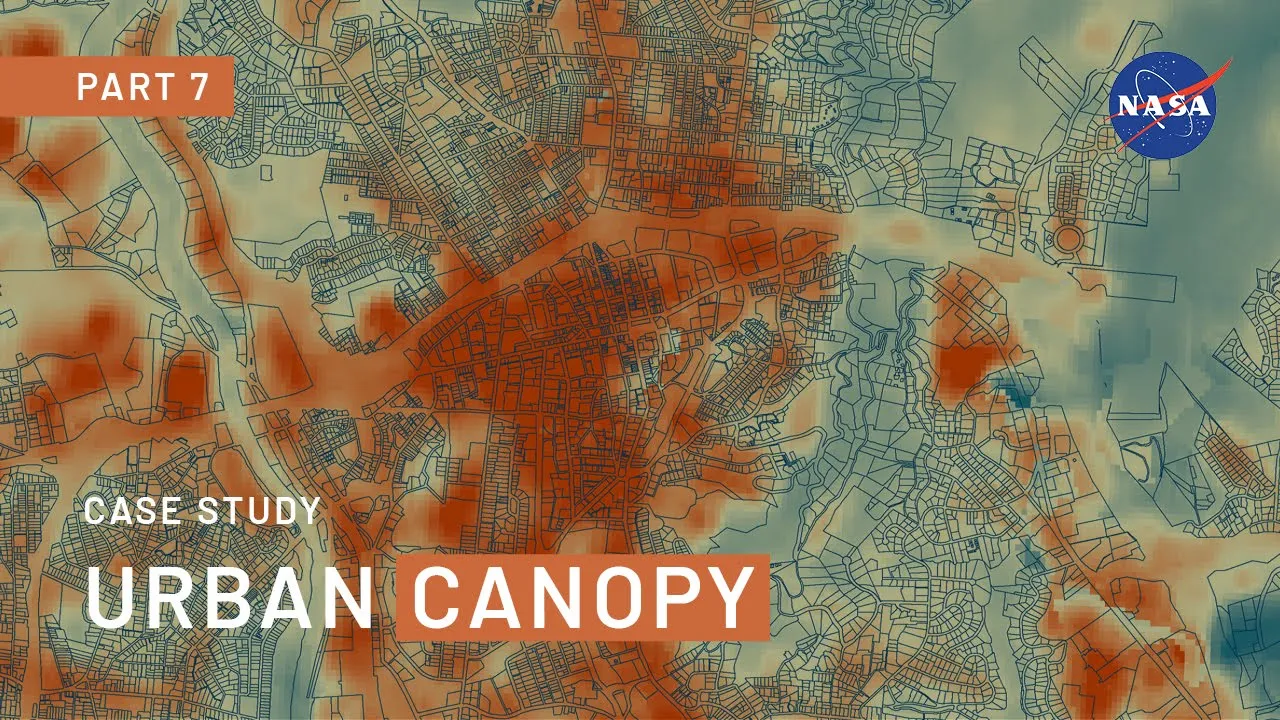
Exploring Your City from Space: Part 7 - Urban Canopy
1.3K
Urban tree canopy refers to the layer of trees, branches, and stems providing ground coverage when viewed from above. The U.S. Forest Service developed assessment protocols in 2006 for mapping land coverage. Evapotranspiration combines water evaporation from surfaces and transpiration through plant leaves, while leaf area index measures green leaf area per unit ground area. Tree canopy mitigates urban heat islands through shading, reflectance, and evapotranspiration. Remote sensing technologies including lidar (for canopy height) and Landsat satellites (for temperature and coverage) enable quantitative analysis. NASA Earthdata and citizen science platforms facilitate data collection for studying urban canopy effects on community health and climate resilience.
Click to watch →
Deep Dive
Policy instruments and urban planning frameworks, such as green roof mandates, zoning laws, and municipal tree ordinances.

4ª Oficina Técnica || Revisão Plano Diretor e LUOS
178
Urban green areas policy includes updating and monitoring the municipal inventory, integrating green areas with mobility systems (shaded sidewalks, bicycle paths), and orienting new green area creation in planned expansion zones to prevent urban heat island formation. The policy instruments framework is based on the City Statute, providing a menu of instruments including tax instruments (IPTU, improvement contribution, fiscal incentives), expropriation, heritage listing, right of first refusal, compulsory subdivision, compulsory use, and land regularization. The selection must be aligned with local diagnosis and applicable to the municipality's reality.
Click to watch →

Estatuto da Cidade #01
2.5K
Urban policy instruments include national, regional, and state territorial planning, metropolitan and urban agglomeration planning, and municipal planning. Key municipal instruments include the Master Plan (Plano Diretor), land use zoning, environmental zoning, and annual budget management. Financial instruments include property taxes (IPTU) and improvement contributions. Legal instruments include expropriation, administrative servitude, conservation units, special interest zones, and compulsory subdivision. The law establishes public participation in environmental impact assessments and urban development decisions.
Click to watch →

This Week in Review - 04.06.12 - Greenroofs.com
196
This segment examines how cities are implementing green infrastructure policies. Toronto became North America's first city to mandate green roofs through a 2009 bylaw applying to new development permits. New York City's Zone Green initiative removes barriers to green buildings, energy efficiency, and rooftop agriculture. The 2012 International Green Construction Code incorporates 46 ASTM standards for residential and commercial structures. These policy frameworks aim to reduce urban heat island effects, manage stormwater runoff, improve air quality, and create green economy workforce opportunities. The segment demonstrates how municipal regulations and building codes can drive sustainable urban development.
Click to watch →

81. Spotkanie Klubu Myśli Ekologicznej – Gil Peñalosa (PL)
327
Effective urban planning requires specific policy instruments: tree planting requirements, green space access standards, and regulations limiting urban sprawl. Cities should mandate minimum green space coverage, require tree planting in new developments, and implement policies that prevent horizontal expansion.
Click to watch →
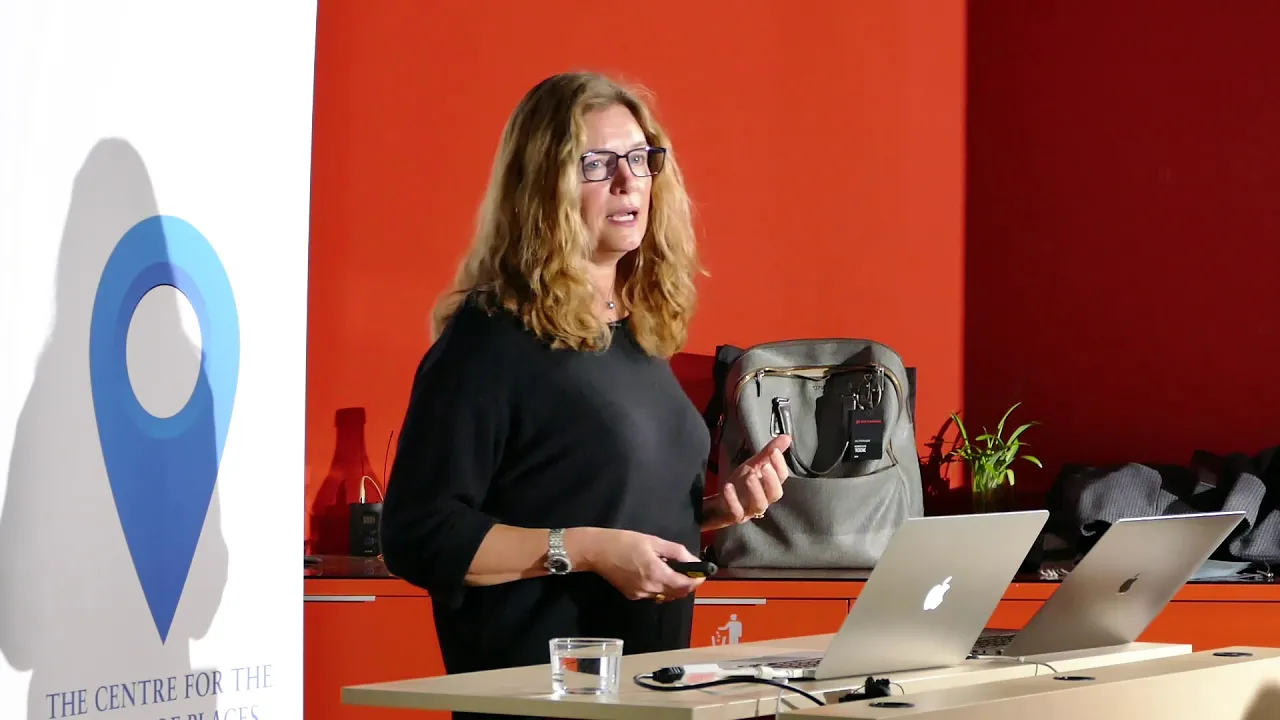
Nina Marie Lister, Athena lecture
616
Toronto has multiple policies for green infrastructure including: North America's first zoning bylaw requiring green roofs for commercial and institutional buildings, the Toronto Green Standard for green buildings, parks and forestry policy for green canopy cover, and stormwater management guidelines. These policies work in tandem with the official plan and zoning bylaws but don't always work together seamlessly.
Click to watch →
Deep Dive
Microclimate modeling techniques to simulate and quantify the cooling benefits of various urban design interventions.
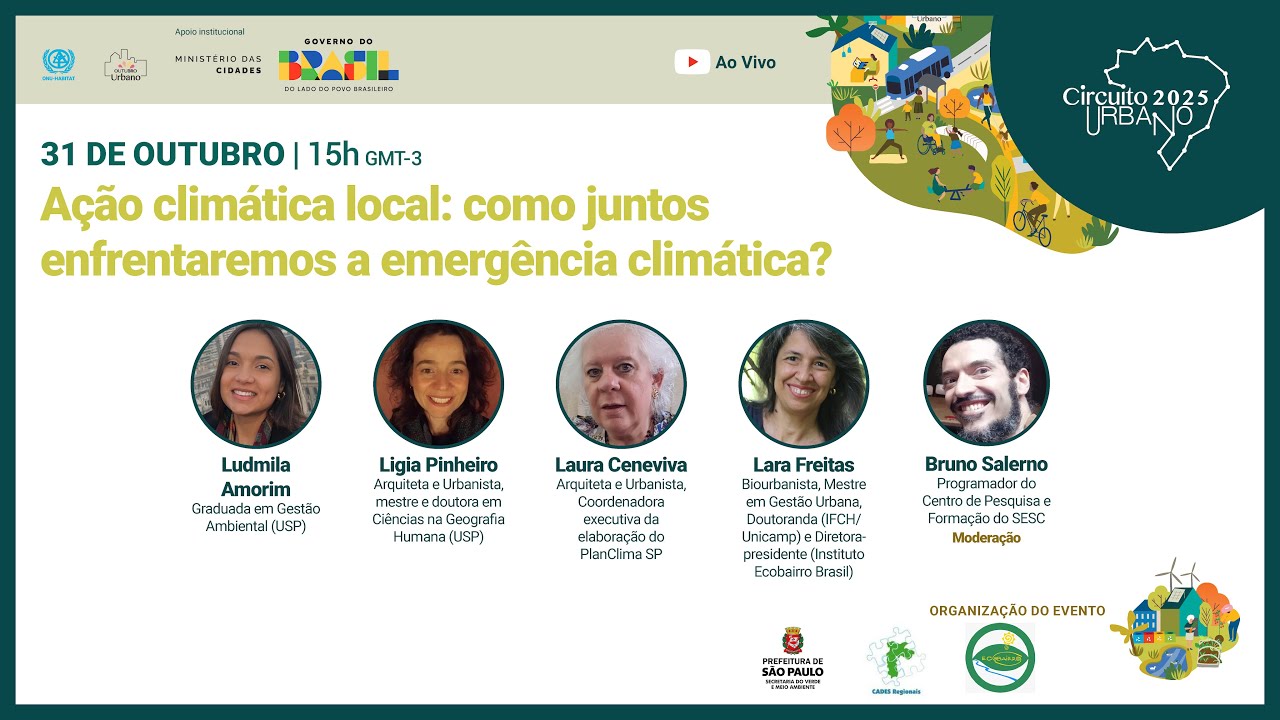
Ação climática local: como juntos enfrentaremos a emergência climática
238
Microclimate analysis uses computational modeling (Envimet) to simulate temperature conditions at local scales (200-400m). The methodology involves selecting critical areas based on different criteria: areas with potential for verticalization (Vila Mariana), areas with high temperature (Perus), and central areas (São Lucas). Simulations test how urban form affects temperature: increased vegetation shows minimal reduction; verticalization creates shade during the day but reduces nighttime cooling; building setbacks improve ventilation. Key recommendations include increasing tree coverage on streets and within city blocks, recognizing that different tree sizes have different cooling effects, and improving building codes based on local climate conditions.
Click to watch →
VIP-SMUR — Fa24 — Microclimate-UMCF
168
This video presents a computational platform called Microclimate UNCCF that enables architects and urban designers to simulate urban microclimates using Grasshopper plugins, addressing the challenge of translating complex OpenFOAM simulation parameters into accessible design tools; the platform includes vegetation parameter studies showing that tree height significantly affects cooling potential, with taller trees providing greater temperature reduction and humidity increase, while also demonstrating how urban form typologies (rectilinear, radial, organic) influence microclimatic conditions through factors like street orientation, building height variation, and sky view factor.
Click to watch →
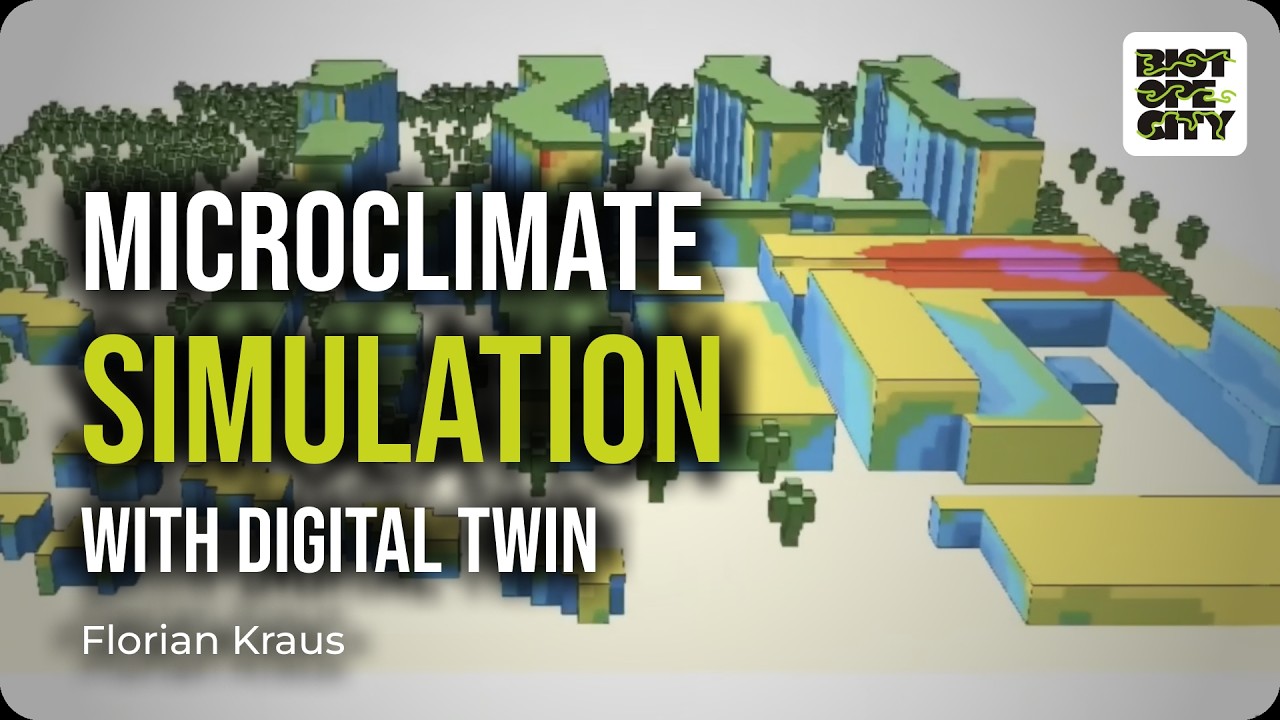
Symposium Biotope City | Florian Kraus: Micro-climate simulation
136
Computer-controlled micro-climate simulation enables targeted optimization of urban green infrastructure, achieving significant cooling effects (up to 2.2°C air temperature reduction and over 20°C perceived temperature reduction) at minimal cost (approximately 2% of construction costs), demonstrating that strategic climate-resilient urban design can be both economically viable and environmentally effective.
Click to watch →
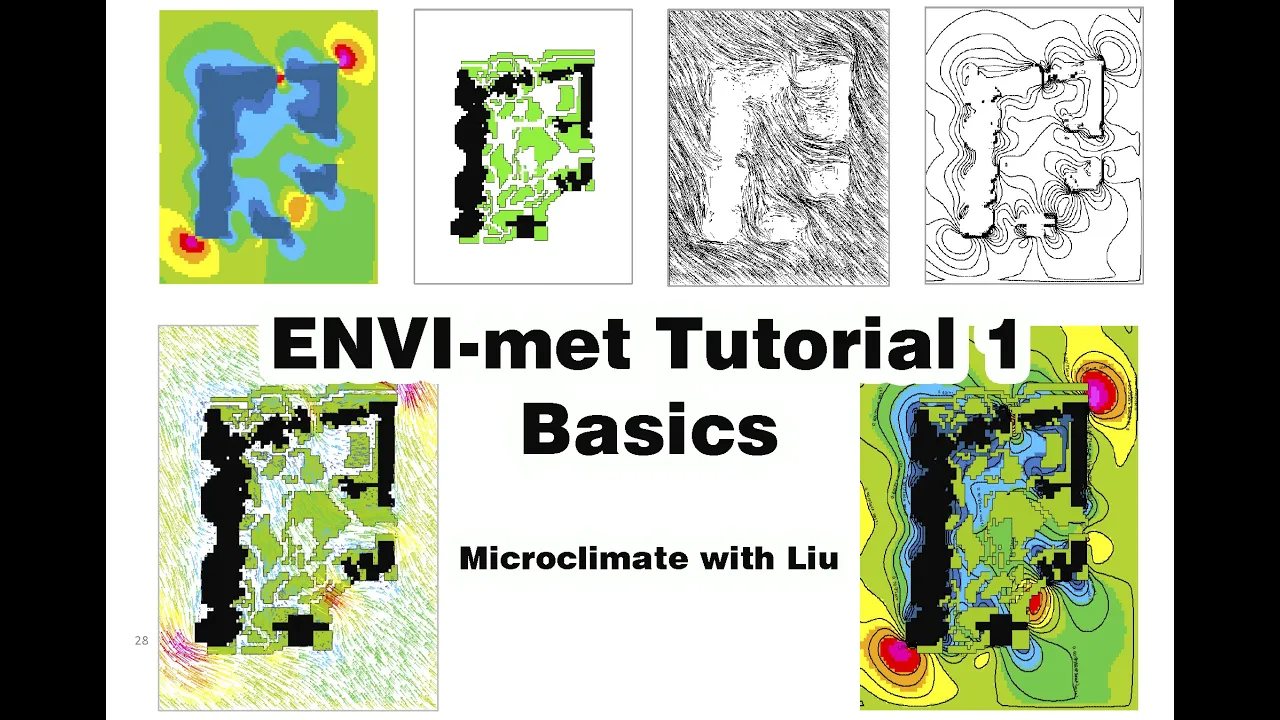
ENVI-met tutorial 1 -- Basics
37.7K
ENVI-met is a holistic three-dimensional microclimate CFD model developed by Michelle Bruce in 1998 that simulates urban environments by capturing the impacts of geometry and surface materials on microclimate conditions through principles of fluid mechanics, thermodynamics, and atmospheric physics; the complete workflow involves four essential steps: (1) Building models using the Spaces program where users define terrain, buildings, vegetation, and surfaces within a 3D grid system with resolutions from 0.5 to 10 meters, (2) Setting background meteorological conditions through EnviGuide with three levels of complexity from basic temperature and wind settings to advanced hourly data inputs, (3) Running simulations in the core program which processes the model and outputs comprehensive microclimate parameters including air temperatures, relative humidity, wind patterns, and surface temperatures, and (4) Visualizing results using Leonardo post-processing tool which generates 2D maps with data, spatial, vector, and contour layers, and 3D visualizations showing air flow trajectories and particle movements to analyze urban thermal environments.
Click to watch →
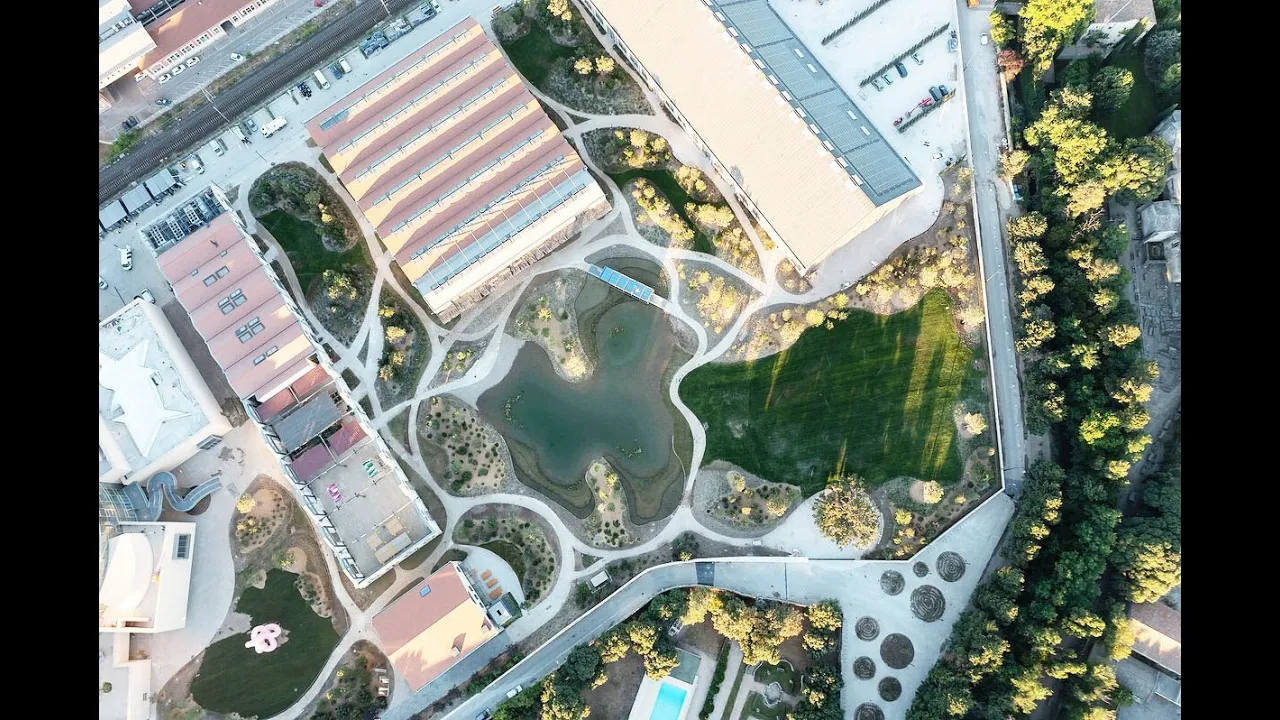
Daniel Urban Kiley Lecture: Bas Smets, “Biospheric Urbanism”
9.5K
This segment demonstrates how systematic microclimate analysis transforms urban design practice. In London, temperature measurements revealed 3-4°C differences in courtyards surrounded by high facades, leading to subtropical forest interventions with tree ferns and misting systems. In La Défense, creating tree lines required identifying non-plantable zones and designing continuous soil systems beneath bridge structures—achieving 53cm of soil across 4,000m² to support 50+ trees. These projects illustrate that successful urban climate adaptation requires understanding specific site conditions before proposing interventions, whether through humidification, shading, or strategic vegetation placement.
Click to watch →
Canopy Study
Cooling Methods
Canopy Study
0:00- 1
Tree San Diego measures canopy shade effects on urban heat surfaces.
- 2
Unshaded asphalt gets hottest but cools most when shaded.
- 3
Goal to increase canopy coverage to 35% in targeted areas.
Green Gentrification and Urban Forestry Disservices
While urban forests provide vital cooling, critics and researchers highlight the phenomenon of 'green gentrification' and the unintended 'ecosystem disservices' of urban greening. Expanding tree canopies in historically underserved neighborhoods often drives up property values and rents, ultimately displacing the low-income residents these initiatives were meant to help. Furthermore, urban forestry presents resource and environmental trade-offs. In arid or drought-prone regions, the high water demand required to establish and maintain trees can deplete scarce water supplies. From an air quality perspective, dense tree canopies in narrow 'street canyons' can trap vehicular emissions at ground level by restricting wind circulation. Additionally, certain tree species emit biogenic volatile organic compounds (BVOCs) that react to form ground-level ozone, while others exacerbate seasonal allergies through high pollen production. This counterpoint argues that without integrating anti-displacement policies and careful, climate-specific species selection, urban forestry can inadvertently worsen social inequities and local environmental challenges.
The fundamental concept of the Urban Heat Island (UHI) effect, including why urban areas experience higher temperatures than surrounding rural regions.
Basic plant physiology, specifically the process of evapotranspiration and how plants regulate their temperature and moisture.
The concept of albedo and how different surface materials (such as asphalt, concrete, and soil) absorb and reflect solar radiation.
An introductory understanding of environmental justice and social equity, particularly how socioeconomic factors influence access to natural resources.
Urban forestry management practices, including species selection for climate resilience, soil volume requirements, and long-term tree maintenance strategies.
Using Geographic Information Systems (GIS) and remote sensing data to map urban canopy cover and identify priority zones for greening initiatives.
Policy instruments and urban planning frameworks, such as green roof mandates, zoning laws, and municipal tree ordinances.
Microclimate modeling techniques to simulate and quantify the cooling benefits of various urban design interventions.
467 views14likes3:11@KPBSOriginal Release: 2024-08-08
we all know that shade from a tree is a welcome relief from the Summer sun a group called Tree San Diego wanted to better understand how and how well trees do their job edge of the canopy we're in Memorial Park in Chula Vista this is one of the places Tree San Diego came to to measure the trees and the shade that was cast by their canopies for us the tree canopy was more the SI is more of the size of the can B where we're studying shading Veronica Ferman is the leader of a study for Tree San Diego they wanted to understand how trees can reduce high temperatures in urban heat Islands in cities it's not just about the shade trees cast it's a matter of how trees interact with the built environment each material such as asphalt concrete have different their own thermal properties compared to like grass and dirt so when you're measuring uh surface temperature under a tree canopy you're also dealing with what type of surface material you're studying asphalt they have found gets the hottest when it's unshaded it also cools down the most dramatically when it is shaded the goal of Tree San Diego and the city of San Diego is to increase tree canopy coverage to 35% in the area surrounding Chula vista's Memorial Park it's only 9% canopy density is a good indicator of the wealth of a community tree Equity score.org rates the quality of tree canopies on a scale of 1 to 100 in San Diego County National City is at 63 and Cenas scores 89 these are things we can see from space we can measure them from space the urban areas themselves are much hotter than the corresponding areas around them that are not heavily built up Morgan Levy is a member of UC San Diego's heat Hub which studies Urban heat islands and how tree canopies can affect their temperatures she points out that shade isn't a tree's only cooling tool evapo transpiration the production of water vapor by plants also can work to reduce Urban heat Levy sometimes partners with Tree San Diego she says it's tempting to say just plant trees but those trees need to be watered and maintained water infrastructure is very key to our capacity to go around planting trees everywhere and in particular go around planting trees in some of the more heavily built up Urban environments um that house some of the Region's more disadvantaged populations Ferman says that's why Tree San Diego is always looking for partners like school districts in this area of Chila Vista many of schools need trees they are the perfect place to plant plant trees because they usually have someone taking care of ready of the trees already in the school another step toward creating a healthy Urban Forest Thomas fudge KPBS news
Up Next

4:03
Melbourne's Urban Forest Strategy: Building Climate-Resilient City Trees
@MelbourneCityCouncil
39.6K views•2011-11-16

15:54
Life in Biosphere 2: Sustainable Ecosystems & Human Survival
@TED
334.9K views•2009-06-16

5:22
California's New Desalination Regulations Explained
@KPBS
597 views•2015-05-12
10:28
Ice Stupa Artificial Glaciers: Solving Ladakh's Water Crisis
@SonamWangchuk66
3.2M views•2015-05-03
Related Study Plans & Knowledge Roadmaps
Structured learning paths in Environmental Science
environmental-science
Ocean Noise: Cetacean Impacts & Mitigation
01Fundamentals of Underwater Acoustics
02Marine Mammal Bioacoustics
03Anthropogenic Noise: Shipping & Seismic Surveying
+ 2 more learning modules
16h5 modules
Explore Roadmap
environmental-science
Road Ecology: Corridors, Overpasses & Fencing
01Foundations of Habitat Fragmentation and Carnivore Ecology
02The Road Barrier: Ecological Impacts of Transport Infrastructure
03Principles of Ecological Corridors and Connectivity Mapping
+ 3 more learning modules
14h6 modules
Explore Roadmap
environmental-science
Ocean Acidification: Kelp Buffering & Shellfish
01Fundamentals of Ocean Chemistry & pH
02Chemical Pathways of Coastal Acidification
03Bivalve Physiology & Calcification Under Stress
+ 2 more learning modules
18h5 modules
Explore Roadmap
environmental-science
Ice Stupas: Glacial Retreat & Water Security
01Foundations of Glaciology & Mountain Hydrology
02Climate Change and Glacial Retreat Dynamics
03The Science of Ice Stupas & Artificial Glaciers
+ 2 more learning modules
14h5 modules
Explore Roadmap