














![[POR LAS RAMAS] 2.1.1 Datos atípicos SPSS](https://i.ytimg.com/vi_webp/I_Qde_vcsYQ/maxresdefault.webp)

![빅분기 실기 자격증 2시간 집중강의 - [24/25 버전] - 메타코드M](https://i.ytimg.com/vi_webp/WI_t8K60ap0/maxresdefault.webp)



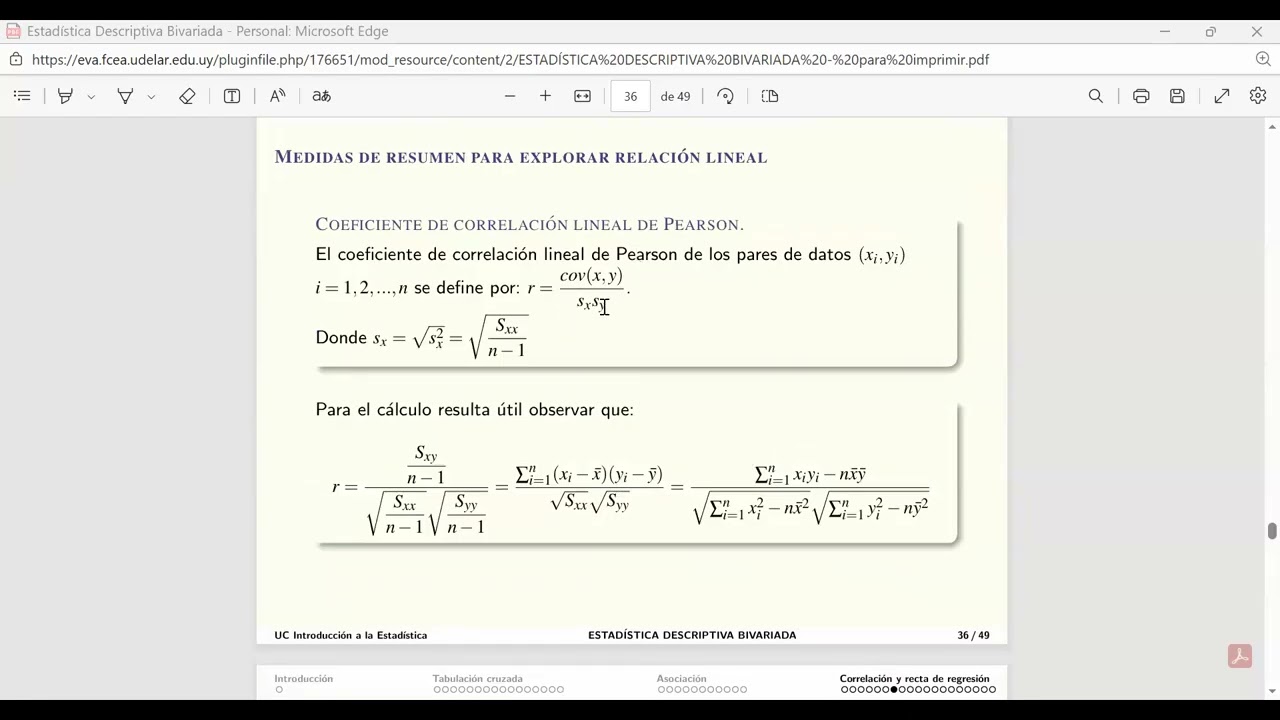


Statistics serves as the mathematical backbone of machine learning, providing essential tools for data analysis including measures of central tendency (mean, median, mode), measures of dispersion (variance, standard deviation, range), and understanding variable types (categorical vs. numerical, discrete vs. continuous). These statistical foundations enable practitioners to analyze data distributions, identify outliers, transform nonlinear problems into linear ones, and build predictive models like linear regression. Key concepts include population versus sample analysis, Chebyshev's theorem for understanding data distribution spread, and the application of expected value and variance laws in algorithm development.
Introduction to Statistics for Data Science Part 1
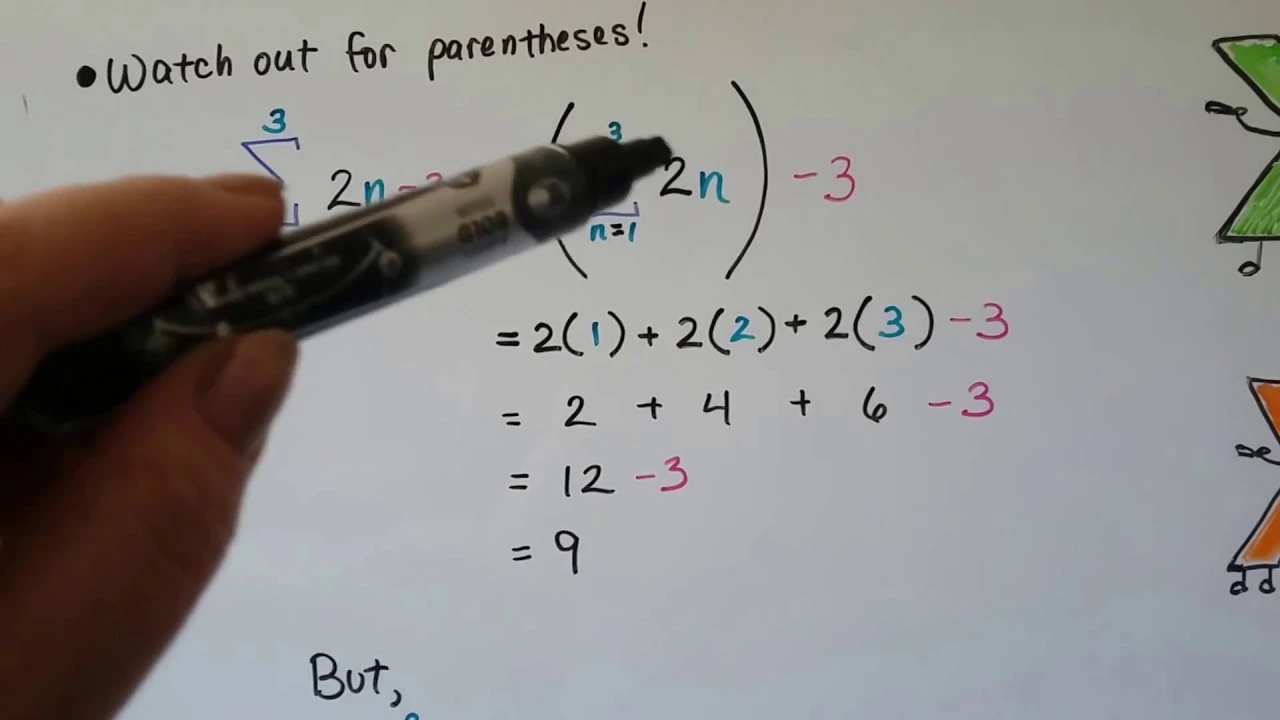
Added:Basic arithmetic and algebra, including the use of summation notation (sigma), fractions, and square roots.
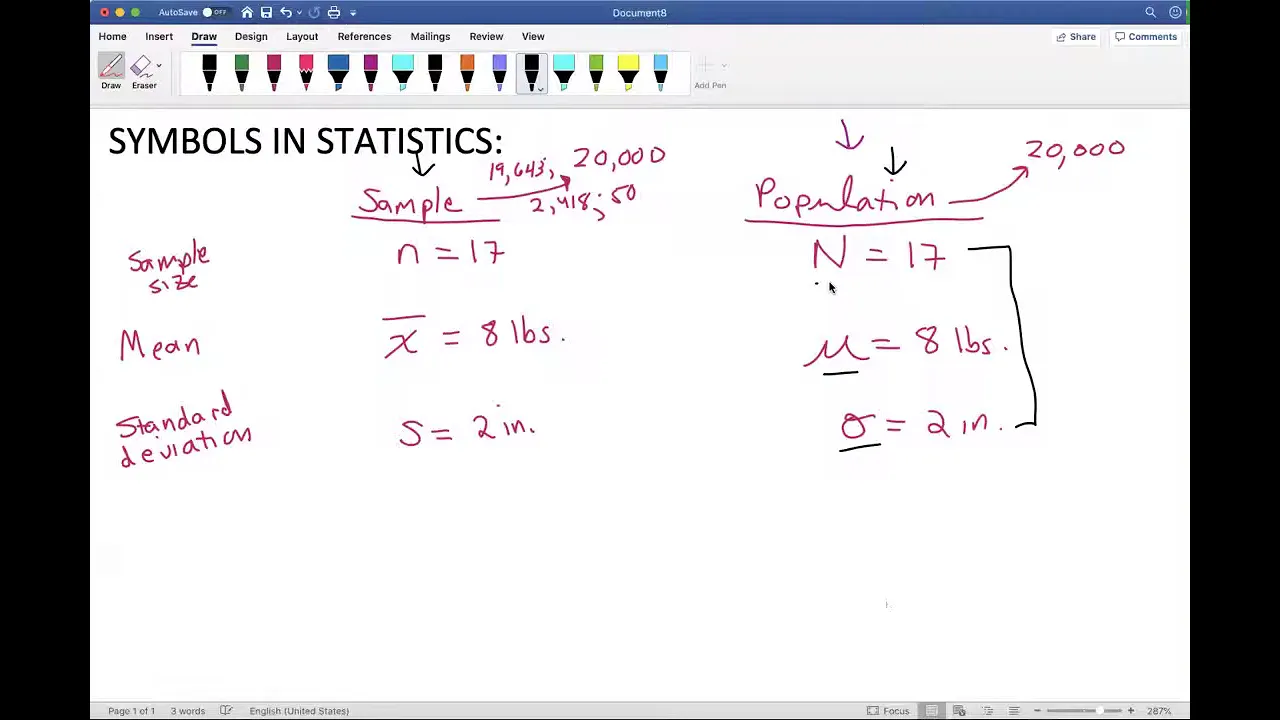
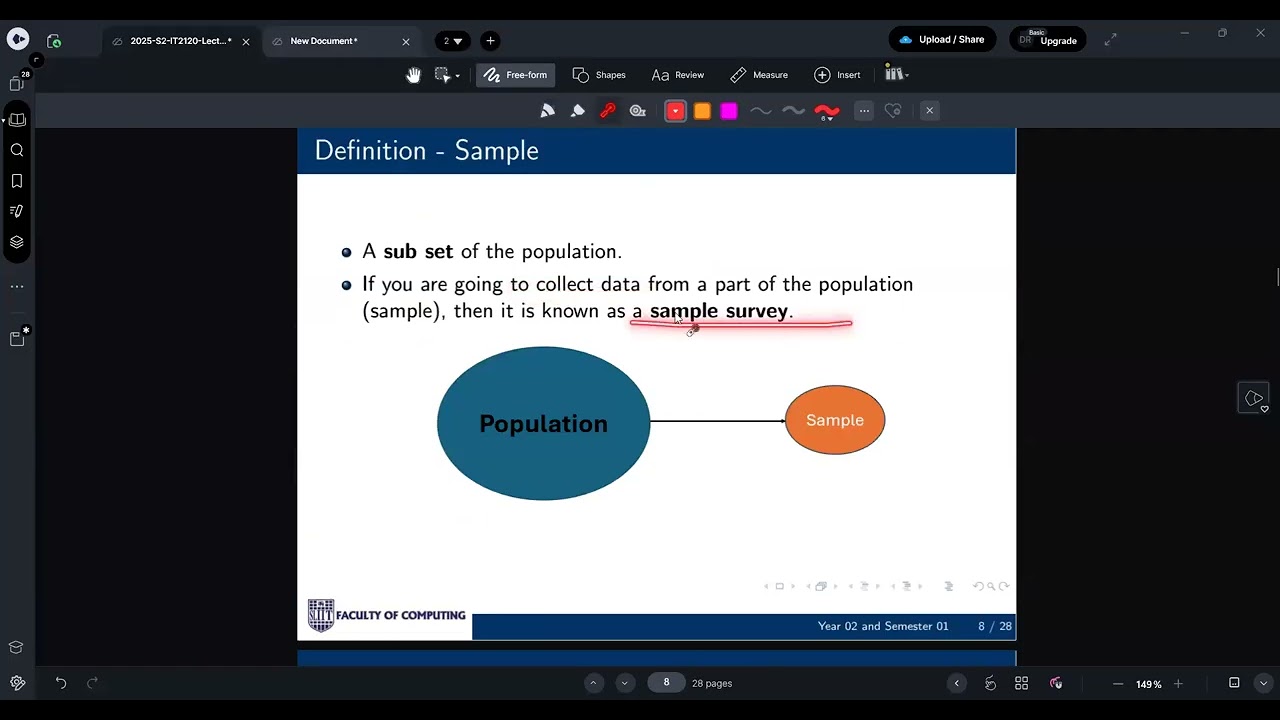
The concept of a dataset, including the fundamental difference between a population and a sample.
Understanding basic data types, specifically distinguishing between numerical (quantitative) and categorical (qualitative) variables.
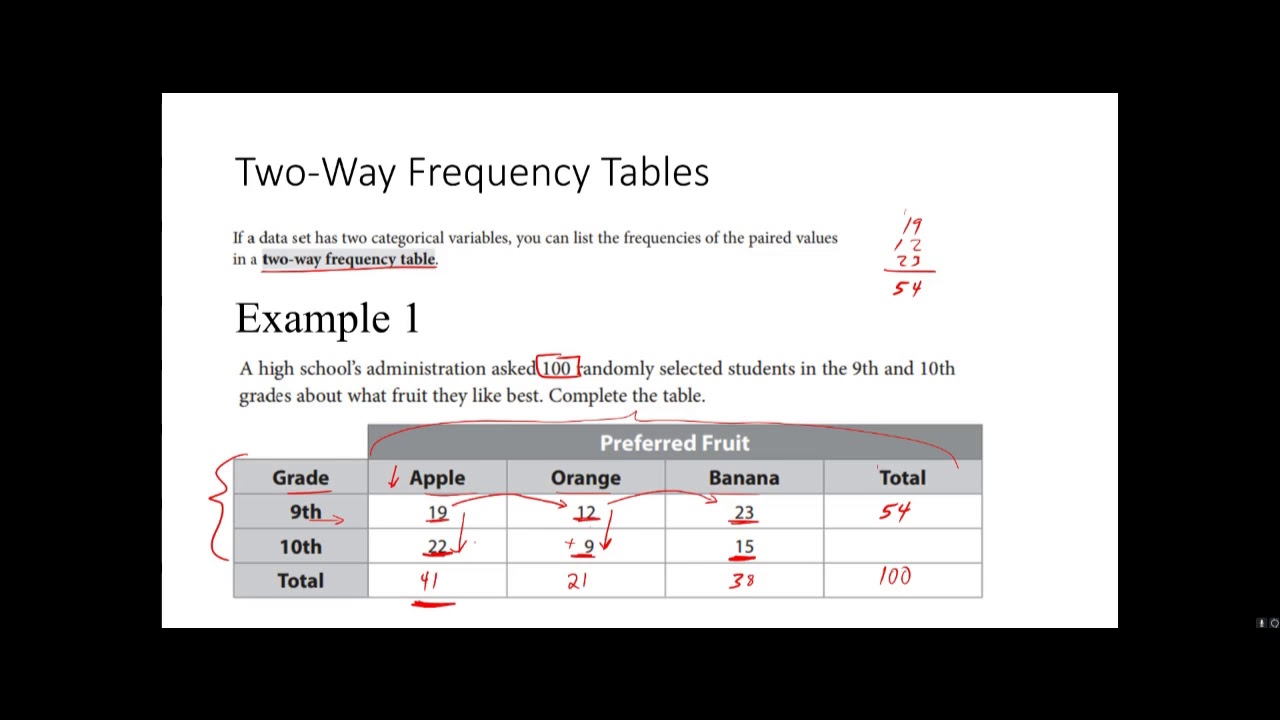
Familiarity with reading basic data visualizations, such as histograms and frequency tables.
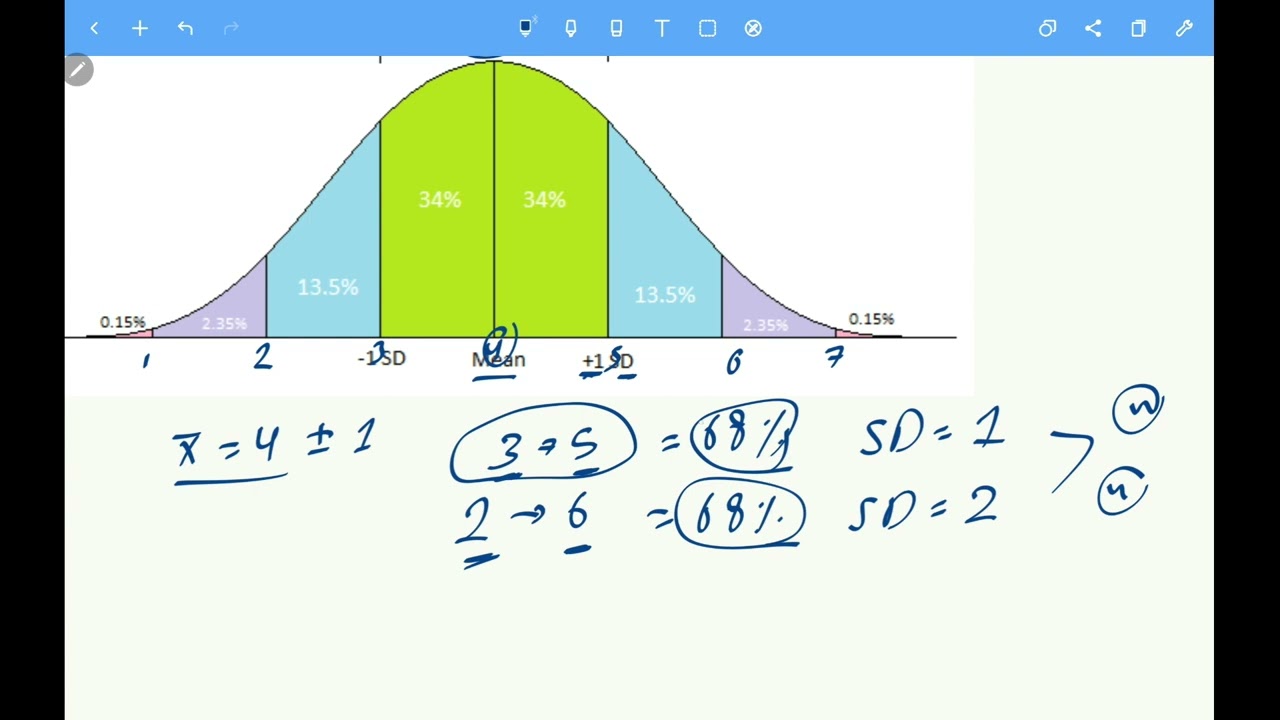
Understanding probability distributions, particularly the Normal (Gaussian) distribution and the empirical rule.
Using Z-scores and the Interquartile Range (IQR) for outlier detection and data cleaning.
Transitioning to inferential statistics, starting with the Central Limit Theorem and confidence intervals.
Exploring relationships between variables using covariance, correlation, and simple linear regression.
Applying these descriptive measures in exploratory data analysis (EDA) using programming tools like Python (Pandas/NumPy) or R.
34K views272likes58:23Original Release: 2017-11-06
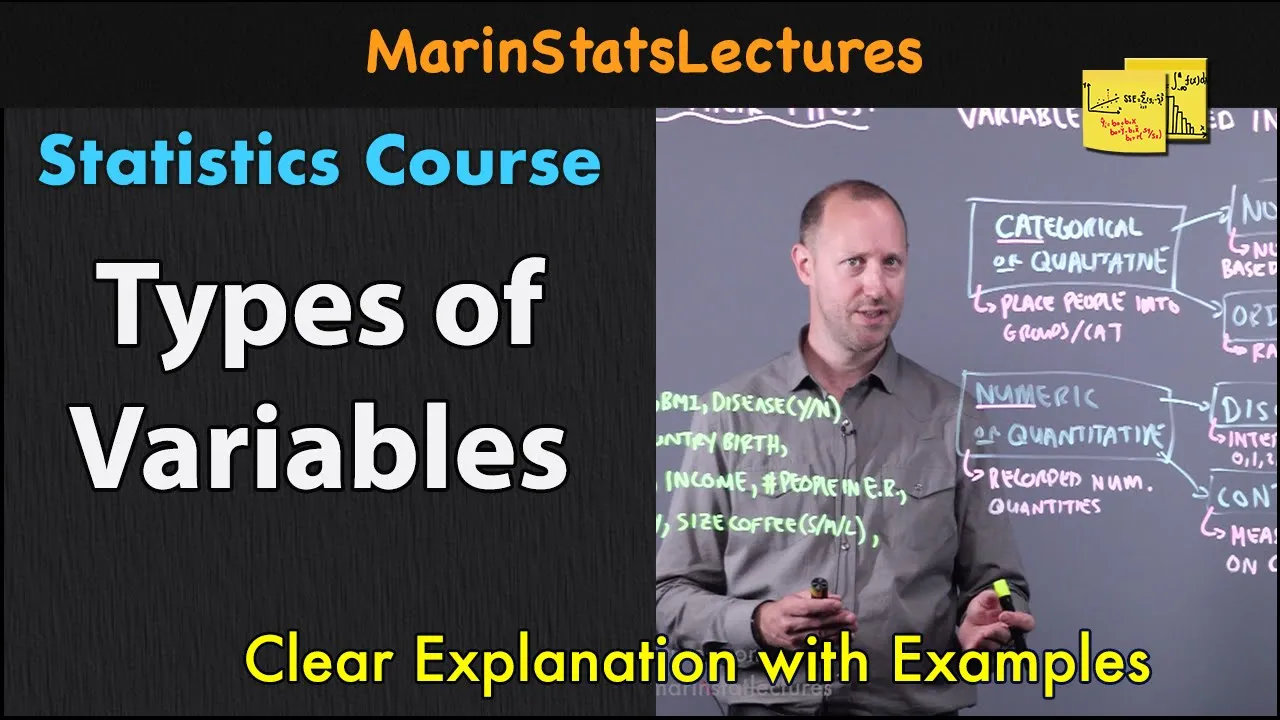
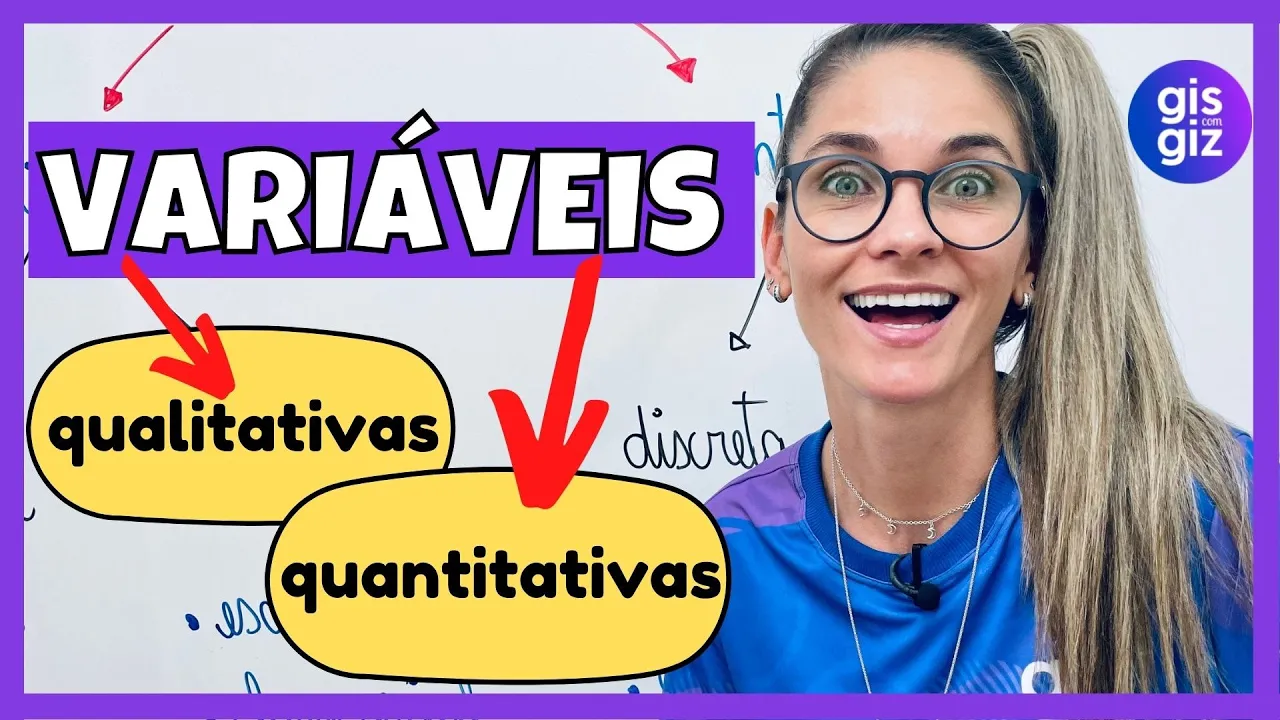
[Music] welcome everyone I'm Jane if I'm the status fix China okay so before we start let me introduce myself so I'm a senior data scientist who's having 10 plus years of experience in machine learning so I'm currently walking with the organization who is mostly concentrated on deep learning activities for example image technicians the natural language processing so that's my main duty ok so before we start the session we can talk about why statistics is important in terms of a mission learning okay so okay so but obviously pushing that why do we need basically so how would basically because that is very important okay so I can tell you statistics is the backbone of machine learning okay so every equation derived from statistics okay so so basically you know machine learning is full of mathematics right so every equations every steps derived from the mathematics so obviously normally statistics you know we should know about differential equations okay so we should know about little integration we should know about probability theory measure theory you know so why not so you know this is how it goes so we we should note we should know about each and everything okay so more than anything statistics is a blinder okay so I can tell you simple I start with simple example why statistics are primary then we go over a channel okay so you all heard about Bernoulli distribution right okay so so basically we will see better redistribution next week okay there is something called binomial distribution that basically came from Domino distribution so so so much in this session I'll just tell you like how statistics you know how we derive the machine learning equation from statistics okay so we have something called linear regression okay so anyway you know we'll talk about this in detail okay so the linear regression is basically is the very basic algorithm with in terms of machine on it so what linear regression will do the okay so for example I have input like this number of experienced just experienced okay this is one of the field and in age and then okay T and in skills okay so and so now this is my data okay so now I assume that you have a data like this okay so you have data called number of experience each skills in itself okay so now your job is to okay so now we talked about the linear regression right so even have number of X means eight skills and channel okay so this is the input field basically okay so we have we call that as a futures number of experience each skills and sanity okay so so the pointers okay so this is my training data so have to trim' this Yogi's and finally I have to predict the salary I have to produce the salary okay so based on these features you can assume that I got a training data okay this is my training data okay so assume I caught some thousand numbers of training training data basically consists of all this number of experience age skills and salary means people will say futures and targets okay so we call input as a future input variable okay so anything is fine but if you go to the research paper basically everyone talks about futures and stuff input variables okay so our features are number of experience age and skills in a target s so so now the point is I have climbing thousand training data okay which consists of number of experience age skills and salary okay so now I have to predict the salary based on the teachers okay so this is basically a linear regression problem because I can say this salary is a continuous variable means continuous will will anyway discuss about continuous and discrete variables okay is the continuous variables of the circulation problem I will apply linear regression okay so you know two futures and target I'll apply create a model okay after that what I will do I will deploy this model in cloud or wherever you okay but just for topic purpose okay so we can say that we you know we can deploy the model in the cloud okay and someone have all these features for example you know they go into the market they get a ratio okay so from the resume they expected all those informations number of experience age and skills and then they'll hit the model that is available in cloud to this beaches make a song so you know I I took some lesson from the ratio of a particular person I get number of experience age skills and then I will hit the model that is deployed in cloud okay and then I will get the target that is the output which is the salad okay so this is basically linear regression right so if I want to you know I have enough data available so I just want to predict the pattern and finally I just want to get the target based on the features okay so now let's go little technically okay so so basically linear regression walks work objective functions though so we call that objective function or cost function [Music] generally you know people use all these three terms okay so generally it is lost but you know sometimes you hurt sometimes you hurt objective you know it depends on the you know try not depends on the material okay so that check the function is basically you know X the input into log of this is basically Y so Y is their target so I can say target okay so let's not think about this formula okay let's not worry about how we derive this formula because anyway this thing okay so but right now we have to understand this form derived because another important no it's okay we know that the objective functions are cost function or loss function as this for linear regression and basically linear regression walks based on the subjective functions but where we derived this how we come to know that this this formula will walk well okay so that's where a question comes right so basically we have to go back to statistics look at when the status so this is basically derived from Bernoulli distribution okay so if you see a Bayesian learning okay Sophie if you see any algorithms like it starts with a linear regression logistic regression support vector machines or decision trees random for us okay they do have checked a function because everything walks with objective functions okay so we will find the error based on the objective functions and then we will tune the we will find you in such a way that we can reduce there okay so we have basically two process in machine learning algorithms will find they will have objective functions and then we'll have the five terminal comes so that that's that's basically every machine learning algorithms has asked okay so if you understand this concept okay so if I go to any machine learning algorithms or something comes new in the market okay that basically has to lean that because one is objective function another is the fine tuning power okay so in terms of linear regression the objective function is the Baptist came from the barbary distribution and then the fine-tuning function as the gradient descent examples so we can gradient descent there are multiple flavors anyway so so I can say that the backbone for this objective and fine-tuned algorithms are statistics so anything should come from standard stick so obviously if you are good in statistics obviously you know you can easily relate this okay so so so that's why you know we see statistics before we see data analytics as well as we should not so now let us go to the presentation okay so and obviously we know that studying statistics in this in school ecologist but now we'll comes to industry it is little different so we'll go with each and everything ok so how we can start with statistics so you say that I'm a fresher in case of statistics now I can start with okay so basically now when I see a particular variable okay so I assume that you know I get a variable called salary okay so how I can get the intuition from the variable salary okay so that's basic that's the basic question right okay so assume that you have some excel okay and you have something called salary so like that you know you have multiple feeds okay so now when you see the salary okay so how you can get the insights what kind of you can get insights using statistics so basically you know I can I can I can come up with three factor for me okay our median variance in standard okay so okay anybody knows that we do have mean variance and standard deviation but you know using that how I can get the data insects okay so how how this can help me to understand this data okay so first of all I need to understand okay there are two things in in terms of set so I have gather input like this look at the salary this 10,000 20,000 30,000 okay so how I can hit the insights okay based on this status step variables okay so we just mean variance and standard deviation okay so so basically you know you know one thing that if you just want to you know I understand the population obviously you know we cannot calculate each and every one of the population you know because that's that's basically a very hard concept so what we used to do we'll go to each and every each for example if you want to calculate the population in case of India okay so basically we cannot ask each and every people right so we will we'll take a sample so from Karnataka we'll take some sample from Himachal Pradesh we'll take some sample from Assam we'll take some sample and then finally we come up with some well gardens and then we call it the populations so obviously when it comes to statistics we do have two things one is population the population is okay the population is basically everything means for example I need to take some selfie okay so if I and I have to take survey from thousand people that's the total population okay so thousand people who is walking in some industry Yohe so in the whole world only thousand peoples are available okay so what I will do I'll go to each and every people and take the survey that has nothing but the population okay but instead I cannot reach the thousand people I don't have a resource like that because I can reach only 50 people okay but I will try to you know I'll try to find insights from the 50 people itself okay so that's my question so we call that as a sample okay so if I go to each and every people and get the input that is nothing but a population but you know obviously in the real world application obviously we cannot go to each and every people so so I'll try to minimize my requirements I will reach only 50 people I'll get the input from them and based on that I'll derive something that is equal to population so that is very close to population okay so obviously that's my import and intuition okay so we call that as a sample okay so this is very important so okay so in the later part we talk about population and sample a lot okay I guess your understand population and sample variable so population is nothing but a total input sample is from the population the K so from thousand we call only 50 people 750 people we call the include examples okay so now anyway we do have two input side so how I can understand the sample is from the population okay so for that the mean variance and standard deviation is healthy okay so for example I get the inputs from thousand people cooking and I calculate and standard deviation is 1 ok standard deviation is nothing but okay so I have thousand inputs from each and every input what is the deviation for example if you go to salary okay the first error is 10,000 second salary is from 2013 third cell is 30,000 then here the standard deviation is 10,000 because from the first input to the second input I have 10,000 difference and from the third to second input I have 10,000 different second so that's nothing but a standard deviation okay so like that okay so you collect the samples means I'm sorry you collect the inputs to population okay and you find that the population standard deviation is one and you collect the samples from the same population but you choose only 50 people okay this is when you calculate the standard deviation actually that that is sex okay now so we have to think of water okay so the standard deviation in case of sample is safe the standard deviation in case of population is 1 okay so you collect another sample from 60 people okay so assume that one guy collected samples from 50 another guy should be called all the others have to one okay another guy you know get the inputs from another 60 to give us a sample to so here when you find the standard deviation it is again whoa okay so now we can you know by by using standard deviation we can say that Santa - Scott rather the sample 1 because the sample standard sample 2 standard deviation is better than the sample 1 standard deviation as well as the main point is the samples two standard deviation is equal to the population standard deviation so obviously we can say that we can go ahead with the sample tool so like that you'll see me okay so whenever you get the input will forget the standard deviation mean and variance and we call it with the real-world example if it matches to the real world example then a sample is kind okay so by using standard deviation mean and variance we can call them this kind of things this is one example like that you know we have a lot of we can come up with lot of intuitions okay okay so now I've got a question that how you're assuming standard deviation in what basis okay so let us let us first call to the for let us first understand the formula of standard deviation mean and variance okay so then we can go ahead with all those questions I'm sorry like anyway I'll come back to this question later okay so first we will define mean variance and standard deviation then we can come back to this question so let us go to the PPD okay okay so the mean is basically you know this is the formula okay so as I said that we do have sample population mean and sample mean okay this is the sample mean so here you can say that sample and may take me so mathematically we denote as an exponent okay that's basically 1 by n Sigma I is equal to 1 to n XR 5 so I assume that this is X of Y okay this is X of Y so through X of 3 okay so here is equal to 3 because I have 3 inputs okay so then the meanest X 1 plus X 2 plus X 3 divided by 3 which is the total number of inputs so that is nothing but in me okay so when you calculate the mean here it basically you know thirty thousand two thousand six a thousand divided by three is equal to 20,000 so the mean salary is two thousand means you know most of the population from the sample can record sales of salad okay some people you know individually some people make will get a one lakh salary okay but this is again out player okay so the means is 20,000 so that's basically mean tennis okay so we do have mean but why we do have medium okay because mean and median will average basically okay so we do have me why we need medium okay so the me is not very sensitive to outliers for example you think if another person who is getting one close and or 10 lakh salary okay that is possible in the real world you know if he's a specialist in some field virtual reality some some you know some high still and you get 10 lakhs and so now if I include this guy in the formula I will get a high deviation isn't it so you know it may go eighty thousand or something like that but this is the main changes because of this guy okay but other people are really getting loose at it okay so when I include this guy into the mean this will obviously distract my entire calculation okay so we call this the outlays okay so when you have outliers in your input when you find out lies an input it is better to go with meeting so the medium formula is medium basically you know list everything in the order starts from 10,000 20,000 30,000 and till 10 lakhs okay for example here we have five inputs which is 10,000 20,000 30,000 one left and Tim lakh okay so what I will do basically I think the middle number here so 1 2 3 4 5 totally we have 5 inputs okay so I will select the middle one which is nothing but a MIDI okay so if I have the 6 incredible yeah so you said outline to the value the outliers yes out layer sorry out layers can also be referred to the low value suppose somebody is taking salary thousand rupees exactly yes we do have both extra you're correct yes okay so this is basically outlier so so means it is basically lying so that's why we call this outlet this is a very important term in machine learning guys so so the outlier is very you can so now when you have the six inputs okay so I basically you know take the third and fourth one I'll take the average from this twenty five thousand plus thirty thousand n by 2 is nothing but a meeting okay so so the difference between mean envy genius okay so basically mean and medium will do the same job it basically take the average from the input but when it when you have out life basically you can do it with medium rather than me okay then what is variance basically variances now this is input you can take the mean back okay so now you have to understand how am I each in every input will differ from the mean mean band okay for example my first input is 10,000 okay the back means subtracted by me Q's me 10,000 okay so then I can say that okay in the market okay people are getting twenty thousand salary when I find this kind of requirements since for example you know you're recruiting particular people okay for some jobs you know maybe some support shops okay and you're giving ten thousand salad okay but people in you know same to them in the market carrying Tony thousand calorie okay so basically that is the mean salary so if I call picked my salary with the mean salary then I will get the videos so variance basically tells me that okay where I how am I put us you know changing with me for example if I get 10 lakh salary you know think about the outline those getting 10 lakh salary then is the variance is totally okay so so from this I can say that if the variance is zero it's available because it was exactly matching with me lesser nature intention okay so my eyes are from think about the calculation mathematical population okay so the variance of nothing but the actual value actual input subtracted from the mean okay and the standard deviation is simple very simple it's basically the square root of variance okay the square root of variance is that standard agree but here we saw that right the standard deviation is okay so the first input and second input have the deviation of 10,000 second input and the third input have the deviation of 5,000 third input and forth and could have the deviation of 5,000 like that okay you can each and every thing and I'm going to take the average you'll get the standard deviation from the sample okay so from the standard deviation I can say that okay so you know that's what we have seen in the from the population I get a standard deviation of 1 from the sample would make it the standard deviation of steps then I can tell that you know my sample is not connected okay I took a sample whose basically they're having iceland's outliers estimate okay but my sample to have the standard deviation of 1 this is this equation okay so this is exactly matching with the population so this is this is what the basic concept so whenever you get a variable whenever you get an input either in terms of you know from my signal from my sneakers file system or from Excel okay you take the every inputs like salary okay you call the standard deviation mean variance median everything okay and then you can see that how my input us okay this is basically help us like how statistic induces correct not correct something like that okay so when you talk about variable there are two kinds of variables okay so the one is categorical variable another is continuous variable means variable numeric variables okay so so you understand that what numeric variable is so if something with numbers there's nothing but very variable so you know the salary is a numeric table because it's a number okay so instead of a number I have something like this low salary medium salary high standard you know it's tough numbers i categorized the characters this is nothing but a categorical variable okay so anything starts with number is nothing but a numerical variable anything starts with character that's a categorical variable okay so now tell me like if it is the number obviously we can call clip mean medium readings if it is the character obviously we cannot call it all this okay so so obviously categorical variable is a very different sense you know we will talk about categorical variables a lot but as of now you know we do have two variables one is numeric variables in there is categorically okay so within categorical variable we do have to kind of things okay the one is nominal variable another is or demons going on I believe okay so in the PPT you do have all those things okay nominal variable ordering will be label but right now will be practical okay so in the categorically you know if anything starts so anything as well characters then we call there is a categorical variable okay okay within categorical variable okay we have two kinds of categorical variable or dinner [Music] so from the word itself we can understand okay nominal doesn't have any meaning okay means male/female like that okay is it having any order basically mathematic mathematically it doesn't tell anything it's a normal variable it's a nominal variable well if I mentioned low medium high this basically have some order low means a very less medium means between low and high means very high so this has some mathematical notation right we call there is an ordinal variable okay so very simple be whenever the variable starts with character having character in it that's nothing but a categorical variable with an categorical we have inaudible okay so nominal means it doesn't have any mathematical meaning or even means it has meaning simple okay so like that we do have numerical variables or we can simply say numeric variables okay so numeric variables also have X okay so one is discrete continuous okay so discreet us for example let's talk about salary okay so salary is basically companies because when I click this okay can I get any group open flaky now because I cannot predict what value I can get next anything from ten thousand to ten laps or even one crow it basically you know I can get anyone some people will get ten thousand and fifty as a sanity kunos a modem okay so obviously I cannot predict that my salary is looking this limit okay so that's nothing but the continuously okay discrete is you know take a very simple example okay for example from which state is zero one is in California okay so you know that us basically yours has 50 states and every stage has the number okay this is a numerical number one two till 50 okay so now you can tell easily that verify if my variable is state and it is numeric obviously it should be between 1 to 50 okay so so obviously you cannot get any any value that is more than 50 or less than 1 okay you cannot get any floating point value like 1 point 5 to point by something like that okay so you'll get any value that is between 1 to run T that is nothing but discrete okay so that's basically in the Peabody we discussed about it you know so we do have variables qualitative and quantitative I call that as a numeric kind categorical button categorical we have nominal and Bethan numeric they have displayed and continues every discuss both mean median mode standard deviations everything okay now okay so now I give something I get some inputs okay basically this is number of experience I'm joining them then writing in paintsville okay yes this is number of experience in the x-axis and y-axis is salary okay so now I take assume that I get 50 samples okay so 50 sample having number of experience as well as salary okay so assume that the first data at having experience of one in getting 10,000 salad okay the first sample is having number of experience as well insanity okay like that I have 50 samples okay so now you take this first sample look at the number of experiences born here here the number of means the salad is 10,000 okay here the first point comes we call that is a first sample so like that when you pick up 50 samples and plot it in a scatter plot we get something like this okay when you plot it you basically get like this and you all see this this is nothing but a Belka or a normally distributed car okay so now I get another car now the bottoms it's something like this okay this is basically nonlinear car so recall this is ISIF now we know forgot normal distributions this further about the distributions okay so things whether it is linear nonlinear this is basically linear this is basically nonlinear okay so now in terms of machine learning machine learning algorithms handle linear input very well but not nonlinear it works that's why we go into deep learning they understand that so since machine learning is not very suitable for linear problems nonlinear problems we go into deeper so obviously the essences so here they're senses the important pointers okay so if I apply machine learning algorithms for him nonlinear input yes it smelling good but if I having nonlinear inputs means I don't have linear impulse within me I do have a nonlinear inputs but I have to apply the machine learning algorithms what I can do leave it in the sense so you can you can if you if you plot the x axis and y axis then cut a curve like this okay otherwise even if you put a formula like Y is equal to 2x plus more okay so basically if something behaves for example accessory to put so excess number of experience salary yes why okay so this is basically a formal a'right so so excess number of experience why is the sound okay so venue number of experience has born I'll just replace one here two into one is sick of the to two plus 10,000 10,000 so that's nothing but my sanity so so when something okay behaves that this you know behaves well with this formula you know I can I can basically derive a single formula okay so within that whenever you get give me the experience I come up with that salary you know if something well suited with this approach then we call there is a legal believers okay are a linear problem okay so but here can I come up with any function yes I can come up with a function but that is a very critical very critical okay that is nothing but a nonlinear okay so in terms of graphical content if anything normally distributed okay anything have something like this you know you can you can see that this is in a single-car you know it hasn't mean okay so it has a standard deviation everything okay so I can it basically between one standard deviation you know to another standard deviation how many values stacked together I can I can basically you know No so I think you have a prop you know you do have a problem to understand linear nonlinear but right now okay so don't think much about linear nonlinear okay if something a platter like this that is nothing but a linear okay have something plaited like those that will non linear okay so if there is a sample bar okay so I can basically you know derive this within a very simple function then that's basically no problem if I doesn't come up with something like this then there's basically only your problem okay don't confuse or not anyway because this is very early to talk about linear nonlinear but we'll come again hi so do you mean that you know the machine learning can be applicable only for linear examples or linear situations see we do have something called support vector machine that is well suitable for nonlinear problem but we do one simple setup which is we use kernels instead of futures so we collect the features and they convert everything into kernels and then we apply into the support vector B applies a Power Commission so what I mean to say if I have a nonlinear input okay if I want to apply the machine learning algorithms what I will do I'll convert with nonlinear in cook into linear input using some function you will have more samples I believe more samples so even though I get more samples you know some some you know if you think about the critical variable that is basically hit nonlinear right you know some if you go to the real time variable in the world obviously you know we may get linear as well as nonlinear we cannot predict basically yes okay so but you know why it should be linear nonlinear you know when we discuss about gradient as elder then obviously we'll discuss you know why we should consider only linear non leader okay because if we if it is linear we can mathematically it does it this mathematical high approachable if it is non in it is there a difficult correct okay so so so obviously something like you know driverless car in u.s. compared to travel or in India that that would be linear and nonlinear in India exactly that might be what one example as well yes in u.s. yes they do have certain rules we can call there is a linear problem but in India obviously we cannot consider there is a linear problem yes that's one example but as of now you know you know don't think that why you know it should only applicable to linear nonlinear because they because that's how the mathematics can basically you know we have a gradient descent algorithm that is well suitable for linear than the lawn Deepak okay we will discuss about that one by one why you know can we discuss about gradient descent will discuss about that okay but right now you know you know just trust me just believe on me okay so we do have you know the machine running part you can the missing learning is very suitable for linear then the nonlinear but if you have the caution okay I have a nonlinear problem but I want to apply machine learning algorithms then you have to convert all the nonlinear input into linear input and only you can apply the machine learning algorithm so the one example a support vector machine okay so obviously when we discuss about support vector machines we will discuss that one okay but this is this is too early to go into depth ok so right now we are counseling in statistics okay so but what I'm saying us you know so why I take this point basically ok the pointers okay so now I get the nonlinear input okay something like this okay now I have to apply machine learning algorithms so you know that to apply something into machine learning algorithms I have to convert my linear input okay so but I got it now nonlinear input now I have to convert nonlinear into linear how I can do this you can basically apply statistics okay so what you can do you can apply you can use some functions okay so for example you got a nominated you have to convert this into the input okay so you have X basically it is nonlinear but what you can do you can apply some functions so just this basically apply in a mirror okay so you'll have some input that is nonlinear okay then you convert that into log of X the way you plot this and this might be linear or you can do exponential of X so you know that the exponential function of Baroda function either have to be decreasing or increasing so you you apply this to a variable called X and then you just check whether it is linear or non-linear so we have to understand logarithmic function exponential function all those things okay so now you know this that that's why the statistics are very important okay so so you know we need think about the problem okay you come up with some assumptions so that function is simple okay so when it is a nonlinear problem then obviously that's well not that is not suitable Commission learning algorithms then we have to convert the nonlinear into a linear problem okay that's the first step for that we did Santa sex okay so we then be converted we've successfully converted a non linear linear input now we can go for the machine learning algorithms so when you create a pipeline practically no because I walked in one to do projects okay so because for the last ten years of walk the machine project so so you know from my experience I can say that okay so if I get 60 days for a project then I can build algorithms evaluation everything within one mix because because now you know we can use Chi to clone or we can use tensorflow you know then we can easily do this right very a programmer can do this basically okay so what is the major part the major part is to identify this kind of things so if we go to each and every we'll see how the standard deviation variance and mean do we need more sample or the sample given or enough okay so whether each and every variable are linear nonlinear okay and then so you know we have to drive all this that's very important okay okay so basically I can say the formula of mean median mode and standard deviation but farm loading welcome okay so that's why I tell some practical scenario okay so from the practical scenario at derive on this okay okay so now we discuss about another thing as well okay so okay so there's a concept called messes of this portion okay so you can even understand now so what it tells how to spread out the distribution that is how the how variable the data are okay so basically whatever they're trying to say okay take this example how this is distributed okay so that's basically the mr. of dispersants okay what is the standard deviation okay what is the lowest value and what is the highest value okay so when you find the difference between the lowest value and highest value that this particular page okay so you can basically measure the dispersion right so you can you can Messer have this distribution okay so to measure this distribution basically you need the high value low value standard deviations variance and embed the paper that's basically the measures of dispersion so so I mean to say like you do have a lot of examples so if you call it range variance standard deviation mean mode then obviously you can understand this kind of theories so range you know that when you have the high value or minimum value and the maximum value the difference between the minimum and the maximum values range okay so in one example we talked about salary right so we caught the minimum salary is ten thousand maximum solid is ten lakh the difference between ten lakhs and ten thousand is basically huge so obviously you know it is not a good sample so from the range you can understand that what the sample is cool enough okay so that's basically the inch tell us okay and then you guys know what is the formula for variance and standard deviation okay the variance is nothing but each and every value of a put variable so this I do not want to n okay the x1 x2 something like that - this is me okay divided by n minus one so here the point is why we divide from n minus 1 and not divided I said because we don't have two variants one is population variance another sample B things okay the population variances we'll hide this minus one you know we won't divide by n minus 1 instead with divide but again okay but to penalize okay XF now right now I'm not explaining this I will give you as a homework okay just see why sample variance R divided by n minus 1 rather than you okay we'll discuss both next week okay so why does the see okay so so just go through this just go through Wikipedia just go through Khan Academy because why it is divided by n minus 1 why sample variance R divided by n minus 1 rather than you okay so just tell me the difference will violence buy more in detail next week okay so standard deviation you know that the square root of variance is nothing but standard deviation so when it comes to sample standard deviation the sample standard deviation is that were the square root of sample beading's okay so we discussed about population and sample okay so so population and sample mean median and standard deviation formula are almost same rather than this one difference if it is a population variance we divided by n which is the number of sample but for sample variance P divided by n minus 1 which is again the number of samples okay so you have to understand why we have to minus 1 in the denominator okay so you just find that answer this very simple fill explained next because one hidden concept you know there in this okay and we do have the last topic which is we have chebyshev's theorem okay so what should be chef theorem okay this again you know it will come up with another thing for example you could take this example okay okay so here the mean is fine assume that the mean is fine okay so so I should that we have a salary okay not 550 thousand because the salaries so the average salary in a particular sample is 4 mm and a standard deviation is 10,000 okay so we call this a one standard deviation two standard deviation okay so every standard distribution deviation okay deviate it with the value of 10,000 suffer so this is minus 1 this is minus minus 2 standard vision this is plus one standard Asian and test 2 standard deviation okay so like that will have multiple standard deviations in the positive as well as negative range okay so now we know this so you you know what is what standard deviation is what meanest okay so now someone asked the question okay so you have thousand samples okay so out of thousand samples how many samples are lying between two standard deviations [Music] so if anyone asked a question okay so I have thousand samples out of thousand temples how many samples are lying between the two standard deviation which is minus 2 n plus 2 between minus 2 standard aggression has to stand division how we can call business okay so to call babe you can basically follow chubby chebyshev's theorem okay so this K is nothing but that standard deviation it should be greater than 1 okay so now the question is what how many samples are lying pressing to standardization so you can apply this formula 1 minus 1 by 2 pi which is 1 by 4 so which is basically 3 by 2 so 3 by 4 samples are lying between two standard deviation so almost 95% of the samples I'm sorry 70% of the samples okay that's nothing but chebyshev's theorem okay so we discussed about all this okay what is comfortable number what is not comfortable numbers okay so when it is continuous basically we cannot count about this it could be anything okay when it is discrete basically we can count this okay so okay and then we have lots of expected value laws and theories discuss both okay okay so what is expected value now okay the expected value is nothing but the average value for the mean man okay for example doesn't form well you just think about the formula okay so I have a constant value which is 10,000 the expected value of constant test work that's the question so you apply the same thing formula okay so I have a constant called 5,000 okay if it is a constant they cannot say this is which variable this is this is not a variable so I cannot say this is salary business you know this simply a constant so obviously the mean is nothing with a constant okay that's the father I see when you want when you really want to call it the expected value of your constant that's nothing the constant again okay so now you have scenario like this okay a variable plus constant expected value of variable X as a variable and see is that constant okay so I assume that C is 5,000 and XS 7,000 okay and it has multiple values so now basically you can locate the mean for this okay because this is a variable okay so basically you can call it a meal but for Karsten there's nothing so you can rewritten the formula like this the expected value of x plus constant okay so now you have something like this the constant come with this into so now what would be the expected value so that's basically C into GFX okay because when you call get the mean it will take this is a 20,000 this is what it doesn't deserve 60,000 for that will call to me so obviously the C comes into picture okay so when it comes to variance you apply the same formula okay what the variances okay now variances the difference between the actual value with from the mean value okay so now take the same example we have 5,000 okay we have five over there's a constant so what you do basically you divide 5,000 in some fun you will subtract the real value with a mean man so here the mean value is also 5,000 okay so Python that chill value which is constant 5,000 subtracted from the mean value Phi does is zero you cycle so that's why this one might say okay so if it has an X plus C basically when you - okay X plus C minus X minus C basically this X will drop out so you'll get only B of X okay so basically when it has come with an X basically this will be square okay some example if you just try to play the variance formula this is the variance found write X minus mu whole square okay so when you just replace the value CX into the facts you'll get this okay see you okay the laws of expected value one nothing but in be okay so you know what mean firmness so the means formulas for example this is the variable x1 x2 it's the mean values x1 plus x2 plus 3/3 okay so now we have their constant okay so constant is basically single value okay so what could be the mean then okay so single value divided by 1 is nothing but C okay so that is what here okay so if we want to conquer the mean for a single value constant okay so what I will get basically same thing C divided by 1 is C okay so now instead of C we'll have X plus C so what will be basically first your calc at the mean for eggs okay so mean of X's expected value of x plus this cuts so that is what the extra so the expected value of x plus constant okay so now when it is CX okay this is basically C into D of X okay so when you apply the same concepts to love variants okay so you have seen okay what is the variance formula is this okay so the actual value the real input minus me whole square is basically the variance formula okay so the x value is C naught what is the mean value okay so when you the mean value is also C for me constant so C minus C is basically zero so that's what this the variance of constant is equal to zero okay so now the variance of X plus C okay let's do this what is the variance of X plus C again okay the X plus minus X plus C whole square minus X plus C whole square okay this is basically X plus C whole square the real value minus a of X plus C whole square okay so when you come up with a value that's nothing but I D F X okay you can basically remove the constant okay so one will cube plus C 1 will Q minus C both will cancel down okay so that's why we get PR X so when you substitute C constant into X we get C square into the effects okay I'll try it out so that's what we can so that's what they say plaza feedings okay so I think it will clear down okay so now the last function is probability distribution and probability mass function okay so now I'll simply explain this then we'll post the session we'll go with some questions okay so when you're all fine then we can close the nation now is in now you know we have two variables discrete and continuous variables okay so discrete variables are nothing but I can knock in action the variable are between this value to this value for example between one I repeat okay that those are nothing but discrete variables okay so if continuous variables means I cannot see this could be the value it could be anything 0 to infinite or I can say minus infinity to plus infinity okay so now you know we took this linear problem and come up with this formula right okay y is equal to 2x plus 10,000 in one example okay so now you know this is basically a function okay so I get so many samples okay then I'll plot electors I'll come up with a function basically you know in the x-axis I have number of experience in the y-axis AB salary basically this will follow some logic so if I make this plot as a function I will get one function okay for both continuous as well as discrete variables okay so if I come up with function for continuous variable that is nothing but a probability density function okay for discrete variable there is nothing but a prob will be mass function okay simple okay so I get some sample and I just want to make this is a function okay so you know I basically get two kinds of variable one is the continuous and errors it is great for a continuous variable if I get if I derive some function that is nothing but a probability density function for a discrete variable if I tell have any function that is nothing the property mask okay so anyway we will discuss about the cell I will discuss about probability and solution to poverty amongst mass functions in the coming sections okay so the next section okay will starts with every dissipation we will take the samples will come up with the distributions and then we will see what is the probability density function and probably the mass function for those distribution okay will derive mathematically and then we will see how it could be useful but let us summarize okay so which starts with a problem okay so I should you know that's how we started we got we take one variable cost salary we call paid mean median mode standard deviation variance okay and then you know we try to understand how I can you know how this can help me so you know we put some examples okay but did I reach and everything you know like how the continuous variables they will behave the discrete variables will behave you know you know those kind of things right so so anyway in the photo section will describe more and more okay so till then you
Up Next

191:13
Advanced Time Series Forecasting with Prophet and ARIMA Models
@360DigiTMG
1.3K views•2022-09-24

4:43
Elliptic Curve Cryptography Explained: ECC, ECDSA, ECDH
@PracticalNetworking
28.5K views•2024-10-21

10:44
Fourier Series Introduction: The Big Idea Explained
@DrTrefor
387K views•2021-05-03

6:00
The Mathematical Impossibility of Accurate World Maps
@Vox
23.3M views•2016-12-02
Related Study Plans & Knowledge Roadmaps
Structured learning paths in Mathematics
mathematics
Tensor Calculus: Vectors to Riemann Curvature
01Mathematical Foundations: Linear Algebra & Calculus
02Covectors, Dual Spaces, and Tensor Basics
03The Metric Tensor and Index Gymnastics
+ 2 more learning modules
40h5 modules
Explore Roadmap
mathematics
Gödel's Incompleteness: Logic, Proofs & Limits
01Introduction to Formal Systems & Hilbert's Dream
02Set Theory, Cardinality, and Cantor's Diagonal Argument
03Arithmetization and Gödel Numbering
+ 2 more learning modules
14h5 modules
Explore Roadmap
mathematics
Galois Theory: Fields, Groups & Solvability
01Foundations of Abstract Algebra: Groups & Fields
02Polynomials & Field Extensions
03Splitting Fields & Symmetries
+ 2 more learning modules
24h5 modules
Explore Roadmap
mathematics
Non-Euclidean Geometry: Models & Geodesics
01Euclid's Fifth Postulate and the Birth of New Geometries
02Hyperbolic Space and the Poincaré Disk Model
03Geodesics: Defining Straight Lines in Curved Spaces
+ 2 more learning modules
15h5 modules
Explore Roadmap