




















A low-pass filter preserves low-frequency signals while attenuating high-frequency noise; to implement it on an Arduino, convert the continuous transfer function H(s) = ω₀/(s+ω₀) to a discrete difference equation using the bilinear transform, then implement the recursive formula y[n] = a₁*y[n-1] + b₀*x[n] + b₁*x[n-1], where coefficients depend on the cutoff frequency and sampling rate, with higher-order Butterworth filters providing steeper roll-offs but introducing more phase delay.
Design Digital Low-Pass Filters on Arduino
Added:Basic C/C++ programming for Arduino, including handling analog inputs and precise timing loops.
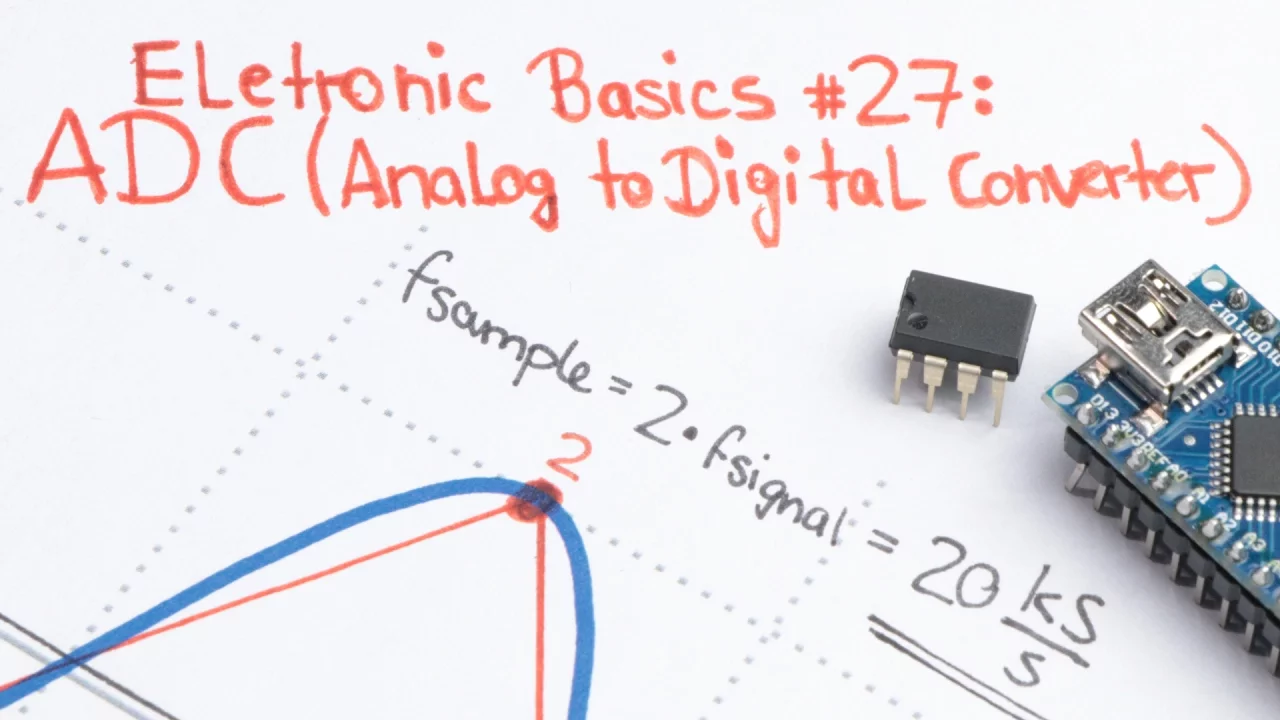
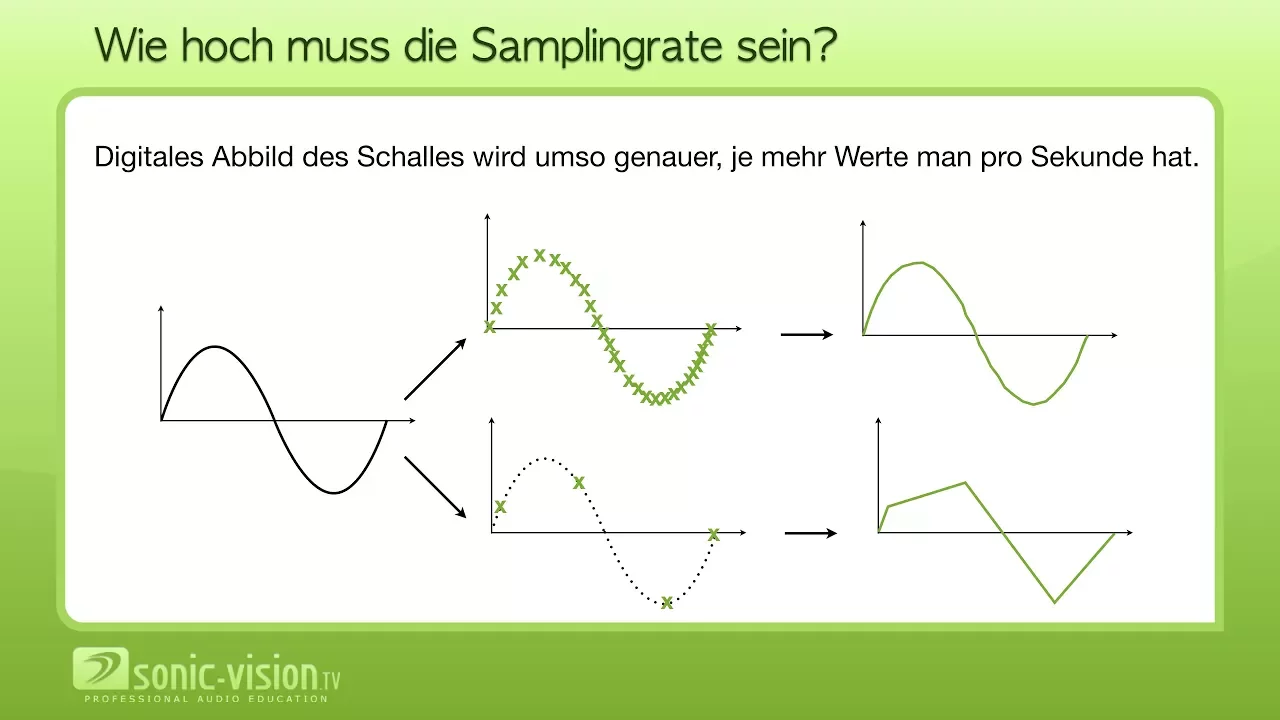
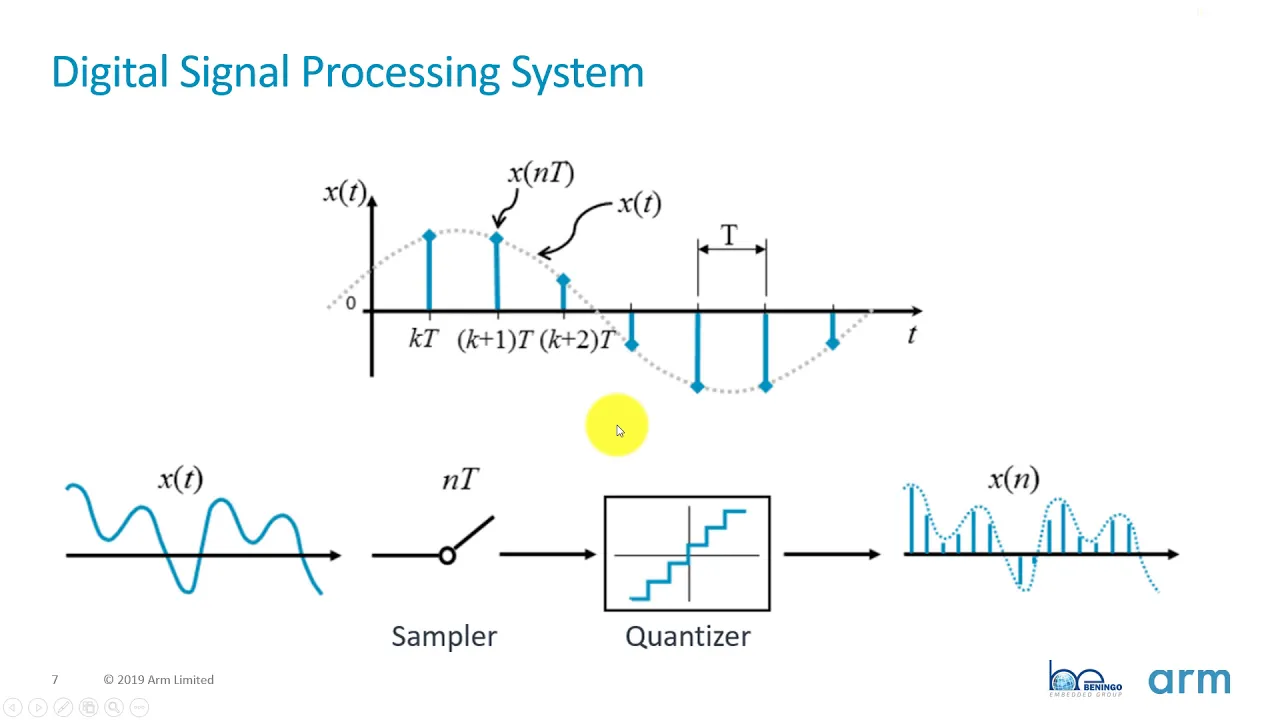
Fundamental concepts of analog-to-digital conversion, including sampling rate and the Nyquist-Shannon sampling theorem.
The theoretical purpose of filtering in signal processing, specifically how low-pass filters attenuate high-frequency noise.
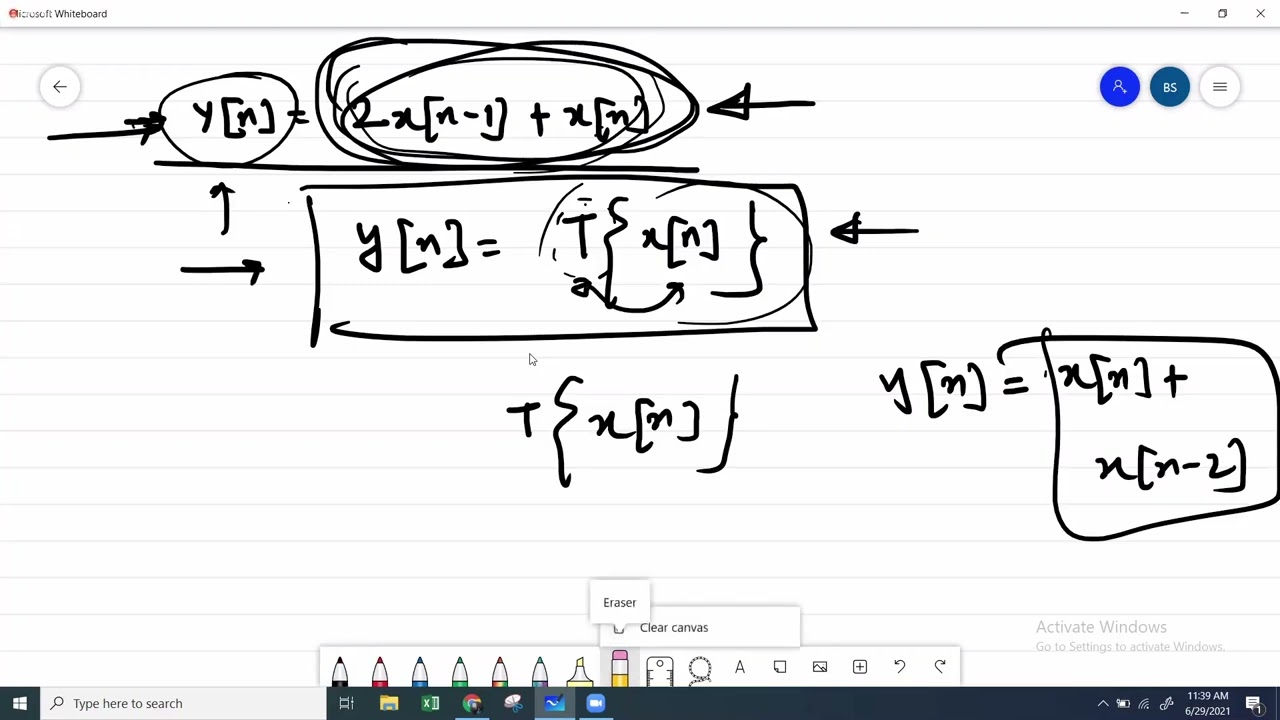
Basic understanding of discrete-time systems and how difference equations represent digital filters.
Design and implementation of other filter topologies, such as high-pass, band-pass, and notch (band-stop) filters.
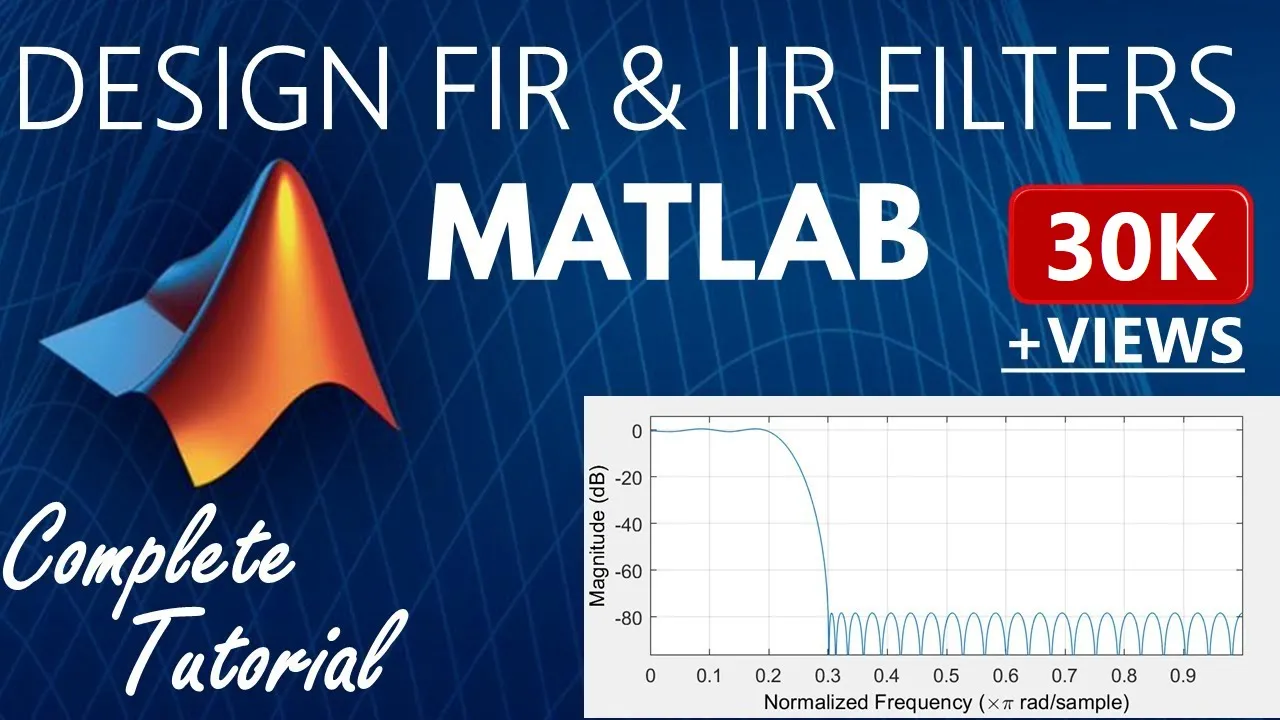
A comparative study of Infinite Impulse Response (IIR) versus Finite Impulse Response (FIR) filters regarding stability and phase response.
Using mathematical computing environments (like MATLAB or Python/SciPy) to calculate precise filter coefficients for custom specifications.
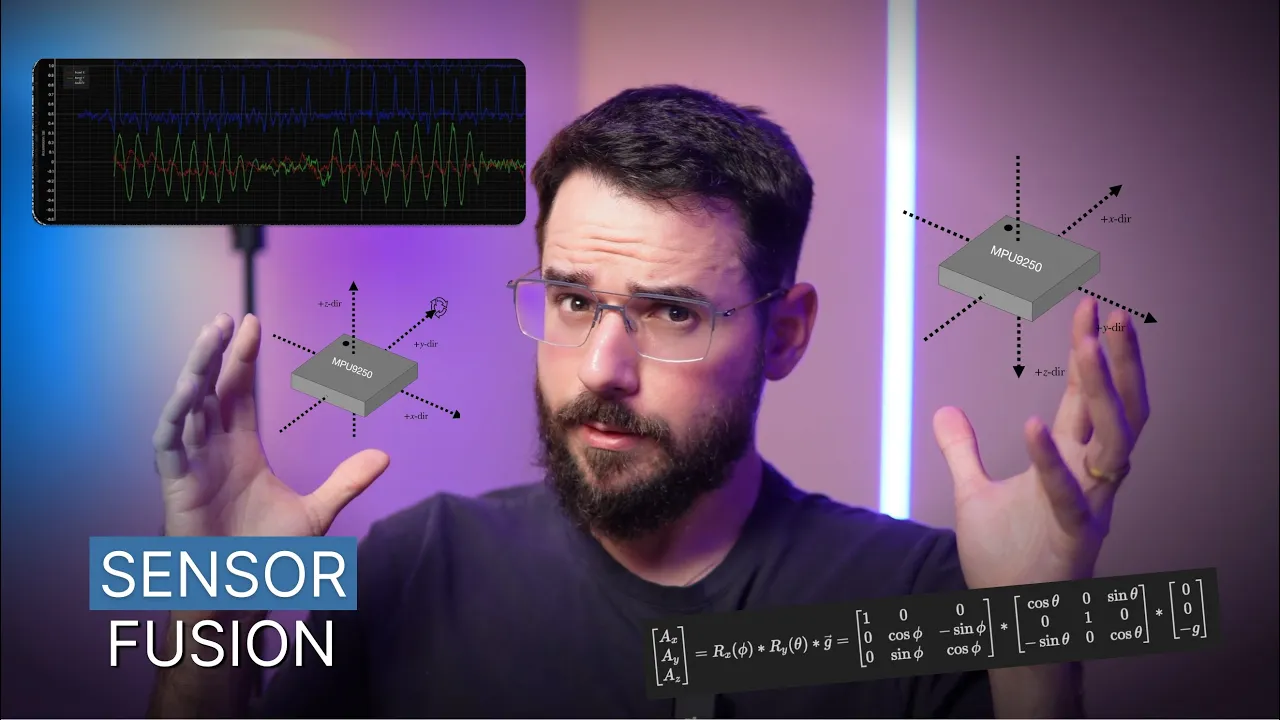
Implementing sensor fusion algorithms (such as Complementary or Kalman filters) for noisy accelerometer and gyroscope data.
Microcontroller optimization techniques, including the use of fixed-point arithmetic to accelerate real-time filter execution.
188.2K views5.7Klikes12:52Original Release: 2021-06-20
in your arduino project you'll be using sensors and those sensor measurements probably have noise in this video i'll show you how to design and implement a low-pass filter that's just right for your project it's easier to use an artificial signal to test the filter so we'll start by creating one i'll represent the fundamental component of the signal with a 2 hertz sine wave to represent the unwanted noise i'll add a 50 hertz sine wave the discrete fourier transform or dft offers another way to look at the signal each sine curve shows up as a peak in the fourier domain here i've isolated the 2 hertz signal and here's the 50 hertz signal the peaks are mirrored at negative frequencies because i'm using the two-sided discrete fourier transform now we'll create a low-pass filter that preserves the two hertz component and eliminates a 50 hertz noise a first order low-pass filter is typically represented by the transfer function omega 0 divided by s plus omega 0.
if you're not very familiar with transfer functions don't worry later in this video i'll show you how to convert the transfer function into update equations you'll be able to use those equations to implement the low pass filter on an arduino the transfer function has one parameter the cutoff frequency omega 0.
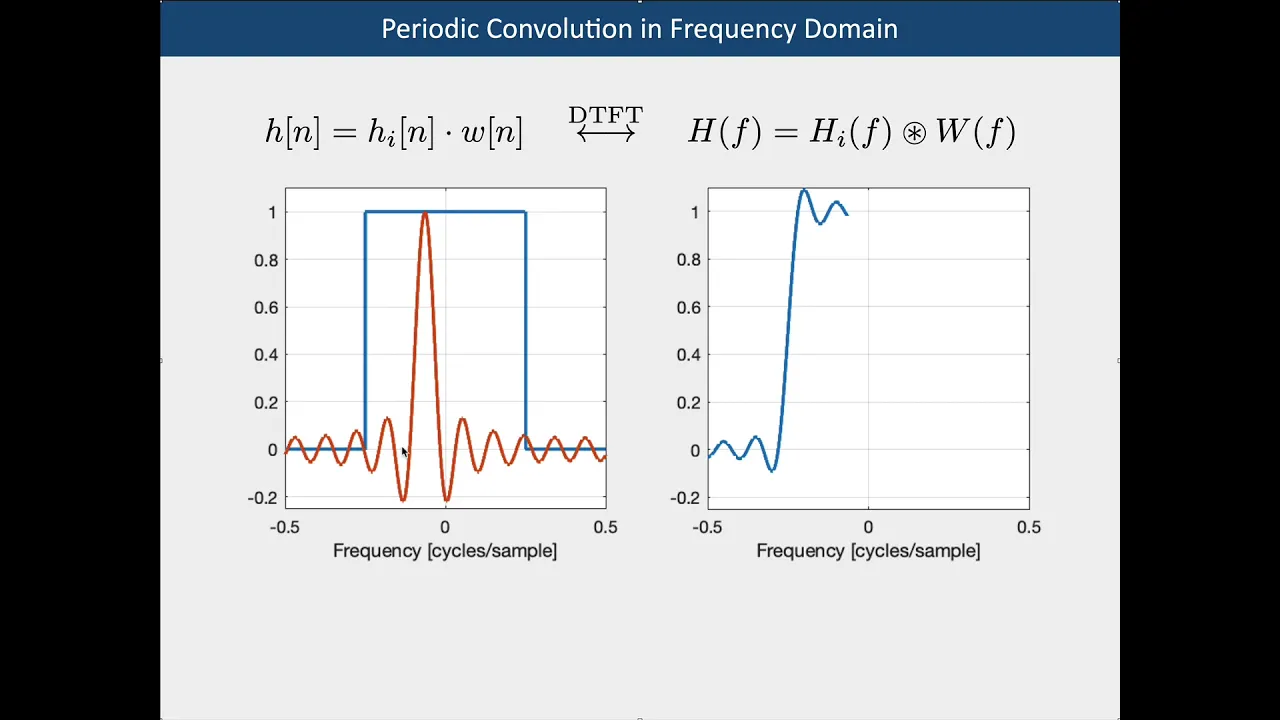
i'll set the cutoff frequency to 2 pi times 5 radians per second this produces a cutoff frequency of 5 hertz which should preserve the 2 hertz signal and attenuate the 50 hertz signal let's see if it works when i pass a 2 hertz signal through the filter it is largely unaffected however when the 50 hertz signal is filtered its magnitude is substantially reduced you can understand how the filter affects other frequencies by looking at the bode plot the first graph in the bode plot shows the magnitude of signals that have passed through the filter as a function of their frequency in radians per second at an input frequency of one hertz the signal is largely unaffected by the filter at the filter's cutoff frequency of 5 hertz the bode plot shows 5 decibels in this case the signal is attenuated to 50 of its original magnitude at 50 hertz only 10 of the signal remains at 500 hertz the body plot magnitude is minus 40 decibels so only one percent of the signal remains the second half of the bode plot shows the phase as a function of the filter frequency this part of the bode plot is useful for demonstrating how much delay is caused by the filter at one hertz there's very little delay in the signal at five hertz the phase of the filter's signal is minus 45 degrees implying that the output will be delayed by one-eighth of 0.2 seconds or about 25 milliseconds at higher frequencies the phase delay increases up to about 90 degrees listen i know what you're thinking get to the arduino implementation already unfortunately the transfer function form of the filter is not suitable for real-time signal processing on the arduino to get a usable form of the filter we're going to have to do some ugly math but don't worry i've already coded all of the math for you in a python script so even if you don't understand it perfectly you can still use it to create your filter up to this point we've represented the filter as a continuous transfer function digital implementations of filters run in discrete time so first we'll solve for the discrete form of the transfer function real-time filtering happens in the time domain so we'll also solve for the constant coefficient difference equation in the python code i've started by loading the required libraries and defining the continuous transfer function with a cutoff frequency of 5 hertz the discrete form of the transfer function depends on the sample frequency of the signal you want to filter the arduino clock frequency is several megahertz but the actual loop frequency depends on how much code is running to simplify things i'll throttle the arduino loop so that the test signal is sampled at a frequency of one kilohertz to obtain the discrete transfer function at the sampling frequency you can use the bilinear transform to do so substitute the transform into the continuous transfer function alternatively you can use software like the python code shown here to do the work for you the last thing we need to do is construct the difference equation it turns out that the coefficients of the difference equation are almost exactly the coefficients of the discrete transfer function you just need to include a negative sign for the denominator's coefficients the difference equation depends on the filtered signal y and the raw signal x to test the filter on the arduino we'll start by coding the test signal we defined at the beginning of this video next we'll implement the difference equation for the filter the new value of the filtered signal yn is equal to a weighted sum of the previous value of the filtered signal yn1 and the current and previous values of the raw signal xn and xn1 to complete the code store the values of the raw and filtered signals so that they can be used in the next iteration of the loop function there's also a one millisecond delay so that the loop function updates at a frequency of one kilohertz here's the result the filter has largely removed the high frequency component from the test signal however the magnitude is slightly attenuated and there's a short delay let's look at the result in the frequency domain you can see that the 2 hertz signal is preserved while the 50 hertz signal is almost entirely removed here's a question will this filter work to allow frequencies from 0 to 20 hertz while removing higher frequencies to answer this question i'm adjusting the main frequency of the test signal as we increase the frequency beyond the cutoff of 5 hertz the main component becomes attenuated so if you need to preserve higher frequencies this filter simply won't work for you so what can you do to make a filter that will work the answer is to make a new filter with a higher cutoff frequency i've created a python script that incorporates all of the elements used in this video to design and test a low-pass filter it's linked in the description below i'll change the cutoff frequency in the script to 30 hertz so that signals from 0 to 20 hertz will be preserved next i'll adjust the main component of my test signal to 20 hertz running the script will create the filter transfer function and perform the necessary computations for generating the difference equation in the first part of the script you can see the test signal in his power spectrum the next part generates the continuous transfer function of the filter and shows his body diagram at the bottom of the script you can find the filter coefficients the script did generate a filter with a cutoff frequency of 30 hertz but as you can see it really didn't work that's because the low pass filter has a broad transition band meaning that there is a band of frequencies near the cutoff where signals are neither kept nor stopped but are just kind of attenuated we can understand this issue better by looking at the bode plot for the first order low-pass filter the pass band is a set of frequencies where the filter preserves the signal for the filter with a cutoff frequency of 5 hertz shown here that's between about 0 and 2 hertz the stop band is the set of frequencies where most of the content is removed for this filter that's from about 30 hertz on between 2 and 30 hertz the filter doesn't do very well it will attenuate signals but it won't actually remove them this is the transition band in a perfect world we'd want a low-pass filter to perfectly pass all signals below the cutoff frequency and eliminate any signals with frequencies above 5 hertz no transition band of course we live in the real world but we can create a filter with a smaller transition band there are many different types of higher order filters here i'll show you the butterworth low pass filter a second order butterworth low-pass filter has a similar response to the first order low-pass filter but offers greater attenuation the result is a smaller transition band increase to a fourth order butterworth filter and the transition band shrinks further jack up the order to 50 and the magnitude response of the filter is very close to the perfect low-pass filter seeing this graph you might think why don't we always use a thousandth order butterworth and then we'll get a perfect cutoff of course there's no free lunch in life or signal processing but we'll get to that in a minute first let's see how to implement the butterworth filter on the arduino the butterworth filter has a similar transfer function to the first order low-pass filter the difference is that the denominator is a polynomial of order n you don't have to derive the butterworth filter to use it you can use the formula that has been around since 1930 when stephen butterworth came up with it the coefficients of the butterworth polynomial are given by the recursion formula shown here the first coefficient a0 is set to 1. it's easy to write code to compute the transfer function of a butterworth filter of any order here i compute the coefficients a in python using a for loop then i adjust the coefficients based on the cutoff frequency and use the scipy library to define the continuous transfer function once you have the continuous transfer function you can use the same code we used for the first order lowpass filter to compute the discrete transfer function using your sampling frequency then you can extract the coefficients of the difference equation so that you can implement the filter on the arduino the resulting difference equation depends on more historical values in the first order filter this second order butterworth filter depends on the two previous values higher order filters will have even more terms before implementing the butter with filter let's review the output of the first order low-pass filter here i'm adjusting the test signal to have two hertz and 25 hertz components after filtering the two hertz component is retained but some of the 25 hertz component also remains now let's compare that to the second order butterworth filter i've updated the code to use the difference equation we just derived the second order butterworth filter shows better filtering more attenuation of the high frequency component and better preservation of the low frequency component this comes at a cost there's more delay in the filtered signal earlier when we looked at the bode plot for the butterworth filters we only looked at the magnitude plot that's only half the story the other half of the story is told in the phase plot for the first order low-pass filter there's relatively little delay even at high frequencies for a second order butterworth filter there's more delay but in the pass band it's fairly similar to the first order filter a fourth order filter has a larger delay as much as 45 degrees inside the pass band that means your filtered signal will lag by about an eighth of the period in the pass band increase to a 50th order filter and there's a massive increase in the delay the signal can be delayed by a whole period or more inside the pass band so when you design your low-pass filter you need to balance two things the attenuation characteristics shown in the first graph of the body plot and the delay caused by the filter illustrated in the second graph of the bode plot butterworth filters aren't the only option for a high order filter so if the characteristics of these filters aren't suitable for your project try looking into some of the other standard filters here's a comparison of the first and second order low-pass filters applied to filter raw accelerometer readings from an mpu6050 both filters work to remove the high frequency components of the signal there's delay in each but it's more pronounced in the second order filter however the second order filter result is smoother which filter would you use in your application let me know in the comments below
Up Next

19:38
The Dangers of Aging Dams: Infrastructure Risk Explained
@Wendoverproductions
1.8M views•2023-09-19
30:32
Ultrasonic Transducers: Resonant Frequency Measurement and Horn Design
@imajeenyus42
229.9K views•2017-02-22
54:16
Polymer Environmental Degradation: Mechanisms & Stabilization
@iit
1.8K views•2012-07-10
33:39
How a Student's Question Saved a NYC Skyscraper from Collapse
@veritasium
22.8M views•2025-04-26
Related Study Plans & Knowledge Roadmaps
Structured learning paths in Engineering
engineering
Building Acoustic Levitators: Physics & Arduino
01The Physics of Sound and Standing Waves
02Piezoelectric Transducers and H-Bridge Drivers
03Arduino Programming: Generating 40 kHz Signals
+ 2 more learning modules
14h5 modules
Explore Roadmap
engineering
Building Peltier Cloud Chambers: Particle Tracks
01Cosmic Rays & Cloud Chamber Physics
02Thermoelectric Cooling (TEC) Fundamentals
03Custom Liquid-Cooling Loop Design
+ 2 more learning modules
18h5 modules
Explore Roadmap
engineering
Yagi-Uda Antennas: Modeling, Build & VNA Test
01Introduction to RF and Antenna Fundamentals
02Yagi-Uda Antenna Design Principles
03Antenna Modeling and Simulation in 4NEC2
+ 2 more learning modules
18h5 modules
Explore Roadmap
engineering
ECG Monitor Design: Op-Amps, Filters & Noise
01Electronics & Breadboard Basics
02Op-Amps and Instrumentation Amplifiers
03Bioelectricity and ECG Fundamentals
+ 2 more learning modules
18h5 modules
Explore Roadmap