





















Electrochemical Impedance Spectroscopy (EIS) is an AC-based technique that applies small sinusoidal voltage signals at varying frequencies to probe electrochemical systems, enabling the separation and characterization of different processes (such as charge transfer, diffusion, and mass transport) by analyzing the frequency-dependent impedance response, which combines resistance, capacitance, and inductance characteristics into a single measurement framework.
Electrochemical Impedance Spectroscopy (EIS) Theory Explained
Added:Basic Electrochemistry: Understanding redox reactions, electrode-electrolyte interfaces, and Faraday's laws of electrolysis.
AC Circuit Theory: Familiarity with alternating current (AC), Ohm's law in AC circuits, phase angles, and the behavior of basic components like resistors and capacitors.
Complex Mathematics: Mastery of complex numbers, Euler's formula, and representing phasor diagrams in Cartesian and polar coordinates.
Mass Transport Phenomena: Fundamental concepts of diffusion, migration, and convection, specifically Fick's laws of diffusion in electrochemical systems.
Equivalent Circuit Fitting and Modeling: Designing electrical equivalent circuits (EECs) using elements like Constant Phase Elements (CPE) and Warburg impedance to fit experimental data.
Battery Characterization and Diagnostics: Applying EIS to evaluate State of Health (SoH), internal resistance growth, and degradation mechanisms in lithium-ion batteries.
Corrosion Science and Protective Coatings: Utilizing EIS to determine corrosion rates, polarization resistance, and the water-barrier performance of organic coatings.
Advanced Electrochemical Devices: Characterizing the kinetics and transport limitations in fuel cells, supercapacitors, and photoelectrochemical cells.
103.4K views1.2Klikes35:50Original Release: 2017-03-17
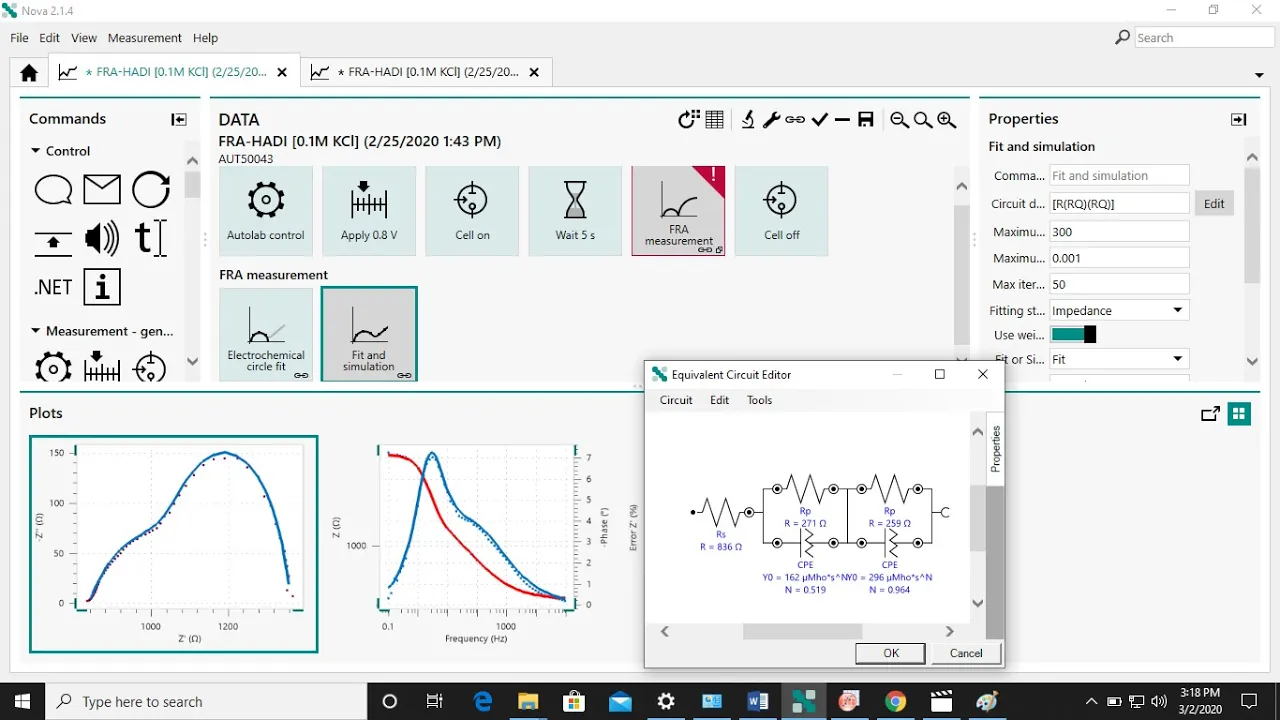
hello my name is Rob sides I'm one of the product managers here at amitech with responsibility for the single channel multi- channel line of potentia stats this includes instrumentation from both the prin plot research and solatron analytical Brands so today's conversation topic is going to be on electrochemical impedance spectroscopy or Eis Eis is a technique and we're going to introduce this here as part of this introduction series with other chapters of electrochemical Theory and inat working Theory we'll touch a little bit on the applications but you'll see the technique of Eis being discussed more thoroughly in the application Series to follow so the first thing I want to do is is compare DC techniques and AC techniques and this is going to be a little bit of a review from the previous introduction chapters but also lay the groundwork for uh some of the different terminology that you'll hear through the course of this particular conversation so we discussed previously when an electrode is introduced to an electrolyte it's going to form an open circuit potential and so this is just the potential that develops between that interface at that interface no net current is Flowing what we mean by that is electrochemical reactions are happening but the but there's no net current flow to be measured only thermodynamic information is available so that point in time we have not done anything we've not applied any signal yet so what I'm going to do with the potential stat allows me to do is to shift the potential and thus causing electrochemical reactions to flow and us to measure the uh the rate which as your electrons move so we're going to drive that potential of that cell away from its open circuit value to encourage or to uh dictate that electrochemical reaction happens we can do that with different signal types we can do that in the time domain or DC signal types such as ramps and constant bias there's another way we can apply signals we can do those based on AC waves or sign waves and those we refer to as the frequency domain so let's compare these in a DC experiment we're going apply a potential that may irreversibly change the system because it may be a large potential and the current that's measured back is uh it's a sum of the current from all the different processes in the reaction so if we cont that to the AC experiments where we're going to apply a small AC wave of changing frequency so an AC wave would be defined by its frequency and magnitude and these experiments will typically use a fixed magnitude and a changing frequency the frequency dependence of different processes and the fact that I am changing that frequency I'm using that is my is my tool to probe different electrochemical processes and do separate their contributions to the to from the total response so in the Eis fundamentals really want to take everything back to those to some of the primary equations and primary Concepts we talked about in the uh in the introduction to Electric gal Theory and that was ohms law and so ohms law really defines the relationship between voltage and current that the ratio of those being the resistance now for AC methods we're going to just turn that resistance value into the more generic term of impedance it's more generic because this can cover impedance of of any reason why current is not flowing in the cell this could be resistance it could be capacitance it could be inductance it could be diffusion we're going to talk a little bit about each one of those in the following slides but the relationship is similar it's still the Rel still defines the relationship between voltage and current so here we're going to look at the a stimulus supplied as the voltage and then the AC current measured as the response and you'll see here picture it is the uh the black AC wave is the potential and the red uh AC response is the current AC wave in AC wave out but the uh ratio in magnitudes of those two waves is going to determine its impedance level so when we talk about the magnitude of impedance or its impedance level that's one of the ways we're going to going to characterize that and the other one is a is a component called phase and so what phase talks about or characterizes is the difference the offset between uh those two waves and you'll say you'll hear this referred to as the current either leads or lags the voltage separated by Theta and so we'll talk more about that in a little bit uh and here we also Define omega is the angular frequency or 2 pif so just as we return to the concept of ohms law and kind of apply that to to Eis generically let's return to Butler vulmer equation let's talk about linearity and we'll talk about the importance of linearity uh the butler vulmer equation really is used to determine how electrokinetics or how fast reactions happen and so it it defines this relationship of current here I to potential or over potential represented by Ada now when the over potential is small we can expand this and we can ignore some larger terms through tailor expansion series and it's going to simplify and reduce and the the the the importance here is that when the over potential is small that means the current varies linear with potential and so we can see this shown on the graph over here on the right uh in the range right around the open circuit voltage uh when I apply a small voltage I'm going to get a small current back and those are going to have a linear relation ship if I drove it with a very large voltage you can see the relationship would become nonlinear so what's the significance of this it tells me that for a small voltage whether it be at AC or DC small voltage I can separate electrokinetics from that however if I'm applying just a small voltage in a DC experiment I would not be able to get information about the mass transport that information is held at large potentials for a DC experiment but Eis can study a wide frequency range and by doing that I can capture information at the high frequency on electrokinetics and I can capture information on low frequency uh diffusion or mass transport region both in that experiment both by applying a small stimulus so now let's cover some of the the criteria for valid electrochemical impedance spectroscopy measurements we need systems be linear we need systems to be stable we need systems to be causal so let's talk a little bit about what each one of those mean uh first we talk about linearity and so if I if I look at H again we bring over the the the generic the AC version of 's law over here that says Z impedance now is the ratio of current to voltage and if I think about this if a system is linear then the signal level of a would give a response B defined by the relationship of impedance but if it systems linear and I double the signal in that means it's going to double the response out therefore the impedance level measured and calculated does not change nor does it influence by which one potential current is the signal and which one the potential the current is the response the next section is uh the next key criteria is stability and when we think about this we think about how long low frequency measurements can take example we have here is 1 millerz 1 millerz would be 1,000 seconds and 1,000 seconds represents almost 20 minutes and so that means to data capture just 1 millerz on a single cycle so a integration period of one it would you take 20 minutes to take that singular point so if the system is drifting during the course of the experiment uh low frequency experiments would not be valid low frequency data would not be valid so you can see then uh if we we also cover causalities just simply being that the response out is due specifically for your signal in then we can go back and we can we can look at if A System's linear if A System's stable and if it's causal that means that my Eis measurement is valid but also so it means that you can characterize it as being non-destructive because I've not changed the response by applying this Eis step so why is frequency important and we talked earlier about frequencies the tool in my toolbox is going to allow me to apply a small signal and probe both high frequency or fast electrokinetics and low frequency or slow processes such as diffusion but frequency does another thing for me as well and that's going to lay the fr the framework by which I uh do my data analysis and that is because the there are electrical components that have defined relationships between uh impedance and their their value uh and so when you look at this we the first one will'll cover the most simple one mathematically is the resistor the impedance of a resist resistor simply is the value of that resistor so now let's discuss the impedance of a capacitor this equation does have a frequency component remember we defined omega as 2 pi F and so what this tells me is that the impedance of a given capacitor is very high when we are a low frequency and very low when we are at high frequency the next component being an inductor so an inductor also has a frequency dependence on its impedance but that is a direct relationship meaning that when we have a at a at a high frequency the impedance of the inductor is high and at a low frequency the impedance of the inductor is low so over the next four slides I'm going to take each one of these common components used in electrochemical equivalent circuit and analysis and I'm going to delve into uh examples of where you would see them in different types of electrochemical cells representing different physical or chemical processes and so the first example we're we're the first the first one we're going to cover is going to be the resistance or resistor so when we think about where would I see resistance in electrical cell we can see that as solution resistance uh which is the resistance between the working electrode and reference showed as we see kind of pictured here also the equivalent series resistance or the charge transfer resistance so these are resistive values and these are the things that are going to be uh modeled by resistors in our electrochemical models in our the models of our electrochemical circuit so let's consider then or think about the equation and let's look at the value of a 1 kiloohm resistor and think about what its impedance looks like and how it impedance acts as we change the frequency during the experiment and since there's no frequency dependence on the impedance of a resistor even though I am sweeping the frequency the impedance of that resistor does not change and so we'll say the magnitude is going to be equal to the resistance value and the Theta that we talked about would be zero meaning the current and voltage are in Phase with each other so the next circuit element we'll talk about is capacitance or quick introduction a constant phase element so where are some physical or chemical processes that occur in our cell that are traditionally modeled by a capacitor well the first one that comes to mind is the electrochemical double layer uh remember the electrochemical double layer is the the state that exists because there is a charged electrode in a ionic electrolyte a capacitor is formed because of the dialectric of solvation or the the water diss solvating the salt of the electrolyte dissociates the Electro and those two charges cannot combine because those those ions stay solvated so let's consider what the impedance of the capacitor looks like as I change the frequency in the course of the experiment over here on the right I've got the uh I've copied in the equation for the relationship between uh capacitance and frequency on its impedance and this tells me that at high frequency the impedance is very very low for this capacitor and as the frequency gets lower and lower the impedance becomes Higher and Higher and so we could draw this on a on a on a plot that's going to give me a slope of a negative one line the Theta is going to be represented as 90° and that's going to be cause that the current and voltage then are out of phase so this describes the magnitude and then we see that the uh description of the phase being out of phase by 90° I'm also going to introduce a concept here called constant phase element because you see this often in literature used as a replacement for the th capacitor to model imperfect or leaky capacitors and this will always give you a better fit of data but simply because there are two degrees of freedom where there's two there's a single element that's fit with two different uh parameters since that two par two parameters are able to be adjusted you're going to have a better fit using a constant phase element so the next equivalent circuit element that we're going to discuss is going to be the inductance or an inductor examples in electrochemical cells or adsorption processes batteries but also there's an example of instrument artifacts being of cell cables uh so how does what is an inductor an inductor is going to happen when you have a magnetic field cre created by current flowing in a loop so a a prime example of when you would see this an electrochemical cell may be a uh a battery such as a form factor of like an 18650 lithium ion cell these are generated by by uh by by creating the most amount of material our energy density and the smallest amount of package and so they do this by then uh rolling up the current collector and this current collector then has current flowing in a in a loop thus creating this magnetic field that gets picked up by the voltage and sensed by the voltage leads and is seen by an inductance and seen as an inductance uh but if we think about how a potenti stat works and we we said that the the current for the potenti stats being sourced through the control amplifier that goes into the counter electrode it's being measured through the cell then at the working electrod lead back into the ID converter we have current flowing in a loop there as well so depending on the currents and depending on the frequency you may see an instrument artifact which is seen as inductance at high frequency of low impedance samples the current and voltage here are out of phase as well just the opposite 90° sign and uh you still have that linear relationship and with frequency and the slope of that line would be positive one so next thing we'll talk about is diffusion and uh this is this is a little bit more difficult to uh to describe with simple um passive electrical components because there's really not one that describes a diffusion phenomenon so if we take that that picture where we showed the electrochemical double A previously and let's let's keep walking out and expand that further you're going to see the diffuse layer and so in neran experiments or ner cases uh such as electrochemical sensors the potentials is the poti stat is po has poised the electrode to cause the electrochemical reaction to happen as soon as the ion gets to the electrode interface however that means current is waiting to flow until that ion can diffuse from solution and reach that electrochemical that electrode interface the electrode electrolyte interface and once that happens then the reaction happens so that means I'm waiting for that ion to diffuse to my electrode and since I'm waiting for that is limiting step and it's really the thing that's that's being sensed and defines how fast the reaction happens these are slower so generally we're going to pick this up at the low frequencies so as electrochemist I'm going to study electrochemical cells I'm not going to study simple uh simple electronic components and so let's take what we have learned about resistors and capacitors inductors and diffusion and let's start using them to start building up some theory behind my electrical cell and describe how these experiments are done and how the data is analyzed so if we think about it over here I have a uh the Randle cell and the Randle cell is simply a resistor that's in series with an RC a resistor capacitor Network that that that were in parallel and so this first resistor in series is commonly referred to or commonly uh is used to to characterize the solution resistance or the equivalent series resistance next the resistor that's in parallel with the capacitor is used to to quantify or kind of uh kind of a mimic the charge transfer resistance or the resistance to the fadic reaction that capacitor there then is the double layer represents the double layer of my Electro electrolyte interface and so you can see why the Randle cell then is the building block for a lot of more complicated models is the fact that virtually every electrical cell is going to have have uh some form of solution resistance it's going to have some charge transfer resistance and it's going to have some double AER established but let's look at the impact of frequency we're going to have here as well the electrons are trying to flow through this circuit and so which way is it going to go where am I going to see the different types of information well at high frequency what's going to happen is electrons are going to flow through that solution resistance and it's going to get to that branch of the parallel circuit that point in time I can go up through the other resistor or I can go down through the capacitor and how does the electron decide which way it's going to go it makes that decision based on what frequency he is at so when I get to that Branch I can go the at high frequency the impedance of that capacitor is low because of its inverse relationship therefore that acts like a short and I the electron goes straight from the resistor straight through uh just as that capacitor is not there and so I only C or the responses back uh quantifies the value of that series resistance as I step the frequency lower and lower the impedance of that capacitor changes and the extreme example of very low frequency now the capacitor's impedance is very high and so what that means is my electron now he still flows to that series resistance in front but when it gets to the parallel Network it's forced up towards the uh its path of least resistance is up through the second resistor so at that point in time the entire resistance or at that point in time the entire impedance measured is the combination of those two resistors because they've added because they're acting like resistors in series what this does is gives me more information about the cell and so it also gives me a way to identify what value or assign a starting value for my solution resistance because of the high frequency and then at low frequency I now know my solution resistance so I can solve for my charge transfer resistance and then we use mathematical programs to approximate through and fit through uh to find values for that capacitor these data are plotted in two different ways they can either be Bode or bod plots here on the left uh the axes that you'll see here is the x axis is the log of frequency and the y1 axis is shown as the log l Of Z or log of impedance value you often see this graphed with the phase as a Y2 axis uh or on a separate graph over here on the right is the equivalent data and that's important to understand it's the equivalent data shown in a different representation so it's two different ways to look at the same data and over here we'll see a zp Prime versus Z prime or a uh or a Z real versus the imaginary plot and so we look at this you can see in this example at the highest frequencies of 100 khz so I'm reading this right off the bod plot I can I can look over at the impedance value there and I can see that I had approximately 10 ohms of impedance at the high frequency so again that was a that is a uh a first approximation of how much solution resistance or how much equivalent series resistance we had you can see I start picking up this negative one relationship the slope of the line being negative 1 and the capacity region and then down at the low frequency you can see that I've picked up a a solution resistance plus charge transfer resistance and you can see that uh that's approximately 100 ohms then would be the approximate uh charge transfer resistance and you will see the same thing over here the nyis plot I'm I'm use the next graph to show you this so now let's take some of these different electrical components and look to see what their representations would look like on the bod plot so the top left hand corner I have the Bode plot of a resistor since a resistor does not have a phase dependency there's not going to be any imaginary impedance so we expect that the resistor nyis plot would be a single point it would be on the the real uh axis the x- axis and it's going to be uh representative of the value of R if we look below that uh we can see the relationship of a capacitor on the nyis plot here from increasing frequency uh you can see the relationship would be a vertical line of a pure capacitor on the Nyquist plot so let's take that resistor and capacitor let's stick them together now and I'm going to get the vertical line from the capacitor but it's going to be offset by that value of resistance and down here we're going to take this relationship and build upon it further to see what this nyis plot looks like for a Randle cell this popular Randle cell then I'm going have the R1 and R2 and a c and you can see at the high frequency here I'm only going to have R1 at low frequency I'm going to have the combination of R1 plus R2 therefore the uh the diameter of the semicircle being the value of R2 so again let's take what we've learned uh and and look at how data is typically modeled in a real cell so here is a nyis plot that we that we acquired on a lithium ion battery that was used for a BlackBerry cell phone and so what we've done is taken this uh this response and we have built an electrochemical circuit analysis or equivalent circuit uh shown over here on the right and then we use different software to fit these different parameters and we can see we have an inductance shown here by a value going below the x-axis over to a time constant RC time constant represented by one RC network into another RC network uh these fits mathematical operations are going to fit these to build equivalent circuits we can look in the literature for uh for great reference gods and we can also start from our physical and chemical processes and work out to electrochemical models here's another great example of a solar cell and it demonstrates the ability to measure five different regimes uh we're going to get a series resistance we're going to get cathode kinetics pores electrod transmission line into recombination and into diffusion uh limiting response we're get all this information in a single experiment and I'm going to be able to separate out these currents and assign different current values back to different physical processes in the cell and I can do that because of the frequency dependence of these so talk quickly about the bandwidth of a system so when we talk about impedance measurements these are made as as high frequency as megahertz level of uh of frequencies and so when we think about something in megahertz the the system needs to be able to respond very quickly so how can we determine how quickly the the system is going to respond well it's going to be a function of the potenti stat being used the cell cable and the cell being measured at all uh also and so that's because the bandwidth could be limited by the ID converter if you're in a low Uh current range that low current range has a high current measurement resistor value and that high current measurement resistor goes with the uh goes with the capacitance on the board and the cell cable and Builds an RC time constant and so that could be limiting your bandwidth the rise time your control amplifier could be limiting the bandwidth your higher impedance reference electrodes could be limiting the bandwidth any additional information uh instrumentation uh that's required for these measurements maybe limiting the bandwidth and so what potenti stat manufacturers do then is we're going to characterize the potential stat itself and design specific calibrations and core corrections to kind of uh compensate for the fact that of these of the bandwidth of potential stats in their cell we can see that in this type of graph if you take a 100 milliohm resistor and I'm going to sweep the frequency on 100 millium resistor so we'll think back and we'll say the impedance of the resistor is going to be constant it's going to be just the value of that resistance and so here what we expect to see is a 100 Milli ohms flat across the whole entire frequency spectrum and in the red plot I get pretty much that and that's using a galvanostatic Eis with a high current potenti stat not a booster that's going to have faster bandwidth what you see out of the blue plot then is the same cell tested with a Eis through an external booster so potenti stats that require external boosters to boost the current level our signal level to uh to make these measurements you can see below we'll say 2 khz uh we're able to measure that 100 milliom but as I go to higher and higher frequencies you going to see this impact of what we call rolloff and you can see the signal uh the the the impedance value rolls off and deviates from the uh the expected value so what are some points for us to consider here the vast majority of literature when you start reading about Eis experiments they're going to be taking potentiostatic mode experiments and they're going to be using 10 molts signal 10 molts because it's it's it's seen as a small enough voltage uh to be in a linear region on most cells and it's going to be a uh a high enough voltage to try and generate enough current for us to measure on the uh on on most cells as well so it's that kind of in between value but you can use best practices on your system system to determine which mode of E I should apply because if we think about when we talked about linearity we we showed the uh example of how you can double the signal double the response and we generically talked about things as signal and responses being the ratio of which would give you the impedance but we did not really talk about whether it needed to be an applied potential or applied current and that's because the the impedance value calculated is going to be independent of mode so we talk about you'll hear talk about when we talk about the the energy talk in the application Series you'll talk about we'll talk about the gal anastatic Eis and we talk about corrosion and and physical electrochemistry we'll generally talk about potenti static Eis and the reasons why we use these different modes and then stimulus level you know we'll talk about this again here the over the next slide but it's going to talk about the idea that I want a large enough signal to generate enough response for me to be able to measure it cleanly but I don't want such a large signal that I drive the system into a nonlinear Reg region and some advice that we have here is to uh you know only add when we we take the results and we start we start modeling the results try and only add equivalent circuit pieces or equivalent circuit components to your model if they have explainable physical or chemical processes in your cell next thing you really want to consider the capabilities of the instrument being used for the measurement and the reason we want to do that is to make sure we're not looking at instrument artifacts uh such as the inductance from the cell cables or capacitance of the cell cables or if we're just measuring the input impedance of the electrometers so I promise you a little bit more advanced uh Eis discussion over the next two slides and one is is a is a technique called harmonic analysis and it's really a useful tool to to determine the appropriate signal levels that you can should apply during Eis testing and so again if the signal is too high my response is going to be nonlinear and the signal is too low my response may be noise dominated so how do I know over on the left hand side I have this kind of a uh the same graph we showed in the butler vulmer slide to demonstrate linearity now I'm looking at a at a value that is further away from the open circuit value and it's not in a and it's now in a nonlinear relationship and so this is data from a single sign frequency of 180 Herz with a large stimulus and so I get a nice ac voltage being applied to the cell and then I get a response but it's not uh it's not a uniform it's no longer a sine wave of current this indicates I'm in the nonlinear region and so how would I know that well if I oversampled the data and performed a fft fast for transform on on the data what you would see from this nonlinear data is a peak an amplitude versus frequency graph a Peak at the applied frequency 180 Hertz and then you would start to see harmonics or every uh 180 htz uh 360 and then 540 you'll start seeing as we go with frequency two times the frequency three times the frequency four times the frequency five times the frequency you'll start seeing these harmonics drive out the presence of those harmonics in a harmonic analysis would tell you that the signal you've applied is too large because we're picking up this nonlinearity what this would also do is between the harmonics you see basically a noise floor and so what we want to do is make sure that our response for the at the applied frequency is large enough above our nose floor that we can confidently say that we're measuring the the response with high quality and so this this harmonic analysis is is an advanced tool this going to allow you to understand whether you're in the nonlinear uh region or not or linear region most electrochemical impedance spectroscopy tests are desired to be ran in the linear region there is a small subset of material studies that do uh benefit from some nonlinear analysis another we talked about the stability of your system we talked about well you know who wants to who wants to speed up our Eis plots uh Eis testing can be have very long duration and so that's going to be driven by the lowest frequency you measure it's going to be driven by your data point density and then the impact is going to be driven by uh by System stability so really I want to I want to test e faster so there's there's people who are trying to study low frequency such as diffusion controlled processes specifically like intercalation of batteries and then also samples that are active so these these applications really benefit from the ability to speed up the elect the total Eis duration time and so there's a technique referred to as multi sign Eis they're really going to use the principles of that harmonic analysis we just talked about to really mix together and apply many different frequencies on AC wave as as possible up to here on the on this this graph over to the right I'm showing the 31 different sine waves kind of added together and applied to your system simultaneously so the ability to apply a very complex waveform to your system and then extract all that data back out at the different frequencies I allows us to drastically decrease the total test time down where now it's just kind of dominated by the single lowest frequency instead of successive points all the way up to that lowest frequency so let's review some key Concepts and summaries so electrochemical processes occur at different rates the conversion of time so DC experiments like ramps and DC biases when we convert those to the frequency domain and study things using AC waves for in spectroscopy we can separate out these different electrochemical processes in general fast processes like electrokinetics or studied high frequency and slow processes like diffusion are studied at low frequency and Eis can determine the the total uh individual mechanisms contribution to this the uh the characteristics of the cell single experiment and this is going to allow us to do a lot of different things like fault analysis or study state of charge batteries and this kind of things like this well thank you for your attention this concludes today's conversation on electrochemical impedance spectroscopy Eis testing Theory as a technique again this this partners with the other introduction chapters on electrochemical Theory and poti Stat working Theory and all these provide the framework by which we'll discuss uh more in depth different applications thank you and have a good
Up Next

44:36
Buffers and Buffer Capacity: pH Calculations in General Chemistry
@ChadsPrep
163K views•2022-02-14

83:56
Biocatalysis and Catalysis in Islatravir Synthesis | Merck Webinar
@SCIwheresciencemeetsbusiness
675 views•2020-10-08
10:06
1H NMR: Determining Number of Peaks from Structure
@MSJChem
59.2K views•2017-04-06

17:31
Edible Water Bottles: A DIY Guide to Sodium Alginate Spherification
@ryan
10.5M views•2019-06-21
Related Study Plans & Knowledge Roadmaps
Structured learning paths in Chemistry
chemistry
Nuclear Chemistry: Decay, Meds & Fuel Cycle
01Introduction to Nuclear Structure and Radioactivity
02Decay Dynamics and Kinetics
03Radiation Interaction and Detection
+ 2 more learning modules
24h5 modules
Explore Roadmap
chemistry
Supramolecular Chemistry: Forces & Machines
01Foundations of Chemical Bonding and Intermolecular Forces
02Introduction to Host-Guest Chemistry
03Thermodynamics and Dynamics of Self-Assembly
+ 2 more learning modules
16h5 modules
Explore Roadmap
chemistry
Photochemistry: Excited States & Reactions
01Foundations of Light-Matter Interactions
02Molecular Orbitals and Electronic States
03Photophysical Processes and Jablonski Diagrams
+ 2 more learning modules
18h5 modules
Explore Roadmap
chemistry
Coordination Chemistry: Bonding & Properties
01Introduction to Transition Metals and Ligands
02Crystal Field Theory (CFT) and Geometry
03Magnetic Behavior and Spin States
+ 2 more learning modules
14h5 modules
Explore Roadmap