KEGG (Kyoto Encyclopedia of Genes and Genomes) is a comprehensive database that maps biological pathways, connecting genes, enzymes, compounds, and reactions to help researchers understand metabolic processes, disease mechanisms, and molecular interactions in systems biology and functional genomics studies.
Exploring KEGG Pathway Database: A Bioinformatics Guide to Metabolic Pathway Analysis
Added:Deep Dive
Basic biochemistry concepts, including metabolic pathways, enzymes, substrates, and the central dogma of molecular biology.
Biomolecules One Shot Lecture 2 | 3d Animation | NCERT Class 11 | Biology | Best for NEET
162.6K
Living organisms contain biomolecules in specific concentrations that constantly turnover through chemical reactions. Metabolism encompasses all biochemical reactions maintaining life processes including structure, growth, reproduction, and environmental response. Metabolic pathways are linked reaction series transforming biomolecules, classified as linear (glycolysis) or circular (Krebs cycle), dividing into anabolic (building complex from simple, e.g., glycogenesis) and catabolic (breaking down complex to simple, releasing energy, e.g., glycogen breakdown). ATP serves as the primary energy carrier, storing energy in chemical bonds for cellular work. Living systems maintain a steady state (non-equilibrium) through continuous metabolic energy input. Enzymes act as biological catalysts accelerating reactions without being consumed, with most being proteins and some being ribozymes. They possess primary, secondary, and tertiary structures, with the tertiary structure forming an active site where substrates bind. The catalytic cycle involves substrate binding, conformational changes stabilizing the transition state, bond breaking/forming, and product release. Enzymes dramatically lower activation energy barriers, enabling reactions millions of times faster than uncatalyzed processes. The same substrate can yield different products under different conditions (aerobic vs anaerobic respiration), demonstrating metabolic pathway specificity.
Click to watch →

Biochemistry | BTEUP D.Pharma | 2nd Year | महा मैराथन | 3 Hours Non Stop #dpharma #bteup #pharmacy
32.6K
Enzymes are biological catalysts that increase reaction speed by lowering activation energy, mostly proteins (except ribozymes) and highly specific. Mechanism: enzyme + substrate → enzyme-substrate complex → enzyme-product complex → enzyme + products. Two hypotheses explain binding: Lock and Key (Fischer) with rigid active site, and Induced Fit with flexible active site. Inhibition types: competitive (competes for active site), non-competitive (binds allosteric site), and uncompetitive (binds enzyme-substrate complex). Amino acids are protein building blocks with general structure: amino group, carboxyl group, hydrogen, and variable side chain. Classification by chemical nature: non-polar (AGILMV), polar (STCPE), aromatic (phenylalanine, tyrosine, tryptophan), basic (HAL), and acidic (aspartic acid, glutamic acid). Classification by essentiality: essential (cannot be synthesized - VIP HALL) and non-essential. The Krebs cycle (citric acid cycle/TCA cycle) is a central metabolic pathway in mitochondria producing ATP, NADH, and FADH2. The urea cycle converts toxic ammonia to urea in the liver.
Click to watch →
Curso Intensivo RIBA - Biotecnología Molecular
149
Metabolic pathways are ordered sequences of enzyme-catalyzed reactions transforming substrates into specific metabolites. Enzymes, encoded by genes, accelerate reactions to second-scale rates. Genome annotation assigns functions to genes, with complete gene sets forming genomes and metagenomes. Metabolism performs three core functions: matter interconversion, energy transduction (primarily through ATP), and homeostasis (dynamic equilibrium). Pathways are classified as catabolic (degradation for energy), anabolic (assembly using energy), or amphibolic (combining both, like the Krebs cycle). The major bottleneck is homeostasis, requiring control at enzyme, redox, and gene levels.
Click to watch →
BIOLOwieczorki z Michałem - metabolizm kontratakuje
7.9K
Enzymes are biological catalysts that accelerate biochemical reactions by lowering activation energy. Enzyme regulation occurs through competitive inhibition (binding to active site), allosteric inhibition (binding to regulatory site), and phosphorylation (adding phosphate groups to activate or deactivate). For exam purposes, students need to know only substrates and products of metabolic pathways: glycolysis converts glucose to pyruvate, while the urea cycle converts ammonia and CO2 to urea. The active site is defined as the location where substrate binding and reaction occur by definition.
Click to watch →
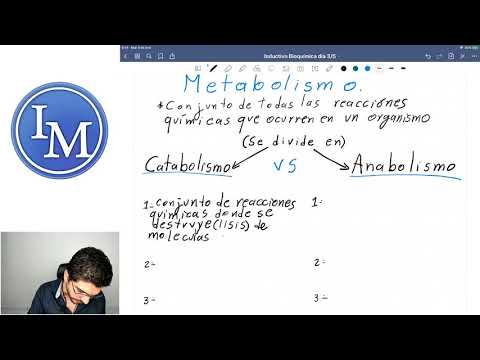
Introducción a la Bioquímica | Clase 1 | Metabolismo, Anabolismo y Catabolismo
365.8K
Biochemistry studies the chemical composition of living organisms and their reactions. A living organism possesses its own metabolism, while viruses are non-living due to lacking independent metabolism. Metabolism encompasses all chemical reactions in an organism and divides into catabolism (breaking down complex molecules to release energy, exergonic reactions with negative delta G) and anabolism (building complex molecules from simpler precursors, endergonic reactions with positive delta G). Catabolic pathways include glycolysis, glycogenolysis, proteolysis, and lipolysis, producing ATP and NADH. Anabolic pathways include glycogenesis, gluconeogenesis, protein synthesis, and lipogenesis. The suffix '-lysis' indicates catabolism, while '-genesis' indicates anabolism.
Click to watch →
Deep Dive
An understanding of bioinformatics databases and how biological data (such as gene IDs, proteins, and chemical compounds) is indexed.
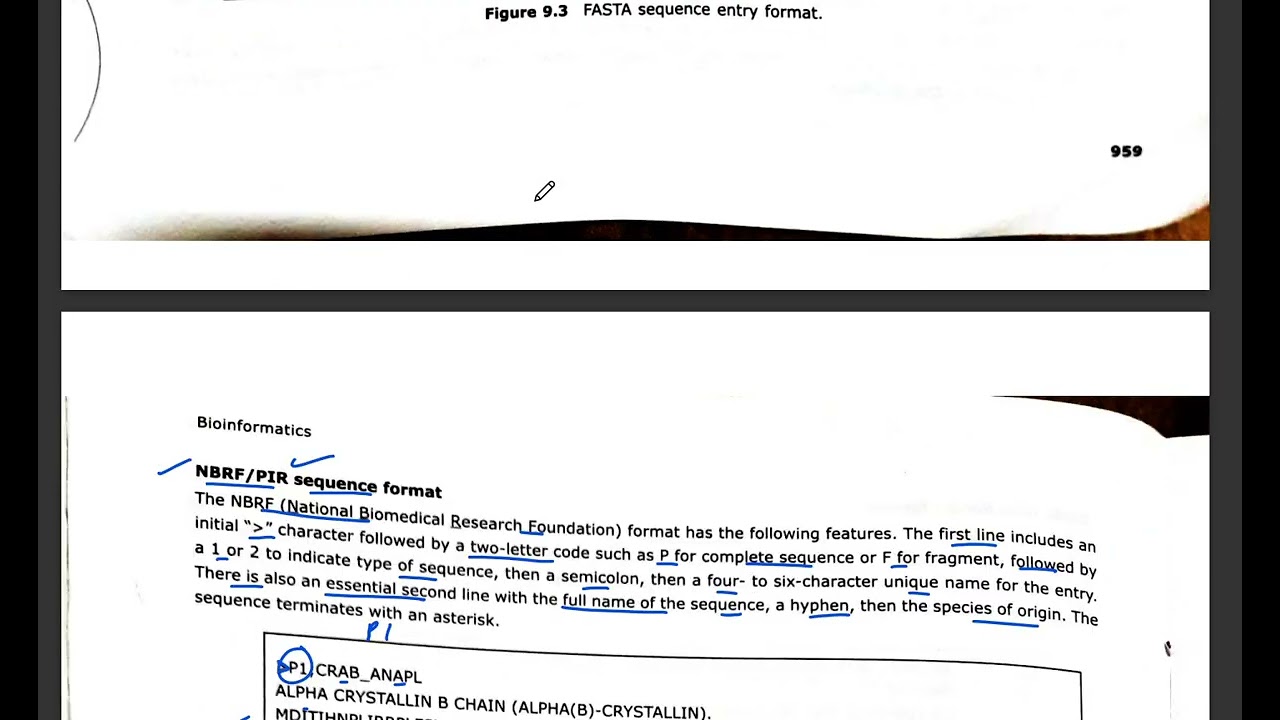
Bioinformatics One Shot
1.2K
Bioinformatics is an interdisciplinary field combining computer science, biology, information technology, and mathematics to analyze biological data. It encompasses physical map construction, gene discovery, molecular function analysis, and 3D structure interpretation. Biological databases are organized collections of data enabling researchers to locate, add, and modify information. Data exists in two forms: sequences (one-dimensional, including DNA, RNA, and protein sequences) and structures (three-dimensional spatial arrangements). The Protein Data Bank (PDB), established in 1956, serves as the first protein structure database and now contains over 83,000 structures. Major public sequence databases include GenBank, EMBL, and DDBJ, which store raw nucleic acid sequence data. Secondary databases like Swiss-Prot provide high-level annotation with minimal redundancy.
Click to watch →

Biological databases in bioinformatics | applications of biological databases in bioinformatics
5.2K
Biological databases are structured electronic repositories that organize, store, and retrieve biological data such as nucleotide sequences, protein sequences, macromolecule structures, gene expression profiles, and literature, characterized by two essential features: non-redundancy (minimizing duplicate entries) and data sharing protocols (allowing scientists to examine, verify, and update information), with common types including sequence databases (for genes and genomes), structural databases (for protein topology), literature databases (like PubMed Central), gene expression databases (such as GEO and SAGEmap), and chemical databases (like PubChem).
Click to watch →

Bioinformatics part 2 Databases (protein and nucleotide)
243.2K
A database in bioinformatics is a library-like structure designed to store and organize biological data. After DNA or RNA sequencing, the resulting sequence data is uploaded to specialized databases. These databases can be categorized into different types: some contain only nucleotide sequences, others contain only protein sequences, and some may include both. The purpose of these databases is to allow researchers to compare new sequences against existing ones to identify similarities and potential functions.
Click to watch →

Basic Bioinformatics by AjarnWi
121
Bioinformatics databases: PDB (RCSB, PDBE, PDBj) stores 3D structures with four-letter codes; CATH classifies structures into classes (alpha, beta, alpha+beta, few) with architecture, topology, and homologous superfamily; Gene Ontology (GO) provides controlled vocabulary with three domains (biological process, molecular function, cellular location) and hierarchical IDs; KEGG organizes biological pathways. Database IDs link across resources. Serious bioinformatics requires Unix command-line tools and programming skills beyond web interfaces.
Click to watch →
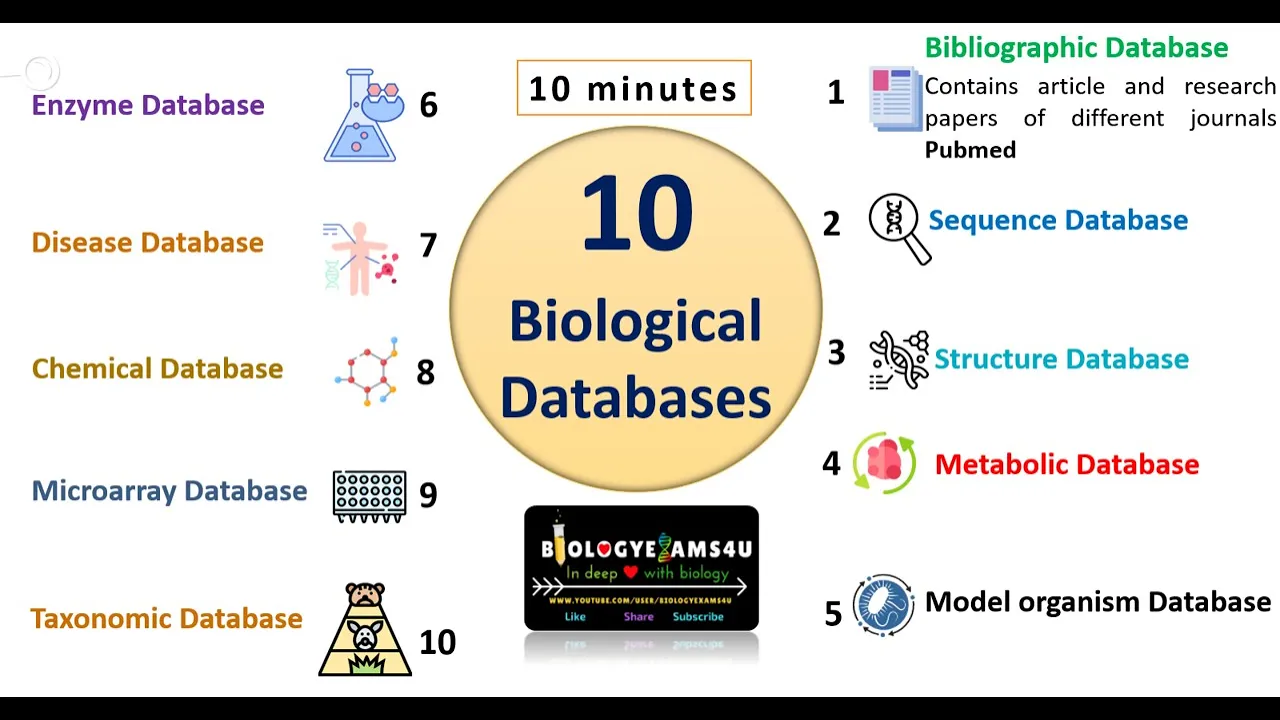
Types of Biological Database in Bioinformatics with example
4K
A biological database is an organized collection of related biological data (nucleotide sequences, protein structures, etc.) that can be easily stored, accessed, and managed; the ten main types include bibliographic databases (PubMed for biomedical literature), sequence databases (GenBank for nucleotide sequences), structure databases (PDB for 3D protein/nucleic acid structures), metabolic databases (KEGG for biological pathways), model organism databases (EcoCyc for E. coli), enzyme databases (BRENDA for enzyme information), disease databases (OMIM for human genetic disorders), chemical databases (PubChem for small molecules), gene expression databases (GEO for microarray data), and taxonomic databases (Catalogue of Life for species classification).
Click to watch →
Deep Dive
Familiarity with enzyme classification systems, particularly Enzyme Commission (EC) numbers and their role in catalyzing biochemical reactions.
Biomolecules l Lecture 16 l Biology l NEET
53.3K
Enzymes are classified into six main classes based on reaction type: (1) Oxidoreductases - catalyze oxidation-reduction reactions, (2) Transferases - transfer functional groups between molecules, (3) Hydrolases - catalyze hydrolysis reactions (bond breaking with water), (4) Lyases - catalyze bond breaking without hydrolysis, often forming double bonds, (5) Isomerases - catalyze isomerization reactions, (6) Ligases - catalyze bond formation between molecules, often using ATP. Each enzyme has a unique four-digit EC number indicating its classification.
Click to watch →

Enzymes & Cell | Biochemistry | FARRE 2.0 | MBBS Prof 1 | Dr. Rajesh
121K
The Enzyme Commission Number (EC number) is a four-digit number system used to classify enzymes. The first digit represents the class of enzyme (1 for Oxidoreductases, 2 for Transferases, 3 for Hydrolases, 4 for Lyases, 5 for Isomerases, 6 for Ligases, and 7 for Translocases). The second digit represents the sub-class, the third digit represents the sub-sub-class, and the fourth digit represents the individual enzyme. For example, SGOT (Serum Glutamic-Oxaloacetic Transaminase) has EC number 2.6.1.1, indicating it belongs to the Transferase class (2), sub-class 6 (transfer of nitrogenous compounds), sub-sub-class 1 (transfer of amino groups), and is the first enzyme in this category.
Click to watch →

Chapter 9 : Biomolecules | L4 | Class 11th NEET | Biology |
139
The International Union of Biochemistry and Molecular Biologists (IUBMB) classifies enzymes into six main classes (now seven as of 2018), each assigned a four-digit enzyme commission number. Class 1 (Oxidoreductases) catalyze oxidation-reduction reactions (e.g., alcohol dehydrogenase). Class 2 (Transferases) transfer functional groups (e.g., transaminases). Class 3 (Hydrolases) catalyze hydrolysis reactions using water (e.g., trypsin). Class 4 (Lyases) remove groups to form double bonds (e.g., aldolase). Class 5 (Isomerases) catalyze isomerization reactions (e.g., retinal isomerase). Class 6 (Ligases) join compounds together (e.g., DNA ligase). Class 7 (Translocases, added 2018) transfer ions across membranes (e.g., ATPase).
Click to watch →

Enzyme classification and nomenclature | IUBMB classification on enzymes
8.1K
The International Union of Biochemistry and Molecular Biology (IUBMB) classifies enzymes into six major classes based on the type of reaction they catalyze, each assigned a unique EC (Enzyme Commission) number: (1) Oxidoreductases (EC1) catalyze oxidation-reduction reactions involving electron transfer, such as alcohol dehydrogenase and lactate dehydrogenase; (2) Transferases (EC2) transfer functional groups between molecules, like hexokinase transferring phosphate groups; (3) Hydrolases (EC3) catalyze hydrolysis reactions breaking bonds using water, exemplified by amylases and lipases; (4) Lyases (EC4) catalyze addition or removal of groups to form double bonds, including aldolase and carbonic anhydrase; (5) Isomerases (EC5) catalyze isomerization changing molecular arrangements within a molecule, such as phosphoglucose isomerase; (6) Ligases (EC6) join molecules together using ATP hydrolysis, like DNA ligase and glutamine synthetase.
Click to watch →

#1 UNIT 2| Enzyme Action and Regulation | Nomenclature & Classification of enzymes
166
The IUBMB established a standardized classification system for enzymes using EC numbers (Enzyme Commission) following the format EC X.X.X.X, where each digit represents hierarchical classification levels. Enzymes are classified into six main classes based on reaction type: (1) Oxidoreductases (EC 1) catalyze redox reactions; (2) Transferases (EC 2) transfer functional groups; (3) Hydrolases (EC 3) break bonds using water; (4) Lyases (EC 4) form/break bonds without ATP/water; (5) Isomerases (EC 5) convert molecules to isomers; (6) Ligases (EC 6) join molecules using ATP energy. This systematic approach enables precise identification and comparison of enzymes across scientific literature.
Click to watch →
Deep Dive
A foundational grasp of systems biology, specifically how individual biological components interact within a larger network.

123 Lecture 1
2.7K
Systems biology emerged in the mid-1990s as a genome-enabled science following genome sequencing. The four-step paradigm involves: (1) understanding cellular components, (2) reconstructing interactions into networks, (3) converting to computational models, and (4) computing phenotypic functions. Biological networks are based on chemical transformations involving covalent bond changes or molecular associations, consisting of nodes (chemical compounds) and links (transformations). Three main network types are metabolism (small molecule transformations), transcriptional regulation (DNA-binding proteins controlling gene expression), and signaling networks (cell-to-cell communication). Mathematical models serve five purposes: organizing diverse information, quantitatively relating variables, discovering new strategies, understanding qualitative features of complex processes, and the principle that 'what I cannot create, I do not understand.' Biology operates across multiple scales: size scales from nanometers (molecules) to microns (cells), time scales from milliseconds (diffusion) to hours (bacterial doubling), and abundance scales from single molecules per cell to millimolar concentrations. Networks have steady states (unchanging) and dynamic states (changing). Multiscale analysis shows that as different events relax on different time scales, dynamic dimensionality shrinks, reducing independent variables and enabling variable aggregation.
Click to watch →

Die Vermessung des Lebens / Vortrag und Buchpräsentation
1K
System biology requires thinking in networks rather than isolated components. Living organisms exist at multiple interconnected levels: genes influence each other, proteins form networks, 37 trillion cells interact, and humans exist within social and environmental networks. This complexity makes traditional reductionist approaches insufficient. System biology uses mathematics to model these networks, enabling predictions about biological processes. This approach has already successfully explained disease spread patterns and is now being applied to understand individual health at unprecedented levels of detail.
Click to watch →

System Biology: A New Science
2.3K
Like a car's components, biological parts (genes, DNA, proteins) interact in networks to create properties more complex than individual parts. A simple yeast cell diagram shows genes represented as balls connected by lines representing interactions. Some genes are highly connected while others are loosely connected, forming subsets that carry out specific cellular functions. Because components are organized into networks within single cells, alteration of one component through mutation can affect many other parts of the network, representing a different way of understanding disease.
Click to watch →

일반 생물학 (기본교재 Campbell Biology - 11th) 강의 1 (1 Biology and Its Themes Inquiring About Life)
422
Systems biology is an interdisciplinary approach that studies how biological components interact within complex networks. Rather than studying individual parts in isolation, systems biology examines how components like genes, proteins, and cells work together to produce emergent behaviors. This approach helps explain phenomena like circadian rhythms and ecosystem dynamics by analyzing the interactions between multiple components.
Click to watch →
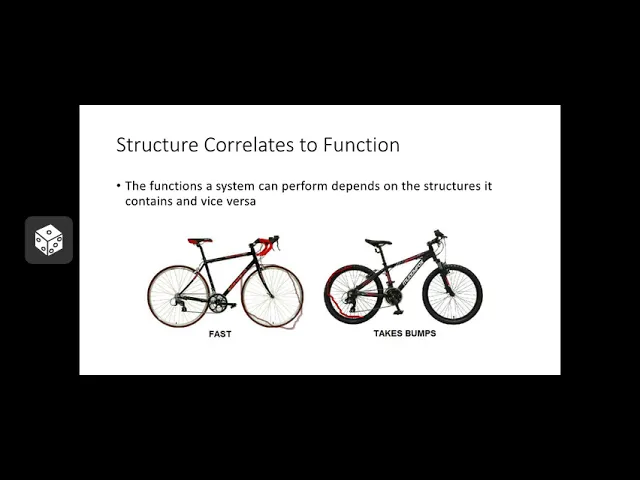
Chapter 1 Pt 1: What Is Biology Introduction1
834
Systems biology is an approach that studies collections of structures and how they interact with one another to make the whole unit work. Instead of studying a single chloroplast, systems biology might study an entire cell to see how all parts work together, then how cells form a leaf, how organs form a tree, and how trees form an ecosystem. This approach works in the opposite direction of reductionism, moving from small individual parts to big systems.
Click to watch →
Prerequisite Knowledge
- Concept 01Basic biochemistry concepts, including metabolic pathways, enzymes, substrates, and the central dogma of molecular biology.
- Concept 02An understanding of bioinformatics databases and how biological data (such as gene IDs, proteins, and chemical compounds) is indexed.
- Concept 03Familiarity with enzyme classification systems, particularly Enzyme Commission (EC) numbers and their role in catalyzing biochemical reactions.
- Concept 04A foundational grasp of systems biology, specifically how individual biological components interact within a larger network.
Subsequent Learning
- Step 01Advanced pathway enrichment analysis (such as GSEA or Over-Representation Analysis) using high-throughput transcriptomics or proteomics data.
- Step 02Constraint-based reconstruction and analysis (COBRA) and Flux Balance Analysis (FBA) for modeling metabolic networks mathematically.
- Step 03Applying KEGG pathway insights to computer-aided drug design, including target identification and network pharmacology.
- Step 04Metagenomic functional profiling, mapping microbiome sequence data to KEGG Orthology (KO) groups to understand community metabolic potential.
CAT Database
Core Concepts
Practical Usage
Key Takeaways
CAT Database
0:03Playing Section
- 1
Introduces the topic as CAT pathway database.
- 2
Sets the focus for the video's technical walkthrough.
Limitations of Predefined Pathway Databases: The Shift to Open-Source and Dynamic Systems Modeling
While the KEGG Pathway Database is a staple in bioinformatics, relying on it exclusively has significant drawbacks. First, KEGG's proprietary licensing restrictions for bulk academic downloads have driven researchers toward fully open-access databases like Reactome, WikiPathways, and MetaCyc. Second, from a scientific standpoint, KEGG's static, hand-curated diagrams partition continuous biochemical networks into rigid, artificial pathways. This can lead to confirmation bias in pathway enrichment analysis, as it fails to capture tissue-specific variations, dynamic kinetic rates, or novel interactions. To address these limitations, modern systems biology increasingly favors genome-scale metabolic reconstructions (GEMs) combined with dynamic constraint-based modeling, such as Flux Balance Analysis (FBA). These approaches allow researchers to simulate metabolic fluxes across the entire cellular system holistically, rather than relying on static, simplified pathway maps.
Deep Dive
Advanced pathway enrichment analysis (such as GSEA or Over-Representation Analysis) using high-throughput transcriptomics or proteomics data.
Lecture 55 : Pathway Enrichment - I
473
Pathway enrichment analysis transforms gene lists into biological pathways to interpret differentially expressed genes in clinical conditions, using two main approaches: Fisher's exact test (hypergeometric test) which tests for over-representation of genes in a pathway within a gene list, and Gene Set Enrichment Analysis (GSEA) which considers all genes without pre-filtering to detect coordinated changes across pathway members. Key pathway databases include MCDB, WikiPathways, KEGG, and Reactome, which provide curated gene sets representing biological processes and signaling pathways.
Click to watch →

Gene Set Enrichment Analysis (GSEA) – simply explained!
49.2K
Gene Set Enrichment Analysis (GSEA) is a functional class scoring method that addresses the limitations of traditional Over-Representation Analysis (ORA) by using a ranked list of all genes (ordered by significance and direction of expression change) rather than selecting differentially expressed genes based on arbitrary thresholds. GSEA identifies biological pathways by checking whether pathway genes are enriched at the top or bottom of the ranked list, using the Kolmogorov-Smirnov test to determine statistical significance. This approach eliminates dependency on gene selection criteria and accounts for both the magnitude and direction of gene expression changes, providing a more comprehensive summary of differential gene expression results.
Click to watch →
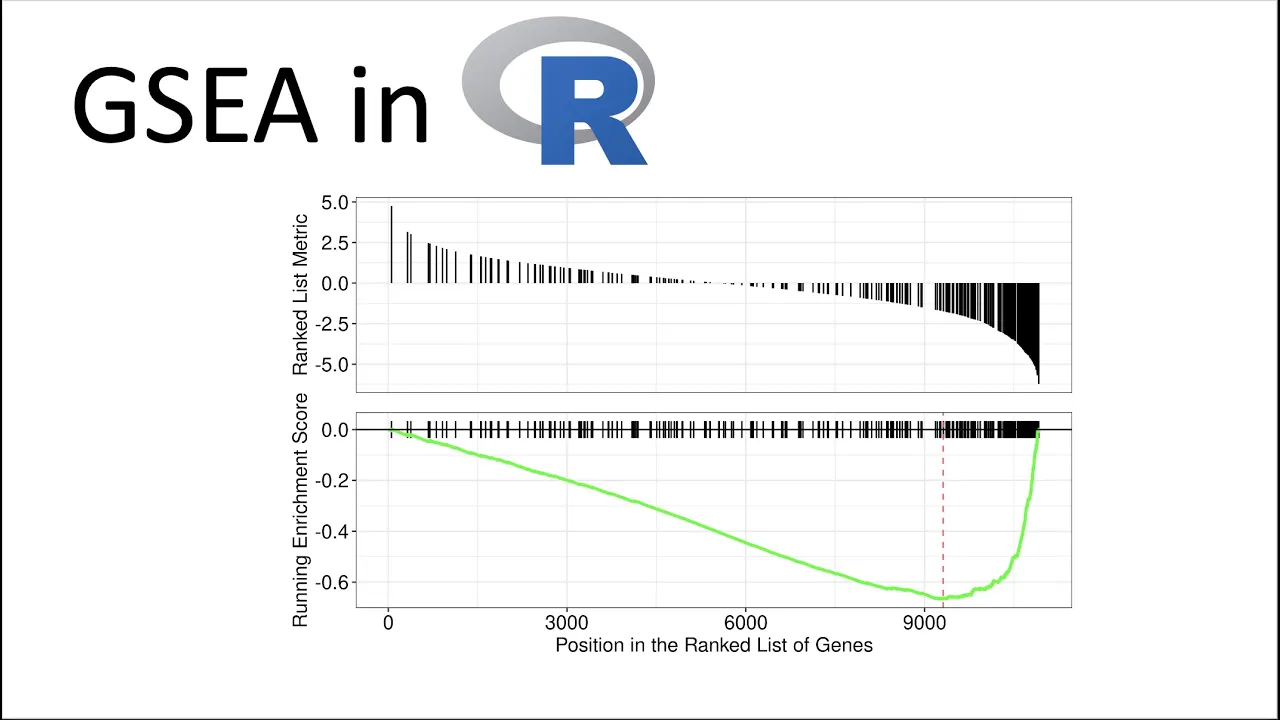
3 minute GSEA tutorial in R | RNAseq tutorials
34.2K
Gene Set Enrichment Analysis (GSEA) identifies biologically meaningful pathways or gene sets that are significantly enriched in differentially expressed genes by ranking genes based on statistical metrics (such as log fold change or p-value), then calculating an enrichment score that measures how closely genes from a particular gene set cluster together at the top or bottom of the ranked list; this method reveals which biological processes are overrepresented in upregulated or downregulated gene lists, providing functional interpretation of high-throughput transcriptomic data.
Click to watch →

Ludwig Geistlinger, Workshop 200: Functional enrichment analysis of high throughput omics data
530
Functional enrichment analysis bridges differential expression analysis with biological interpretation by identifying over-represented functional gene sets (such as pathways or biological processes) among differentially expressed genes; this workshop covers three generations of methods—from classical over-representation analysis using hypergeometric tests to modern gene set enrichment analysis using permutation-based approaches and network-based methods—and introduces the Bioconductor enrichmentBrowser package that enables systematic comparison of multiple enrichment methods across different gene set databases to identify robustly enriched biological processes.
Click to watch →
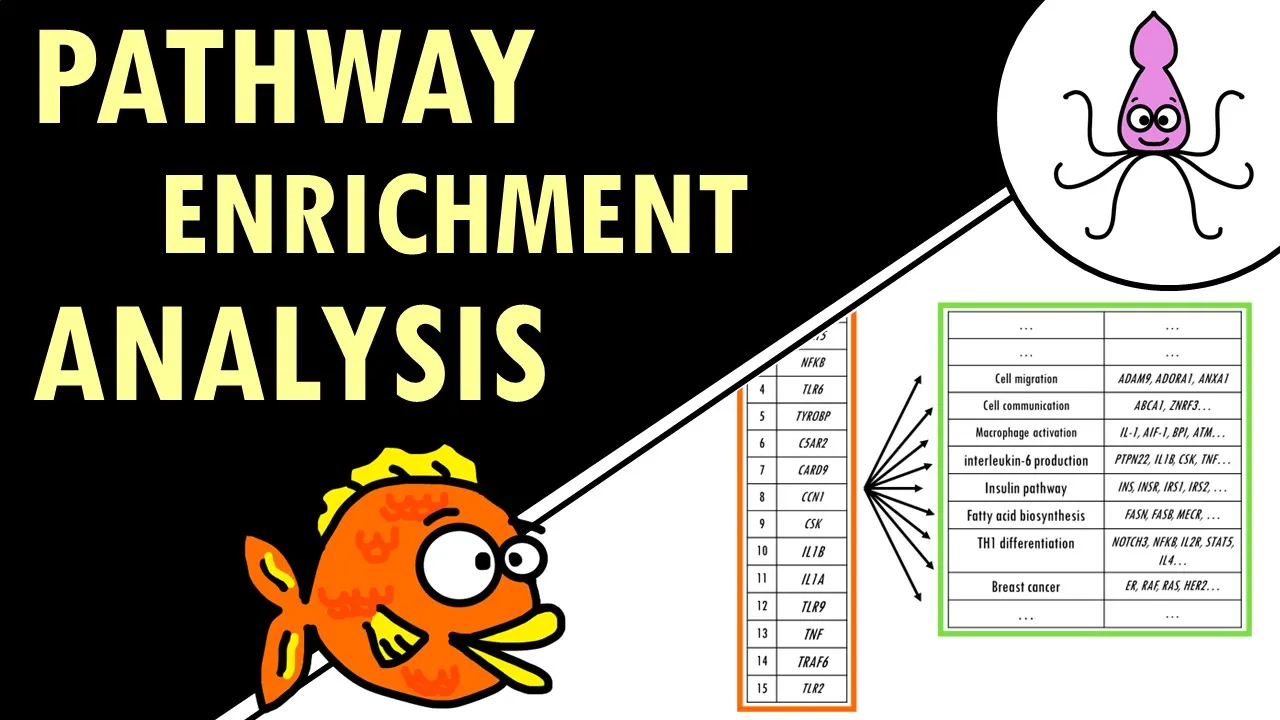
Pathway enrichment analysis - simple explanation!
45.8K
Pathway enrichment analysis is a computational method that summarizes long lists of differentially expressed genes into shorter, interpretable lists of biological pathways by comparing gene annotations against background gene sets using statistical tests like Fisher's exact test, while accounting for multiple testing through corrections such as Benjamini-Hochberg to identify overrepresented biological processes, functions, or disease-related pathways in gene expression data.
Click to watch →
Deep Dive
Constraint-based reconstruction and analysis (COBRA) and Flux Balance Analysis (FBA) for modeling metabolic networks mathematically.

#60 Other Constraint Based Approaches | Part 1 | Computational Systems Biology
1.4K
Constraint-based approaches in metabolic modeling extend flux balance analysis by using different objective functions while maintaining mass balance constraints. Minimization of Metabolic Adjustment (MoMA), proposed by Segre and coworkers, addresses a key limitation of FBA: the assumption that cells maximize growth rate. MoMA hypothesizes that perturbed cells minimize metabolic adjustment to survive. To implement gene deletion, one removes the corresponding reaction by adding a constraint setting its flux to zero. MoMA mathematically minimizes the squared distance between wild-type and deleted flux distributions, formulated as a quadratic programming problem.
Click to watch →

MIA: A Brown & B Cleary, Modeling genotype to phenotype: a search for "natural" objects of selection
848
Flux Balance Analysis (FBA) provides a quantitative framework for predicting cellular phenotypes from metabolic network structure. The method maximizes a fitness function (typically biomass production) subject to steady-state constraints (conservation of mass) and reaction flux bounds. This constrained optimization problem can be formulated as a linear program. The dual formulation reveals shadow prices—dual variables indicating selective pressure on each constraint. This mathematical machinery enables analysis of how genetic changes propagate through metabolic networks to affect cellular growth and fitness, forming the basis for evolutionary simulations that incorporate mutation and selection dynamics.
Click to watch →

From Genomes to Life: Constraint-Based Reconstruction and Analysis of metabolism by Anu Raghunathan
144
Constraint-based reconstruction and analysis of metabolism is a computational methodology that uses genomic data to build mathematical models of metabolic networks, enabling researchers to predict cellular behavior, identify metabolic reprogramming patterns, and understand disease mechanisms such as cancer chemoresistance by integrating experimental data with computational frameworks.
Click to watch →

Lecture 6.2 - COBRA Toolbox | Genome Scale Metabolic Models
4.8K
The COBRA Toolbox is a MATLAB/Python-based computational platform for genome-scale metabolic modeling, developed since 2007 by the Deane group and now maintained as an open-source project with over 1000 citations; it enables constraint-based reconstruction and analysis of metabolic networks by linking each reaction to its associated genes through Gene-Protein-Reaction (GPR) associations, supporting various simulation functions including flux balance analysis and flux variability analysis for studying metabolic system behavior.
Click to watch →

2017Julia Conference Day4 Heirendt v3
531
COBRA (Constraint-Based Reconstruction and Analysis) is a computational framework for modeling biochemical networks at genome scale. The stoichiometric matrix represents reactions mathematically, where rows are metabolites and columns are reactions. The fundamental equation S × V = 0 represents mass balance. Flux Balance Analysis (FBA) is formulated as linear programming with mass balance constraints and biological limits. Flux Variability Analysis (FVA) explores all possible flux distributions through 2N optimization problems. As models grew from thousands to millions of reactions, traditional approaches became insufficient, necessitating parallel computing solutions to perform efficient flux variability analysis on large-scale biological networks.
Click to watch →
Deep Dive
Applying KEGG pathway insights to computer-aided drug design, including target identification and network pharmacology.

Network Pharmacology Analysis Explained in Tamil | நெட்வொர்க் பார்மகாலஜி எளிய விளக்கம்
2K
The Network Pharmacology Analysis workflow is now complete. The comprehensive process includes: (1) ligand search in PubChem, (2) target prediction in Swiss Target Prediction, (3) gene identification in GeneCards, (4) Venn diagram analysis in Venny 2.1, (5) protein-protein interaction network in STRING, (6) hub gene identification in Cytoscape, (7) pathway analysis in KEGG, (8) functional annotation in DAVID, (9) visualization in SR Plot. This cost-free workflow enables researchers to conduct drug discovery and publish quality research papers without significant financial investment.
Click to watch →
Online workshop on Network Pharmacology
223
Common target identification compares plant constituent targets with disease-associated targets. From 209 Persea americana targets and 2,723 rheumatoid arthritis targets (DisGeNET), 86 common targets were identified using Venny software. Protein-protein interaction network analysis using Cytoscape with STRING database revealed 527 edges. Based on degree analysis, top 10 targets were identified: vascular endothelial growth factor, EGFR, ESR1, PTGS2, and others. These top targets represent most important intervention points for disease progression.
Click to watch →
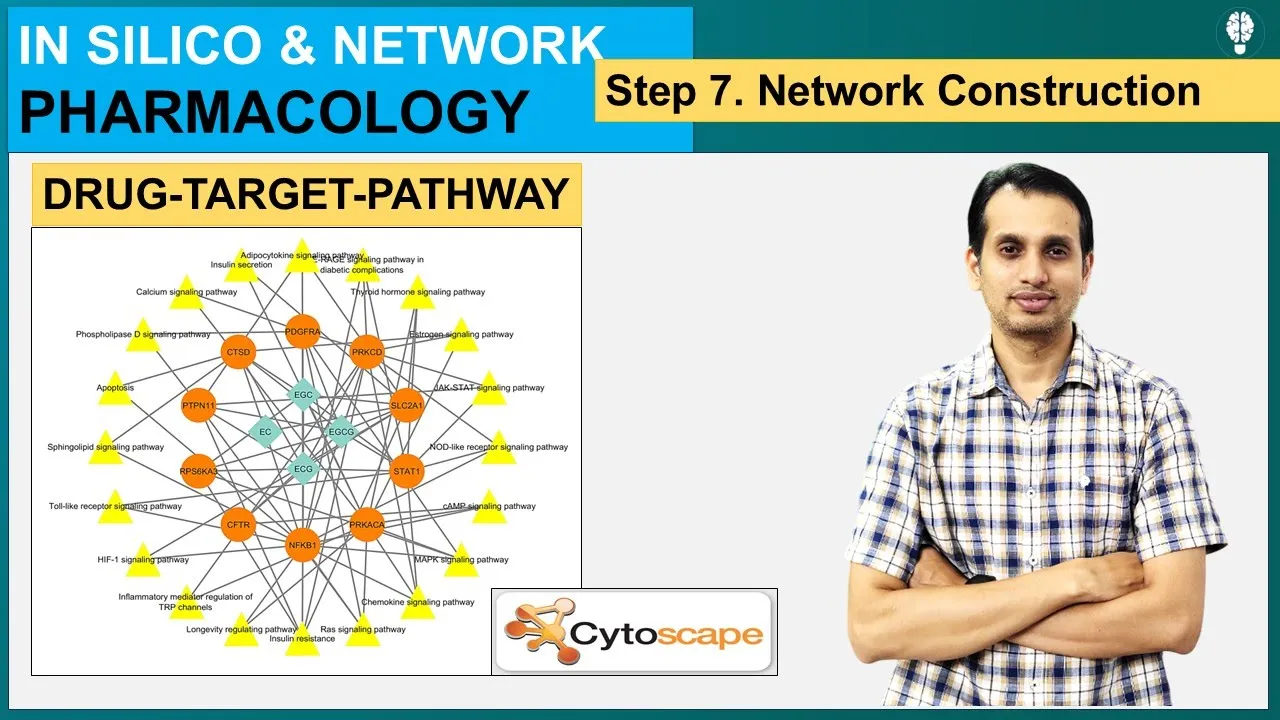
Network Pharmacology (Part 8) | Drug Target Pathway network | Cystoscape tutorial
4.4K
This comprehensive pipeline covers constructing and analyzing drug-target pathway networks: (1) Drug selection and target identification (quercetin from Neem plant), (2) Mining molecular targets and finding common core targets with disease (diabetes), (3) Literature review to select relevant pathways (endocrine resistance), (4) Creating structured databases in Excel with pathway-gene and drug-target relationships, (5) Using Cytoscape for network visualization including importing data, merging datasets, applying layouts, and customizing node appearance, (6) Analyzing network topology through degree analysis to identify key hubs (EGFR with degree 5), (7) Validating predictions through in silico molecular docking and molecular dynamics simulations using tools like AutoDock, MoleMole, and SwissDock. This end-to-end workflow enables systematic exploration of drug-molecular pathway interactions for pharmacological research.
Click to watch →
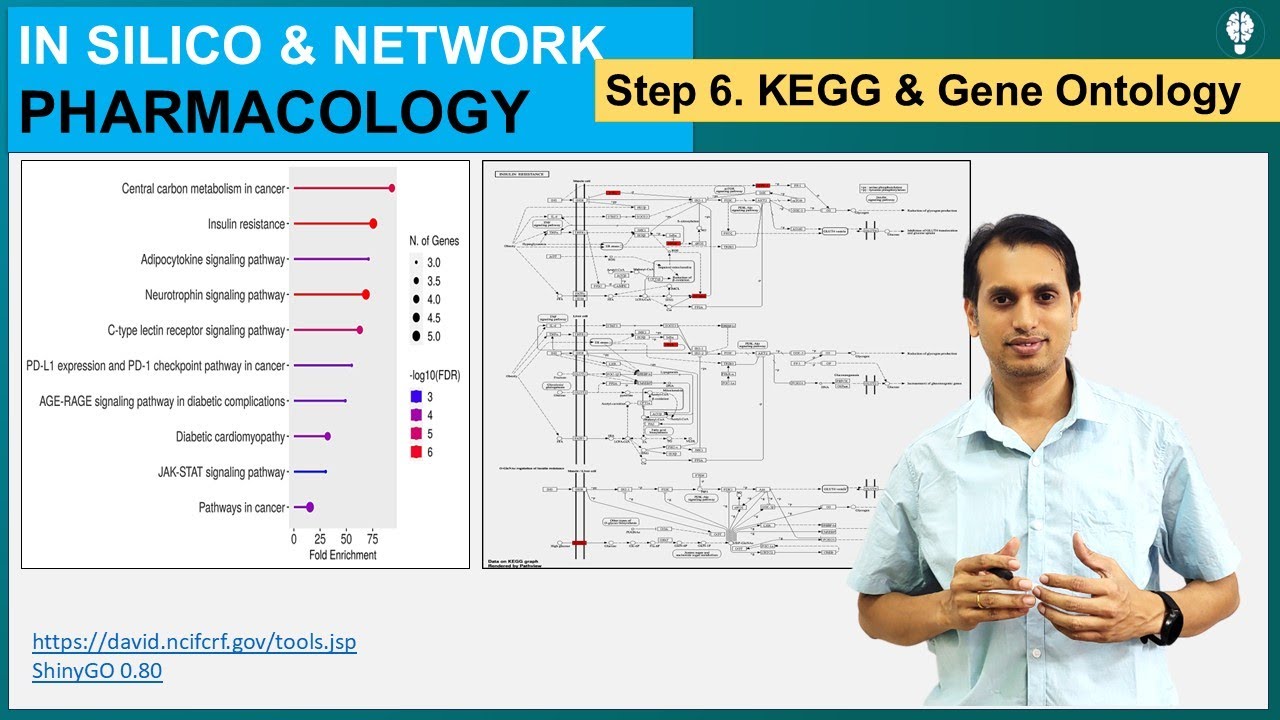
Network Pharmacology (Part 7) | KEGG and Gene Ontology Analysis | ShinyGO and DAVID database
4K
In network pharmacology, after identifying core drug targets through Cytoscape and STRING database analysis, researchers perform Gene Ontology (GO) analysis and KEGG pathway analysis using online tools like ShinyGO and DAVID database to understand the biological processes, cellular components, and molecular functions of these targets; this involves uploading gene lists, setting parameters such as FDR cutoff values (typically 0.05), minimum pathway size (2-3 genes), and selecting top pathways based on high gene counts, high fold enrichment values, and low FDR values, followed by creating visualizations like dot plots or bar charts to identify the most significant biological pathways and functions involved in disease-drug interactions.
Click to watch →
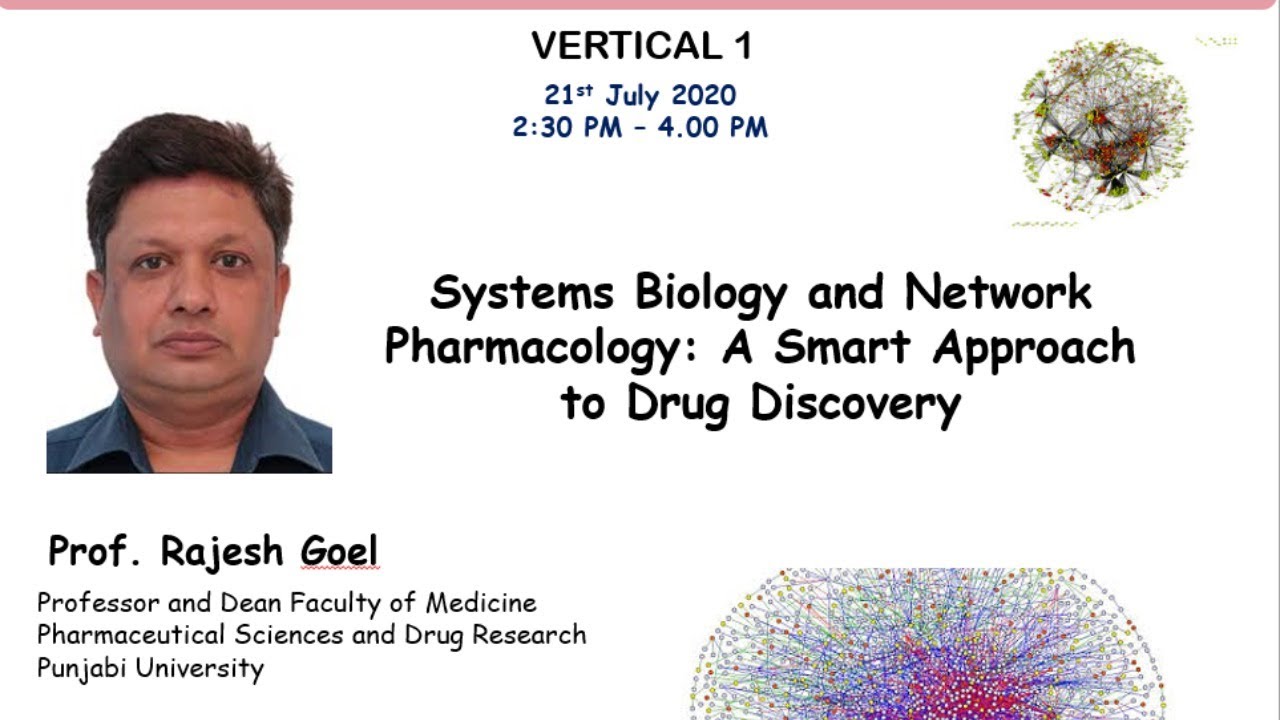
DDH-2020 Training Vertical 1 by Prof. Rajesh Goel
5.4K
This lecture explains how modern drug discovery has evolved from reductionist approaches (single-target, single-disease paradigm) to holistic systems biology and network pharmacology, which considers complex interactions between multiple genes, proteins, and pathways to identify novel drug targets and repurpose existing drugs more effectively, as demonstrated through a case study on vascular dementia where computational tools helped identify 10 promising targets from 1,972 phytochemical compounds.
Click to watch →
Deep Dive
Metagenomic functional profiling, mapping microbiome sequence data to KEGG Orthology (KO) groups to understand community metabolic potential.
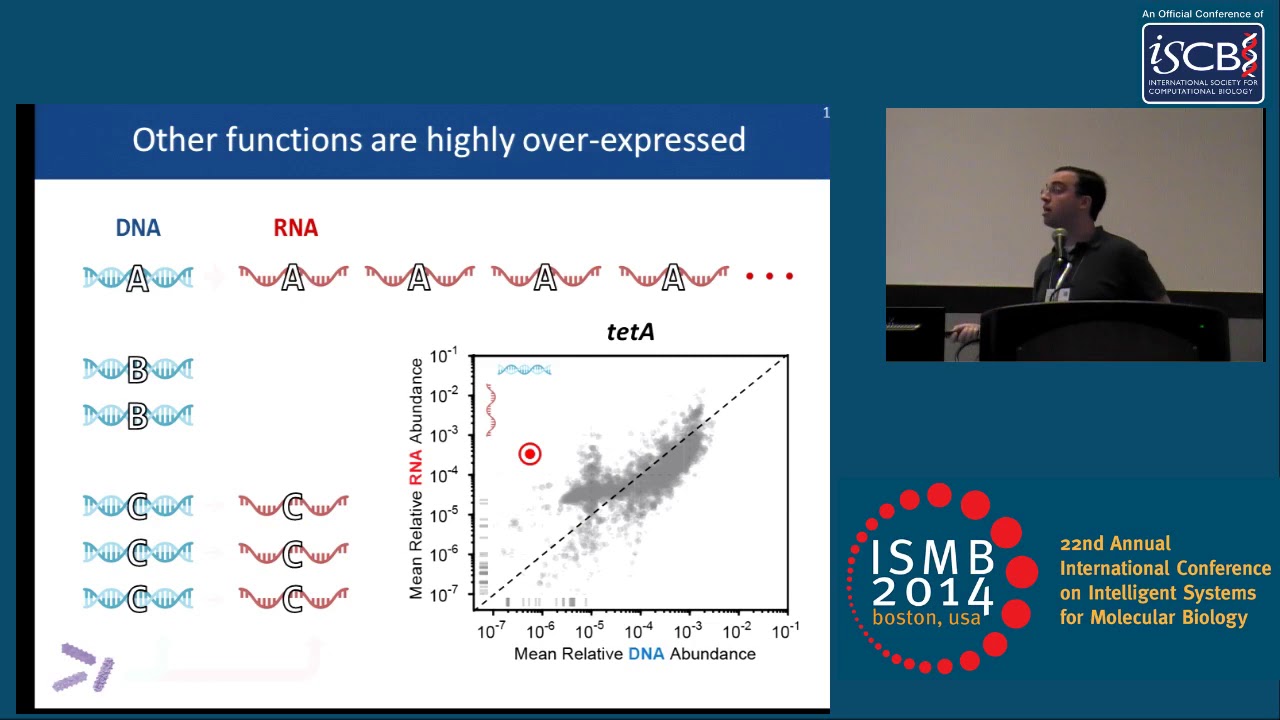
Relating the metatranscriptome and metagenome of the human gut - Eric Franzosa - ISMB 2014
288
Functional profiling is performed by translating sequencing reads against KEGG ortho groups (KOs), providing discrete functional units that can be hierarchically summed into pathways. Taxonomic profiling uses marker genes specific to each species, mapped against isolate genomes to generate accurate species composition profiles. The study found a strong correlation between functional potential (DNA) and functional activity (RNA) in the gut microbiome, unlike human cell types where many genes are turned off. Functions underexpressed relative to genomic potential include amino acid biosynthesis (due to dietary compound availability) and sporulation (a stress response not needed in healthy conditions).
Click to watch →

FUNCTIONALLY PROFILING METAGENOMES AND... - Eric Franzosa - Late-Breaking Research - ISMB 2016
598
Human2 implements a tiered read mapping strategy for functional profiling of metagenomes and metatranscriptomes, which first rapidly identifies species using marker genes, then builds custom pan-genome databases from detected species for detailed functional analysis, and finally applies traditional comprehensive search for remaining reads; this approach achieves both higher accuracy and faster processing (up to 7x speedup) while providing species-level stratification of functional profiles, enabling researchers to determine not just what functions exist in a community but which specific species are performing those functions.
Click to watch →
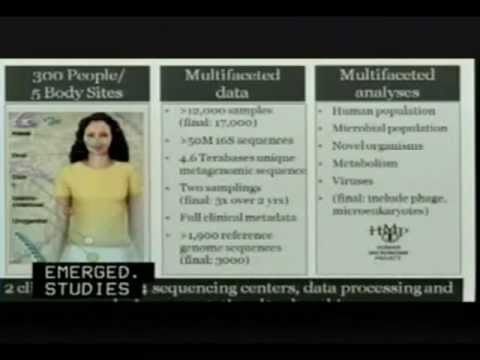
Microbiome Research - Lita Proctor
819
Whole genome shotgun sequencing enables comprehensive analysis of microbiome function by sequencing all microbial DNA in a sample. From approximately 1 million reads per sample, about 40-45% can be assembled into contiguous sequences, with approximately 90 million proteins annotated using reference genomes. Mapping these proteins to metabolic pathway databases allows reconstruction of microbiome metabolic capabilities. Analysis revealed that while microbial species composition varies widely across body sites, supported metabolic pathways show relatively low variability. The gut microbiome is enriched in nucleotide, amino acid, carbohydrate, and lipid metabolism pathways, while the oral microbiome shows enrichment in environmental information processing and genetic information processing pathways.
Click to watch →
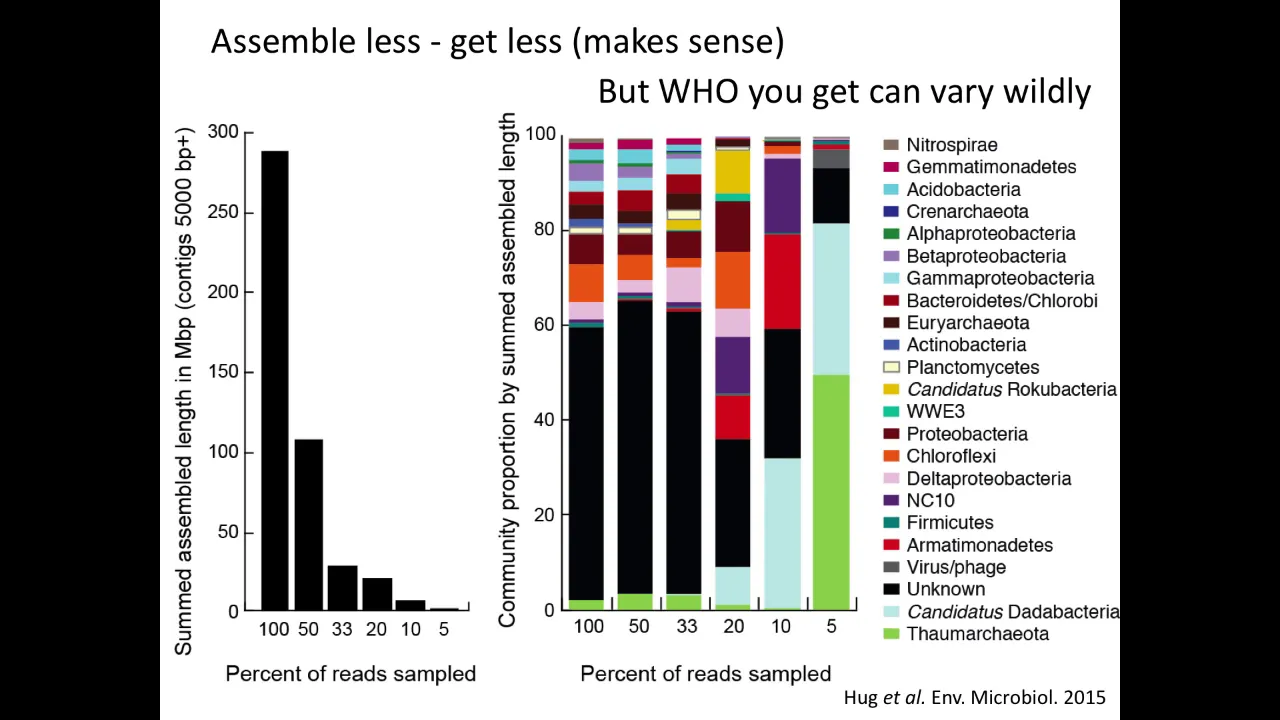
Metagenome Assembly, Binning, and Extracting Genomes
33.1K
Genome-resolved metagenomics enables connecting community composition with specific organismal functions, addressing questions about metabolic capabilities and ecosystem contributions. KEGG pathway mapping visualizes metabolic potential by comparing study genomes against reference databases, revealing conserved versus distinctive features. Gene annotation verification through conserved domain analysis and structural modeling is essential for critical functional predictions. Integrating metagenomic, transcriptomic, and proteomic data enables visualization of active metabolic pathways, distinguishing predicted capabilities from actual expression. RNA sequencing presents trade-offs: rRNA depletion increases mRNA representation (~5%) but eliminates community composition assessment from RNA data. The choice depends on research goals—whether prioritizing expression profiling or compositional insights.
Click to watch →

Analysis of Metagenomic Data: Functional Composition
1.8K
Functional composition in metagenomics determines what genes are doing in a microbial community, as opposed to taxonomic composition which identifies which microbes are present; this involves using databases like KEGG, eggNOG, and UNIREF to annotate gene fragments from metagenomic reads, with tools like HUMAnN and DIAMOND enabling efficient functional annotation by performing similarity searches against comprehensive gene family databases and normalizing results to account for biases such as gene length and sequencing depth.
Click to watch →
CAT Database
Core Concepts
Practical Usage
Key Takeaways
CAT Database
0:03- 1
Introduces the topic as CAT pathway database.
- 2
Sets the focus for the video's technical walkthrough.
Limitations of Predefined Pathway Databases: The Shift to Open-Source and Dynamic Systems Modeling
While the KEGG Pathway Database is a staple in bioinformatics, relying on it exclusively has significant drawbacks. First, KEGG's proprietary licensing restrictions for bulk academic downloads have driven researchers toward fully open-access databases like Reactome, WikiPathways, and MetaCyc. Second, from a scientific standpoint, KEGG's static, hand-curated diagrams partition continuous biochemical networks into rigid, artificial pathways. This can lead to confirmation bias in pathway enrichment analysis, as it fails to capture tissue-specific variations, dynamic kinetic rates, or novel interactions. To address these limitations, modern systems biology increasingly favors genome-scale metabolic reconstructions (GEMs) combined with dynamic constraint-based modeling, such as Flux Balance Analysis (FBA). These approaches allow researchers to simulate metabolic fluxes across the entire cellular system holistically, rather than relying on static, simplified pathway maps.
Basic biochemistry concepts, including metabolic pathways, enzymes, substrates, and the central dogma of molecular biology.
An understanding of bioinformatics databases and how biological data (such as gene IDs, proteins, and chemical compounds) is indexed.
Familiarity with enzyme classification systems, particularly Enzyme Commission (EC) numbers and their role in catalyzing biochemical reactions.
A foundational grasp of systems biology, specifically how individual biological components interact within a larger network.
Advanced pathway enrichment analysis (such as GSEA or Over-Representation Analysis) using high-throughput transcriptomics or proteomics data.
Constraint-based reconstruction and analysis (COBRA) and Flux Balance Analysis (FBA) for modeling metabolic networks mathematically.
Applying KEGG pathway insights to computer-aided drug design, including target identification and network pharmacology.
Metagenomic functional profiling, mapping microbiome sequence data to KEGG Orthology (KO) groups to understand community metabolic potential.
251 views5likes4:02@insilicoscholarOriginal Release: 2022-11-15
good morning everyone so in this video today we are going to see cat pathway database so let's get started [Music] [Music] [Music] foreign [Music] foreign [Music] [Music] foreign [Music] [Music] foreign [Music] [Music] [Music] thank you [Music] [Music] foreign [Music] if you like the video please hit the like button and for more information please subscribe our YouTube channel if you have any queries you can ask him in the comment box I will see you in the next video till then goodbye
Up Next

21:10
Bioinformatics KEGG Pathway Visualization in R | RNA-Seq Analysis
@alexsoupir
33.3K views•2020-11-02

12:54
Triumph of Orthodoxy Icon: Byzantine Art & History Explained
@BenCallan
2.1K views•2024-08-06

9:49
FastAPI vs Flask vs Django: Choosing the Right Python Web Framework
@TechWithTim
302.5K views•2024-05-26

1:42
Game of Thrones Opening Credits: A Cinematic Analysis
@gameofthrones
46.3M views•2011-04-18
Related Study Plans & Knowledge Roadmaps
Structured learning paths in General & Interdisciplinary Studies
general-studies
Elevator Engineering: History, Physics & Cities
01From Hoists to Safety Brakes: The Dawn of Vertical Lift
02Hydraulic vs. Traction: The Engineering Physics of Elevators
03Modern Speed, Safety, and Algorithms
+ 2 more learning modules
12h5 modules
Explore Roadmap
general-studies
Rubber: Material Science, History & Geopolitics
01Origins of Natural Rubber & Mesoamerican History
02The Chemistry of Natural Rubber & Vulcanization
03The Geopolitics of the Rubber Boom & Colonization
+ 2 more learning modules
12h5 modules
Explore Roadmap
general-studies
Containerization: Evolution, Logistics & Trade
01Ancient Trade & Bulk Cargo: Amphorae to Barrels
02The Industrial Revolution & Cardboard Packaging
03The Containerization Revolution: Malcom McLean
+ 2 more learning modules
12h5 modules
Explore Roadmap
general-studies
Textile Tech: Evolution, Labor & Global Impact
01Pre-Industrial Textiles: Handloom & Cottage Industry
02Mechanization: The Spinning Jenny to the Power Loom
03The Factory System & Global Labor Transformation
+ 2 more learning modules
10h5 modules
Explore Roadmap