

















This video demonstrates how to visualize KEGG pathways in R using the pathview and gage packages, showing how to analyze differentially expressed genes from DESeq2 objects to identify enriched biological pathways, with a detailed example of the P53 pathway where pathway-level upregulation can occur even when individual P53 gene expression shows conflicting results due to compensatory changes in downstream targets.
Bioinformatics KEGG Pathway Visualization in R | RNA-Seq Analysis
Added:Basic proficiency in R programming, including package installation, data frame manipulation, and loading libraries from Bioconductor.
Fundamentals of RNA-Seq data analysis, specifically how differential expression analysis (using tools like DESeq2 or edgeR) yields log fold changes and adjusted p-values.
Core concepts of biological pathways (e.g., metabolic or signaling pathways) and the hierarchical structure of Gene Ontology (GO) terms.
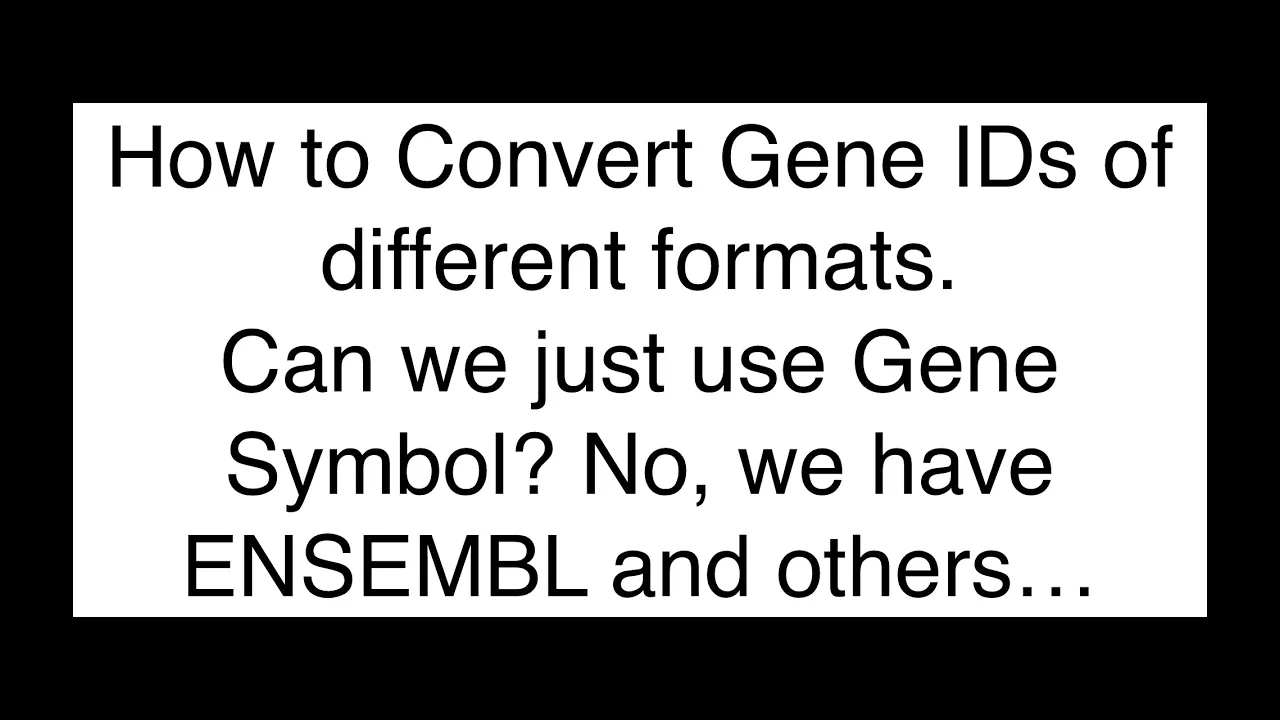
Understanding gene annotation systems and database identifiers (such as Entrez IDs, Ensembl IDs, and Gene Symbols) and the necessity of mapping between them.
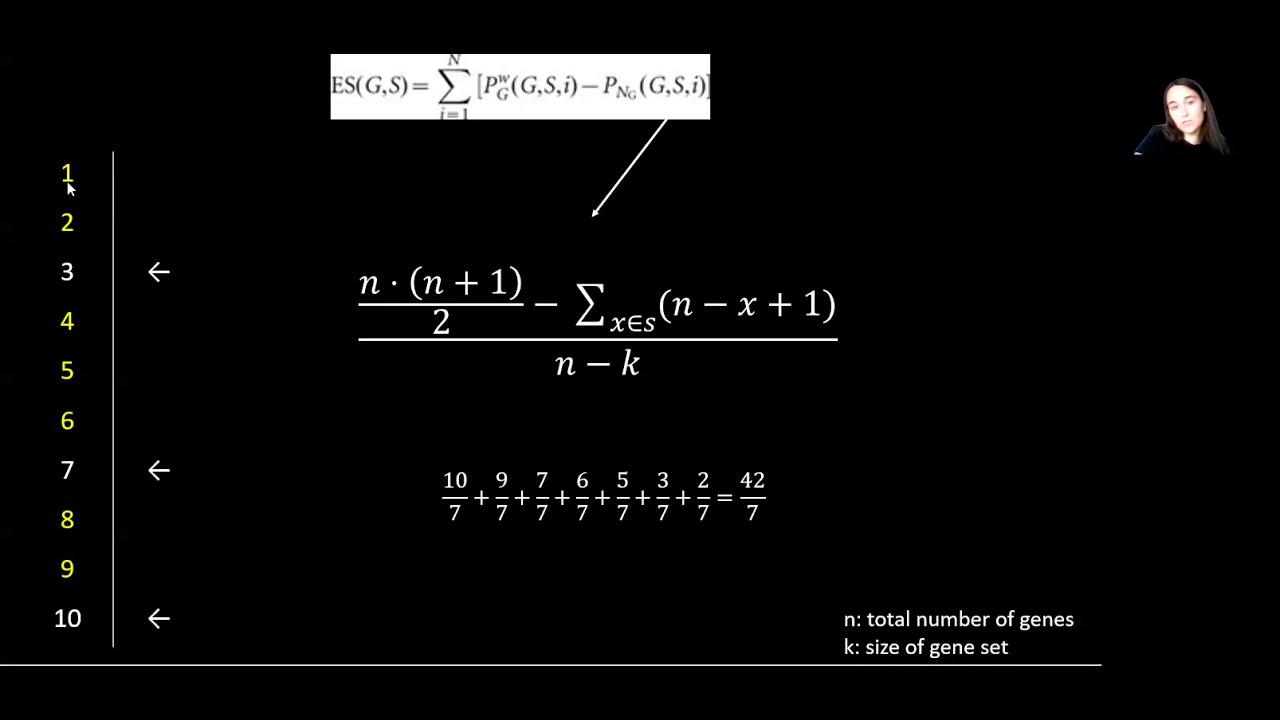
Exploring advanced gene set analysis methods, such as Gene Set Enrichment Analysis (GSEA) and single-sample GSEA (ssGSEA) for heterogeneous datasets.
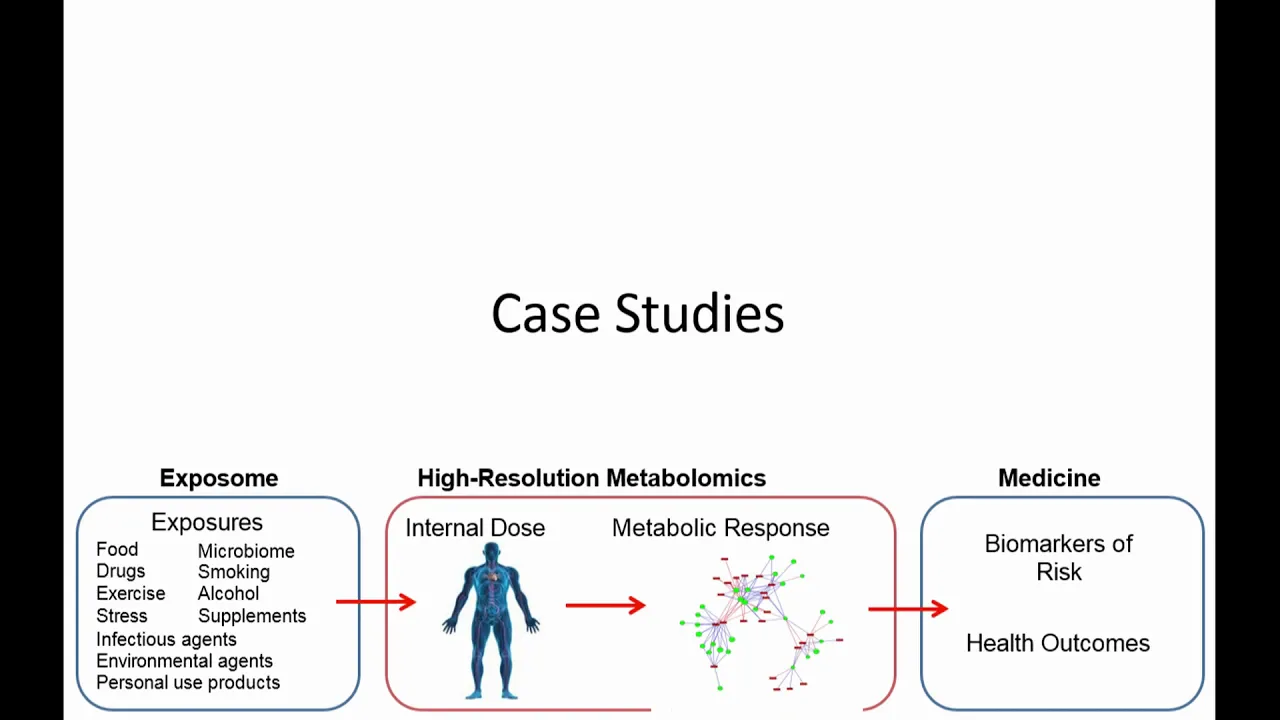
Integrating multi-omics data (e.g., transcriptomics, proteomics, and metabolomics) onto unified KEGG pathways to gain a systems-level view.
Utilizing network analysis and interactive visualization tools like Cytoscape (and the RCy3 package in R) to build custom biological networks.
Translating statistical pathway enrichment results into biological hypotheses and designing downstream wet-lab experiments for target validation.
33.3K views488likes21:10Original Release: 2020-11-02
all right everybody welcome back to another video in the rna sequencing data analysis kind of pipeline here today we're going to work with the go and keg pathways so previously we had gone through cleaning all of the data and then we started looking at the data in r we visualized the count file that we got output from feature counts we went and did differential gene expression we did some gene ontology things which you can see we have left over from last time here and then now today we can go on we can look at the gene ontology pathways with keg pathways and to do this we'll need to import three packages that we installed at the very beginning and that's going to be path view gauge engage data path view will let us view the pathways that we're looking at and then the data that goes along with that so the up and down regulation of particular genes within that pathway and then gage is going to help us with the gene enrichment and the pathway analysis part gauge data is just an additional piece that goes along with gauge and that's got all the other like mapping and just extra stuff to go along with the gauge package so first let's import those three so the library path view library and then gage and finally library very and gauge data we'll run that let's add some blocks here all right now let's make an array for inputting into the gauge function we're going to make an array of our genes log fold change along with the entries id for that particular fold change so this will make more sense when we start looking at it so if we do full changes we want to look at res and inside res we'll do full change all right so if we just look at fold change now it should be an array of just the fold change values it's not going to have any names that go along with it so you can see just a bunch of a bunch of log fold changes we have to map those to the names the entrance id names so we know what we're actually looking at and do that we can do names fold changes so that that array and we want to give it the name of res and then the entries id that we mapped from our column name or refseq ids so we can run that and then if we do a head of our fold changes we can see now that we have our log fold change along with the entrance id now we have to bring in two kind of data sets from the gauge data that are particular to the mouse data that we're looking at and so for that we can do data and then we want go sets and then mm for mouse or mus musculus and then additionally we want to do go.subs.mm we run those and it'll import it over here on the right hand side so we have ghost sets and go subs all right as an example we can take a look at the biological processes you can go through and do this for the other two go terms uh categories as well but we'll just do biological processes here in the mouse data by selecting it out of the imported data that we looked at so if we do go and then we want to look at the biological processes and then sets so this is going to be our gene set which we can use later in the gauge function so then we'll look at go sets dot m m and we want to pull out those which have an id from subs biological processes so we do go subs mm dollar sign and then we can choose biological processes this other component or a molecular function so we'll just do biological process here uh and additionally now we can get our actual results from our go biological processes by doing um go bp and we can just call res like we did with the dc and then we'll use that gauge function now so first so the expressions here is going to be our fold changes and then our g sets our gene sets are going to come from our go bp sets which we just assigned and we'll do g sets equals and then up here we can do great now finally we want to look at the same direction uh so we'll call um same.der and we'll set this equal to true so what that's going to do is it's going to look in the same direction for up or down regulated genes go ahead and run those take a little bit what we can do after keyless is view our go bp results and we can look at greater than so these are all the up regulated ones kind of hard to pull anything out but a lot of morphogenesis um happening let's look at less and see what we get there so we have less messenger rna processing so that can make sense less translation less dna repairs kind of harder to wrap your head around but non-coding rna dna recombination rna splicing some interesting stuff happening so if we go back and clear a lot of this out all right so save now that we have the go part done we can actually look at the keg pathways and for this we need to bring in two more data sets um from the gauge data package and those are keg.sets and then we'll want the most musculus and then additionally we'll do sigma.idx.mm so what the sigmet is is it's basically uh in rename this a smaller subset of the keg sets which is only going to include the signaling and metabolic pathways and for us if we just want to look at that we can do keg sets mm so we'll subset our keg sets based on that segment and then we can do keg sets dot mm so we'll look at the same package but we're only going to pick out those that are in they met index.mn we'll go ahead and run that now we can see that it was successful let's add a couple more here all right now we can calculate the keg results like we did with the go up above so instead of using um here g sets so the gene sets of the go bp we can look at this new keg sets that we made so we can call this keg results and then we'll set that equal to gauge and we'll look at fold changes again and then for g sets instead of go b p sets let's look at our keg sets dot m m and then we'll do the same as before we'll look at same dot direction so we'll look at the up and down regulating true okay let's open up the console again down here just like we did before we can go ahead and view our keg res and we can look at greater than and less than oh view all right so these are up regulated and you can see that we have the hedgehog pathway so that is going to be something that is attributed to if there is abnormal hedgehog signaling happening a lot of times that can lead to the proliferation of cancers like pancreatic lung etc now that that's going to happen here if left undone are left unchecked because of the p53 but that is of note uh what else do we see in here there is p53 signaling pathway that is up regulated we'll get to this in a little bit because there's something interesting happening uh happening here um but yeah so that's pretty pretty noteworthy those two let's look at less than and see what we get all right so we have less dna replication cellular cycle is down ribosome is down rna polymerase is down so that's also also interesting you can dive further into that if one of you can google uh like the mmu or the the whole name and it should give you a deeper explanation as to what exactly each one is now that that is done we can pull up the actual pathways and start plotting them and then we'll get some really cool pictures and to do this we need we won't need to but we'll use some tidy piping and we'll select just the top handful of jeans and then produce some some plots there too so to do this we'll do kegres pathways equals data.frame and then the id that we're going to pass in is going to be our kegres row names so if we go back here well what we're gonna do basically is create a list that just has the row names in them and then we need to subset out this mmu and then the five numbers so we're gonna pick the first eight characters that are in the names here and that's gonna be the id that we can pull or put into uh the plotting path view so the id is gonna equal the row names of kegres and then we can do we'll do greater than and then kegres will just depend on all of the data for the last part less ah greater greater okay and then tidy can pipe so we're gonna create that data frame and then we're going to do tibble as tibble so this is just something for uh tidy and then we can filter so what we're going to do now is we're just going to look at the top however many genes that show up in that table so you can see here we have 177 entries we can just pick the top i don't know five or so so if we do filter and then row number uh less than or equal to five we'll just look at the top five now let's look at 20.
okay so then we're gonna pipe that and we want just the id so if you look here we just want this this name in that list which is made here so do dot dollar sign id delete that one and then we can pipe this to as dot character so we just want this list to be of of characters and go ahead and run that oh i spelled it tibble wrong there we go and then we can just look at it so let's look at the first or however many so there's 20. we do cag res pathways and there we are so we have the first 20 so we have p53 here we can look at that so dive deeper into that one and then hedgehog signaling's in here we've got the top 20 results in order to get the particular ids like i was mentioning these first eight characters we'll have to um basically create a substring of these names here and to do that it's pretty easy you do keg res ids so these are just going to be the actual keg pathway ids and then we want to find the substring of keg res pathways we'll start at the first character so in r the first character is a one if we were in python this would be zero and then stop will be at eight and then let's print this out too so we can see what our new ids look like whoops there we go so now we have just the first eight characters for each one of these awesome okay now we can actually go ahead and plot them so we can do tmp s apply and then we'll look at the keg ids kegrez ids and then we need to write a little function so pid path view gene so we need to look at the gene data and that's going to be our fold changes so it's going to tell path view what to actually color our different genes within the path within the the plot so we'll do fold changes and then our pathway id is going to be what's passed in so we're going to pass in our keg res so pid is just the function variable so you can type pid here again and then we need to specify what species this is in well since we're working with mouse and the first three characters here are mmu we'll do species equals mmu and then if we run that it'll take a little bit but it's going to go ahead and it's going to build some plots and if we go uh files you can see possibly it puts them in here there we go got some changes happening and then we can pick out which ones we want to look at so let's look at this mmu04115 let's look at the p53 pathway um one one five so something that i noticed instantly when i opened this up is that there is a lot that is up regulated so the whole pathway is potentially upregulated but p53 itself is actually showing a decrease and i looked at the the results table with the log full change and log full change is actually negative which then got me also looking at um like what's actually happening there so everything else but p23 is being up regulated uh but p53 between the two it it's really kind of messy with your head but let's just look at it to get an idea of how to explain it so look at dds and then the gene i already know what the gene name and the results are in the dds is so that's going to be our refseq id that originally came with the data so let's nm underscore zero zero one one two seven two three three dot one and then int group so this is basically what we're going to split our data by when we're going to plot it and this has to be based on our column names so call data we have to pick something out of here and we're going to look at p53 and treatment so if we do p 53 and then we also want to look at treatment so it's going to basically parse this out into four different groups that will that we'll see all right so let me move this over so the reason why it's negative fold change even though in both the positive samples there seem to be a higher p53 even though in minus it should have been knocked out uh is that because it's positive in both uh here and the difference here is smaller than the difference here in the p53 minus samples there is actually a greater change than in the p53 positive so that's why when we look at the log fold change of results so if we look at um view every time view as data frame and then we'll get res we can search in here for trp 53 and this guy we see that there's actually a negative log-fold change and a pretty significant p-value i mean not incredibly significant but it is significant normally but not when it's corrected so that could also be something this isn't significant uh but that's why when we look at that image i got to pull it up again here we go p53 is negative although uh everything else is positive so there's one thing to just look at the data but you got to kind of dive into it to get a better understanding of what's actually happening so this is an explanation as to why p23 in that picture is down even though we have higher levels so yeah that should do it for the keg pathway oh i closed it let's open it up again that should do it for the keg pathway uh analysis part of it that should be it for the rna sequencing as far as with the pipeline that we've been working with so yeah if you guys found any of these videos helpful hit the thumbs up that will kind of give me a gauge as to if i need to do more of the r videos or if i should do more of the explaining the tools i know the traumatic video has had a lot of interest as well as the multi qc and the fast or the fast qc video otherwise feel free to subscribe that'll kind of tell me how many people find them helpful and not just what exactly is helpful but yeah thanks for your time guys
Up Next

20:59
Cas9 Plasmid Construction via Oligo Annealing Cloning – Step-by-Step Guide
@jakelmer1985
30.6K views•2019-08-29

12:54
Triumph of Orthodoxy Icon: Byzantine Art & History Explained
@BenCallan
2.1K views•2024-08-06

9:49
FastAPI vs Flask vs Django: Choosing the Right Python Web Framework
@TechWithTim
302.5K views•2024-05-26

1:42
Game of Thrones Opening Credits: A Cinematic Analysis
@gameofthrones
46.3M views•2011-04-18
Related Study Plans & Knowledge Roadmaps
Structured learning paths in General & Interdisciplinary Studies
general-studies
Elevator Engineering: History, Physics & Cities
01From Hoists to Safety Brakes: The Dawn of Vertical Lift
02Hydraulic vs. Traction: The Engineering Physics of Elevators
03Modern Speed, Safety, and Algorithms
+ 2 more learning modules
12h5 modules
Explore Roadmap
general-studies
Rubber: Material Science, History & Geopolitics
01Origins of Natural Rubber & Mesoamerican History
02The Chemistry of Natural Rubber & Vulcanization
03The Geopolitics of the Rubber Boom & Colonization
+ 2 more learning modules
12h5 modules
Explore Roadmap
general-studies
Containerization: Evolution, Logistics & Trade
01Ancient Trade & Bulk Cargo: Amphorae to Barrels
02The Industrial Revolution & Cardboard Packaging
03The Containerization Revolution: Malcom McLean
+ 2 more learning modules
12h5 modules
Explore Roadmap
general-studies
Textile Tech: Evolution, Labor & Global Impact
01Pre-Industrial Textiles: Handloom & Cottage Industry
02Mechanization: The Spinning Jenny to the Power Loom
03The Factory System & Global Labor Transformation
+ 2 more learning modules
10h5 modules
Explore Roadmap