

![Cardiologie [Conférence] - DCEM2 - Part 1](https://i.ytimg.com/vi_webp/y9MN6eLJWlI/maxresdefault.webp)










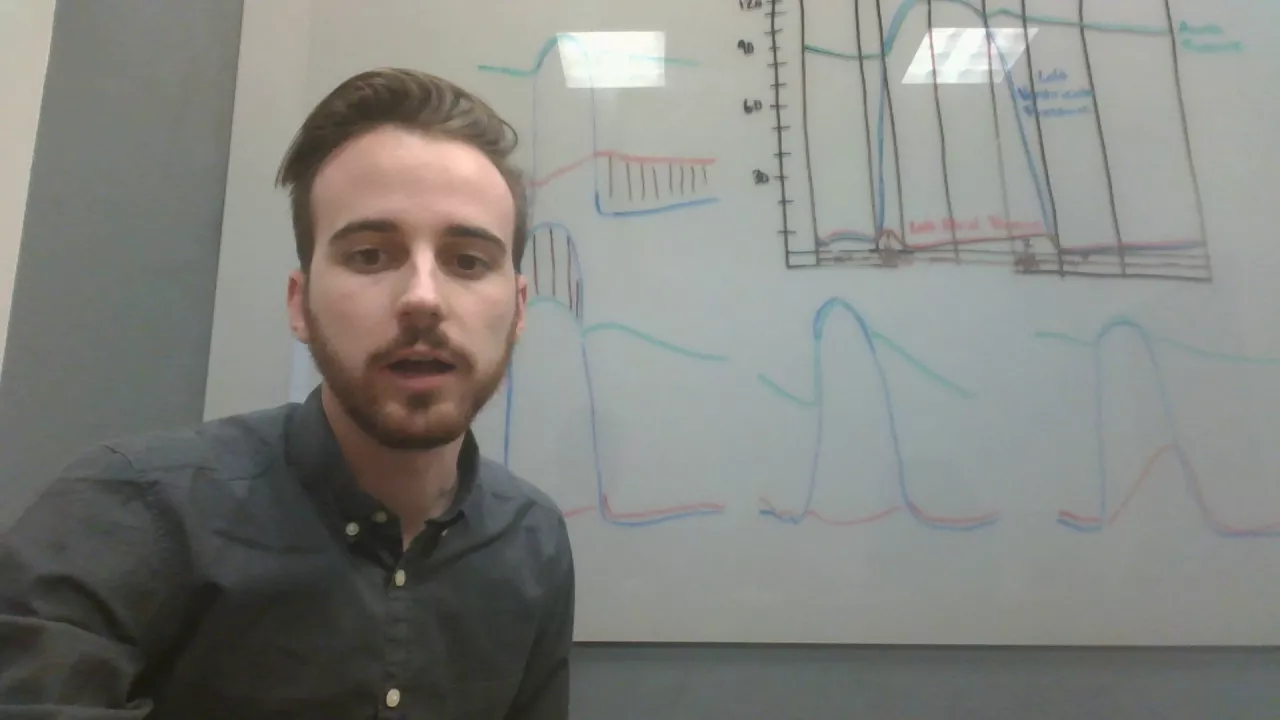










The Wiggers Diagram is a graphical representation of the cardiac cycle that plots time on the x-axis against pressure and volume on the y-axis, showing the relationship between ventricular volume, ventricular pressure, atrial pressure, and aortic pressure throughout the cardiac cycle. The diagram illustrates that diastole (ventricular filling) involves open AV valves and closed semilunar valves, while systole (ventricular contraction) involves closed AV valves and open semilunar valves. The ventricular pressure curve shows three phases of systole (isovolumic contraction, rapid ejection, reduced ejection) and three phases of diastole (isovolumic relaxation, rapid filling, diastasis). The atrial pressure curve displays characteristic waves (a, c, x, v) corresponding to atrial contraction, ventricular bulging, valve displacement, and venous filling. The aortic pressure curve includes the dicrotic notch caused by aortic valve closure. Heart sounds (S1, S2, S3, S4) correspond to specific valve closures and filling phases, with S1 marking the start of systole (AV valve closure), S2 marking the start of diastole (aortic valve closure), S3 associated with rapid filling, and S4 associated with atrial contraction against a hypertrophied ventricle.
Wiggers Diagram Explained: Cardiac Cycle Masterclass
Added:[Music] foreign [Music] welcome back everyone in this video we will be talking about the wigger diagram this is a very useful graph that depicts the cardiac cycle the diagram has time on the x-axis and pressure and volume on the y at the bottom you can see which heart sounds correspond to the different phases of the cardiac cycle which i'll discuss later you also see at which points the ekg waves correspond with which part of the cardiac cycle i'd recommend watching a video on ekg because i'm not going to go into too many details but i will review some of the basic waveforms next we have the curve for ventricular volume ventricular pressure atrial pressure and aortic pressure let's first review some basic cardiac physiology so we know that the heart has four chambers and you have kind of two phases which are called diastole and systole so let's discuss diastole first in diastole this is when the blood when the ventricles are being filled with blood from your body so your av valves are open which are your tricuspid on the right and the mitral on the left and basically in this phase these valves are open your semilunar valves are closed that's your pulmonic and your aortic valve so these are closed and what happens is blood goes from the atria to the ventricles in systole the opposite is true so in systole you have the semilunar valves are open so again your pulmonic your aortic are open and then your av valves are closed and so what happens in this phase is the ventricles contract and they push the blood into your pulmonary artery and into the aorta to the body [Music] now just for some basic ekg review we have our p wave this represents atrial depolarization after the p wave the atria contract and that's atrial systole the qrs corresponds to ventricular depolarization so this is when the ventricles get their signals they depolarize and after that they contract and so ventricular systole starts after the qrs then you have your t wave and the t wave represents ventricular repolarization and after the t wave is when ventricular diastole starts and the ventricles relax i would just like to note that the wiggle diagram that i'm discussing today represents the left side of the heart it's very similar for the right it's just the pressures are different because the right side of the heart operates at lower pressure so let's start with our ventricular volume curve you can see in systole here that again remember is when the heart is pushing the blood to the body and because the ventricles are emptying at this point the volume goes down in diastole the ventricles are now um being filled with blood from the atria and volume goes up next let's look at our ventricular pressure curve let's start with systole systole has three phases which the first of which is our isovolumic contraction phase it occurs between this two lines here the dotted and that solid line you can see here the pressure in the isovalemic contraction phase is rising however the volume stays the same and that is because the mitral valve and the aortic valve are both closed so the blood's kind of just chilling in those ventricles and the volume is not changing what happens is eventually the pressure in the ventricles builds up enough to where our aortic valve opens the ventricular and then we have our second phase which is our rapid ejection phase so here the ventricular pressure is above the aortic pressure and you have our rapid ejection phase where the blood is pumped into the aorta next as the ventricles keep pumping blood to the aorta the pressure kind of falls and at this point as the pressure falls it's continuing to pump blood to the aorta due to the inertia that's created from the contraction of the ventricles and so eventually the ventricular pressure falls enough to where our aortic valve closes and our ventricular pressure curve here is below that aortic pressure curve and we have our before that we have our reduced um ejection phase so we have the iso limit contraction the rapid ejection phase and then there's a reduced ejection phase which is the third phase of systole and that corresponds with the t wave in the ekg so which makes sense because the t wave after the t wave we know we have ventricular diastole and after the reduced ejection phase we have ventricular diastole because the aortic valve closes next let's talk about diastole diastole also has three phases the first of which is our isovolumic relaxation phase so similar to the isolimit contraction volume here is not changing however the pressure is going down now because the ventricles have pumped their blood out and now that pressure is decreasing and again both your aortic valve are closed in this phase and our mitral valve valve is also closed so because they're closed the ventricles again are just kind of chilling in that little phase and eventually the ventricular pressure falls below the atrial diastolic pressure over here you can see the pressure curve falls below this atrial pressure curve and that triggers open our mitral valve and the second phase of diastole occurs which is our rapid filling phase so in the rapid filling phase as you can guess the ventricle the ventricles rapidly fill with blood and then they you have the third phase which is diastasis and this is that um similar to the rapid ejection after the rapid filling you have a slowdown of how much blood is being filled into the ventricles so that just occurs and that's called diastasis and that corresponds with that ends with the p wave of the next cycle as you can see and remember that makes sense because diastasis again is that reduced filling symmetricals are filling with blood and then that p wave happens that signals atrial depolarization and then you have this extra little uh amount of fluid that the atria is pushing into the ventricles so we'll talk about that on our next slide [Music] all right so we have our atrial pressure curve now the first wave that we see here is our a wave and you can see it occurs after our p wave our p wave in the ekg so what happens again with the p wave is the it represents atrial depolarization the a wave represents atrial contraction and this contraction of the atria pumps about 10 milliliters of blood to the ventricular volume in ventricular diastole so the atria contract and they pump blood into the ventricles just a small amount of blood and that shows up as the a wave next we have our c wave and you can see this comes after the qrs in the ekg so qrs again represents ventricular depolarization and what the c wave is is because the ventricles are contracting it kind of bulges the av valve up into the atria and it increases its pressure slightly which comes through as the c wave after the c wave we have this kind of um slope here called the x ascent and this just represents the downward displacement of the closed av valve during rapid ventricular ejection phase so the atrial just kind of relaxes a little bit and then you have this v wave here and before you get that v wave you can see the pressure slowly increasing and that is because the atria is getting blood from the pulmonary veins so as the atria is filling with blood the pressure is increasing and you eventually get this v wave after the v wave you have a wide descent and that just represents the atria emptying into the ventricles which decreases atrial pressure [Music] lastly we have our aortic pressure curve so as we saw here the aortic pressure is below the ventricular pressure curve in that rapid in that um rapid ejection phase where the ventricles are pushing blood out to the aorta and then eventually the aortic pressure again goes above the ventricular pressure and the aortic valve closes you can see this little bump here that is called the diacronic notch or into syria and that is caused by a slight backflow of aortic blood that fills the cusps of the aortic valve as it closes at the end of ventricular systole so it's just the valve as it closes there's a little bit of blood that fills those cusps at the end of ventricular systole and also i'd like you to note that the aortic pressure curve you can see doesn't go below 80. and that's because of the the structure of our arteries that allows us to maintain our blood pressure so it doesn't fall below 80.
last i'll just briefly talk about the heart sounds so if we look down here we have our first heart sound which is s1 and that corresponds with the closure of the av valve which signals the start of systole sorry i circled the aortic valve i meant to circle the av valve the mitral valve so that valve closing is the sound of s1 and that signals start of systole and then we have s2 which corresponds with the closure of the aortic valve so at the end of ventricular systole when the aortic valve closes you hear s2 and that signifies diastole starting the s3 gallop corresponds to the rapid filling phase in early ventricular diastole and this can be physiologic so it can be normal in kids in pregnancy and so again that represents the rapid filling phase in early ventricular diastole there's a fourth sound called an s4 gallop and this isn't on the diagram because it's an abnormal sound and it is associated when the atria contract against a hypertrophy ventricle at the end of ventricular diastole so basically um if the if someone has high blood pressure for example the left ventricle hypertrophies and the s4 gallop is heard at the um at in atrial systole when the atrias pump that last 10 ml milliliters of blood into the ventricles when they contract and that blood hits the wall of the ventricle of that hyper hypertrophy ventricle you hear an s4 gallop and that is all i have for today i hope this video was helpful and that it made the wicker diagram a little bit more digestible and easier to understand thank you for watching the video and have a good day bye [Music] [Music] you
Up Next

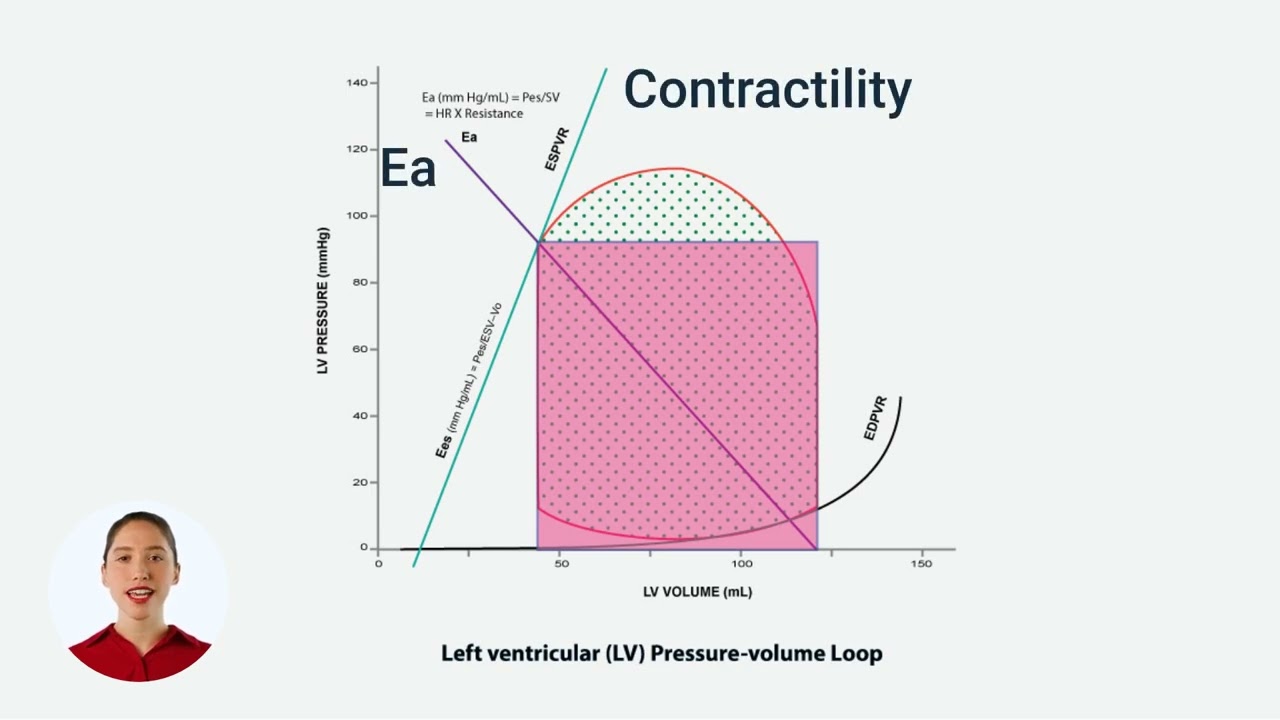
PV Loops Explained: Contractility, Ea, and Preload Effects
@khanacademymedicine
40.5K views•2012-11-28

Graphic Medicine: Comics for Collaborative Healthcare Communication
@nationalpatientadvocate
189 views•2023-12-04

Neuroanatomy: Central and Peripheral Nervous System Divisions Explained
@AKLECTURES
136.2K views•2014-09-20
Stages of Labor and Vaginal Birth | Childbirth Animation
@nucleusmedicalmedia
52.1M views•2017-08-18
Related Study Plans & Knowledge Roadmaps
Structured learning paths in Medicine