













![[Week 07 lec 03] Particle Image Velocimetry](https://i.ytimg.com/vi_webp/M21PQ52q_oc/maxresdefault.webp)





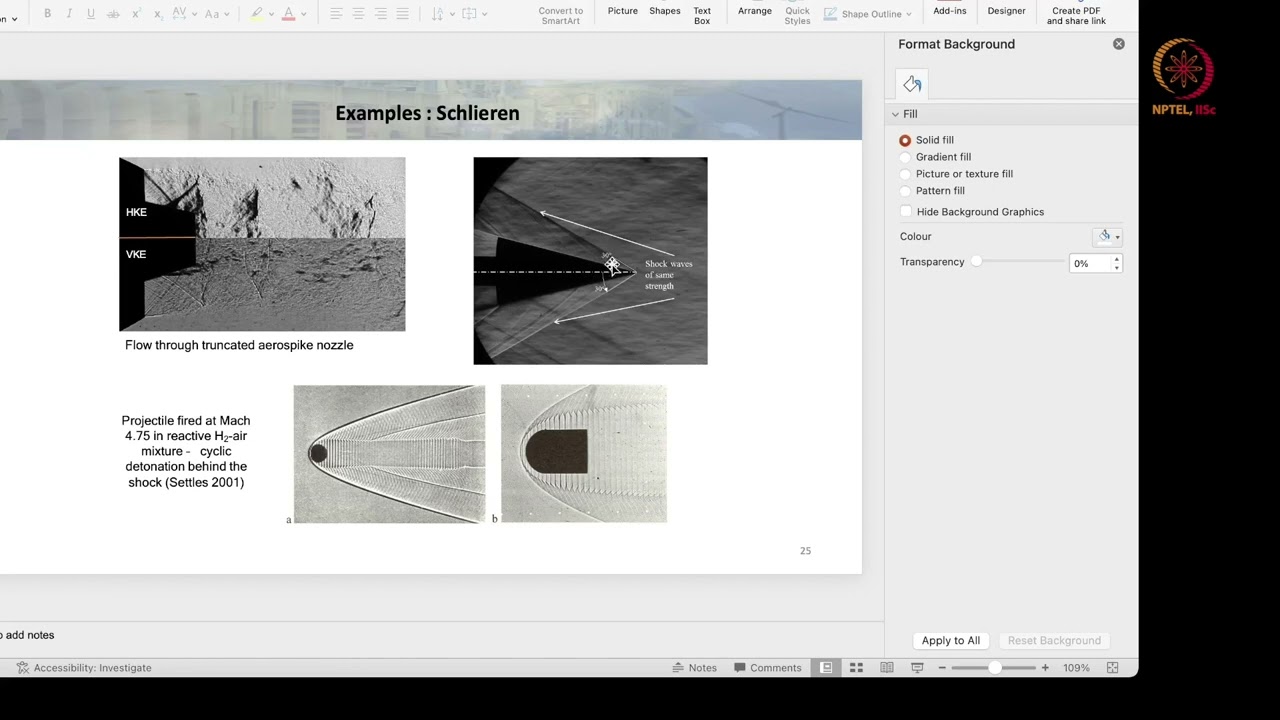

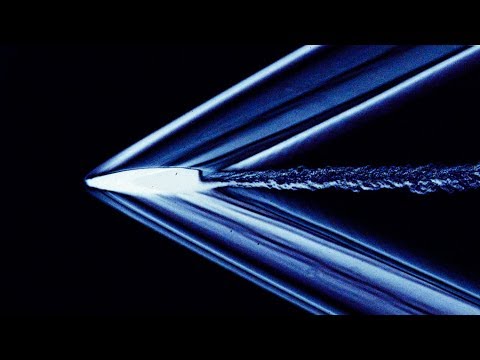
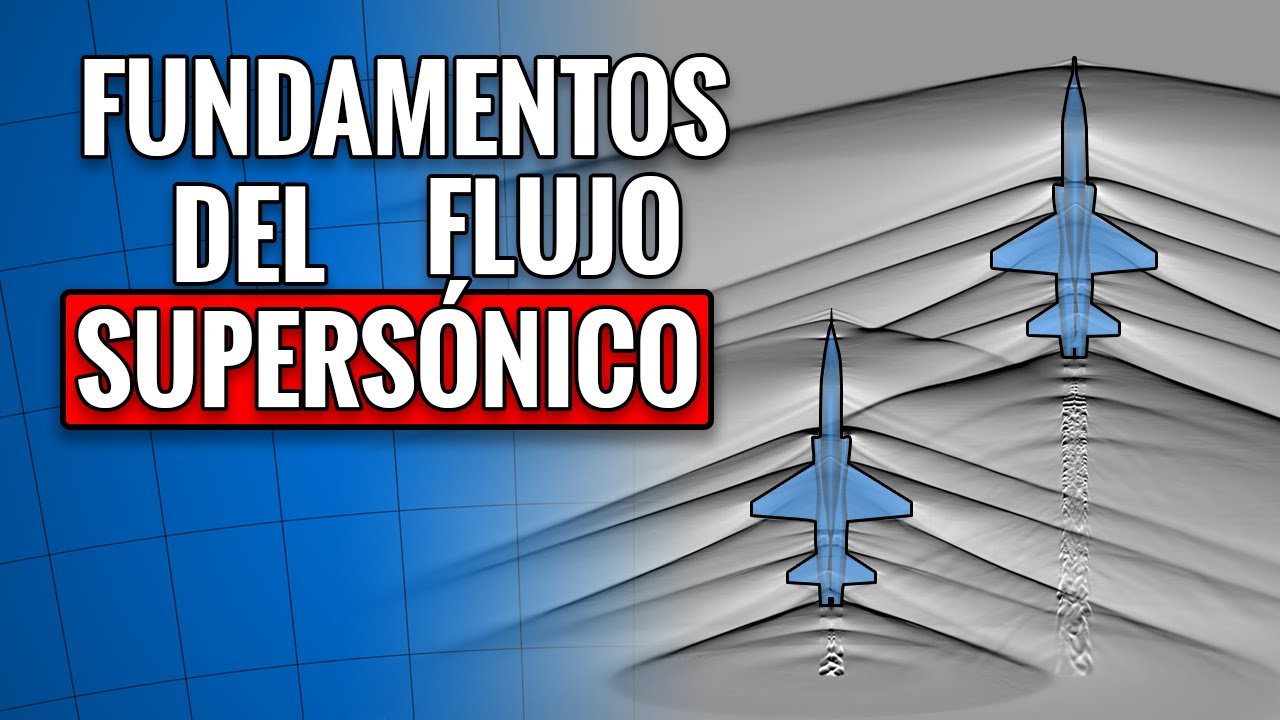
Schlieren imaging systems make invisible density variations in fluids visible by exploiting the fact that light travels at different speeds through media of different densities; these systems use optical setups to reveal shock waves, wakes, and other flow phenomena that are otherwise imperceptible to the naked eye, with applications ranging from supersonic aerodynamics to everyday phenomena like opening fizzy drinks or popping balloons.
Schlieren Imaging Systems for Flow Visualization | UNSW Canberra
Added:The concept of refractive index and Snell's Law of refraction, which explains how light bends when traveling through media of varying densities.
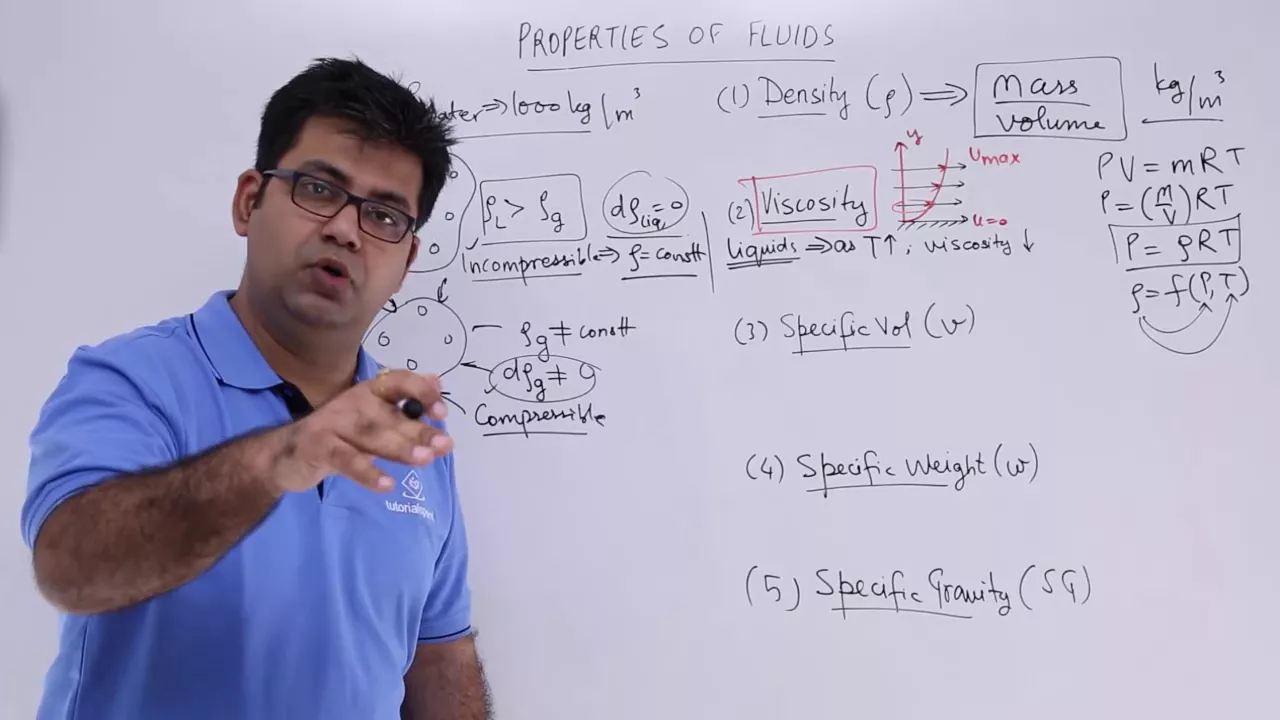
Basic fluid mechanics, specifically how temperature and pressure variations alter fluid density (such as the Ideal Gas Law).
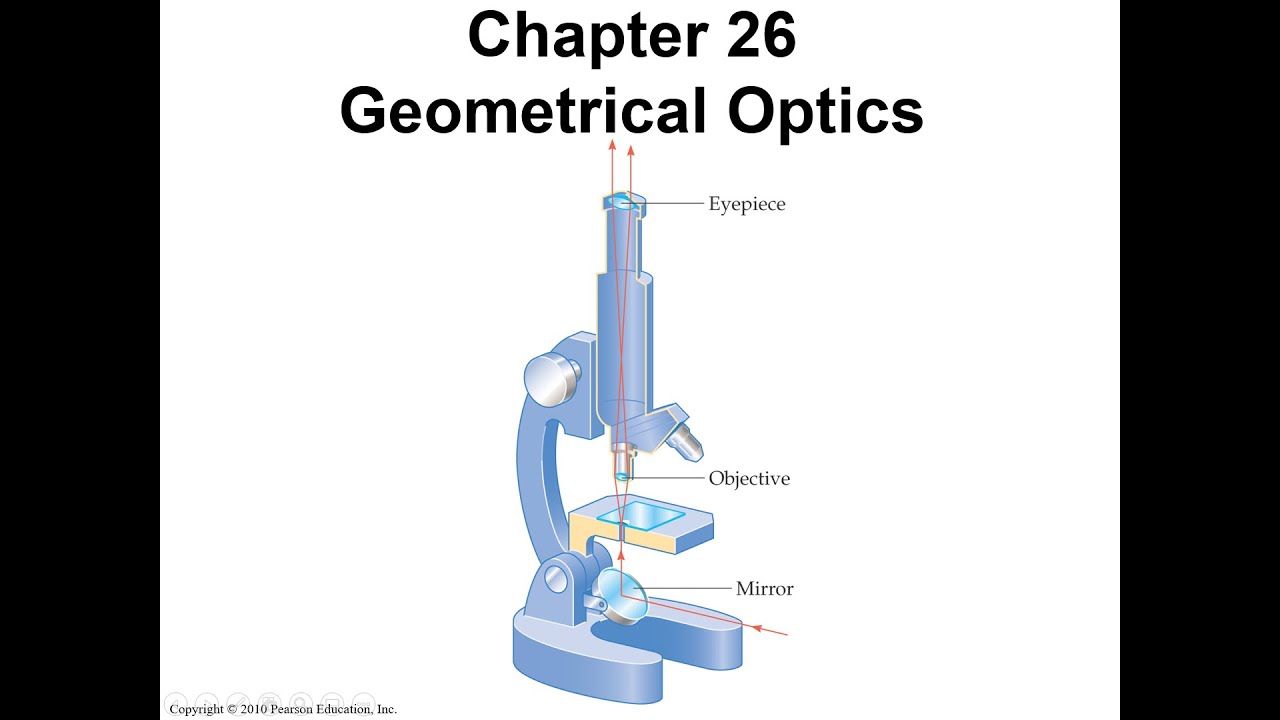
Fundamentals of geometric optics, including collimated light, focal points, and the behavior of lenses and concave mirrors.
An introductory understanding of compressible flow, subsonic versus supersonic speeds, and shock wave formation.
Quantitative Schlieren techniques, such as Background Oriented Schlieren (BOS), which allow researchers to extract numerical density data from images.
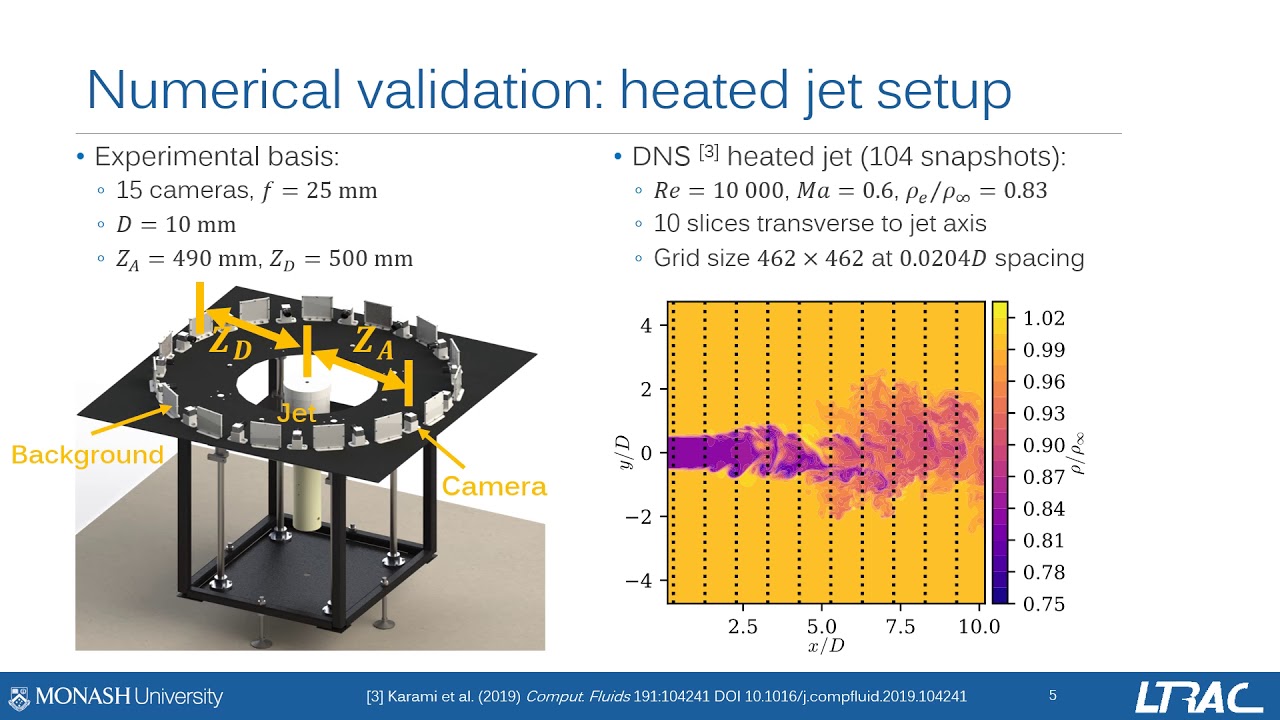
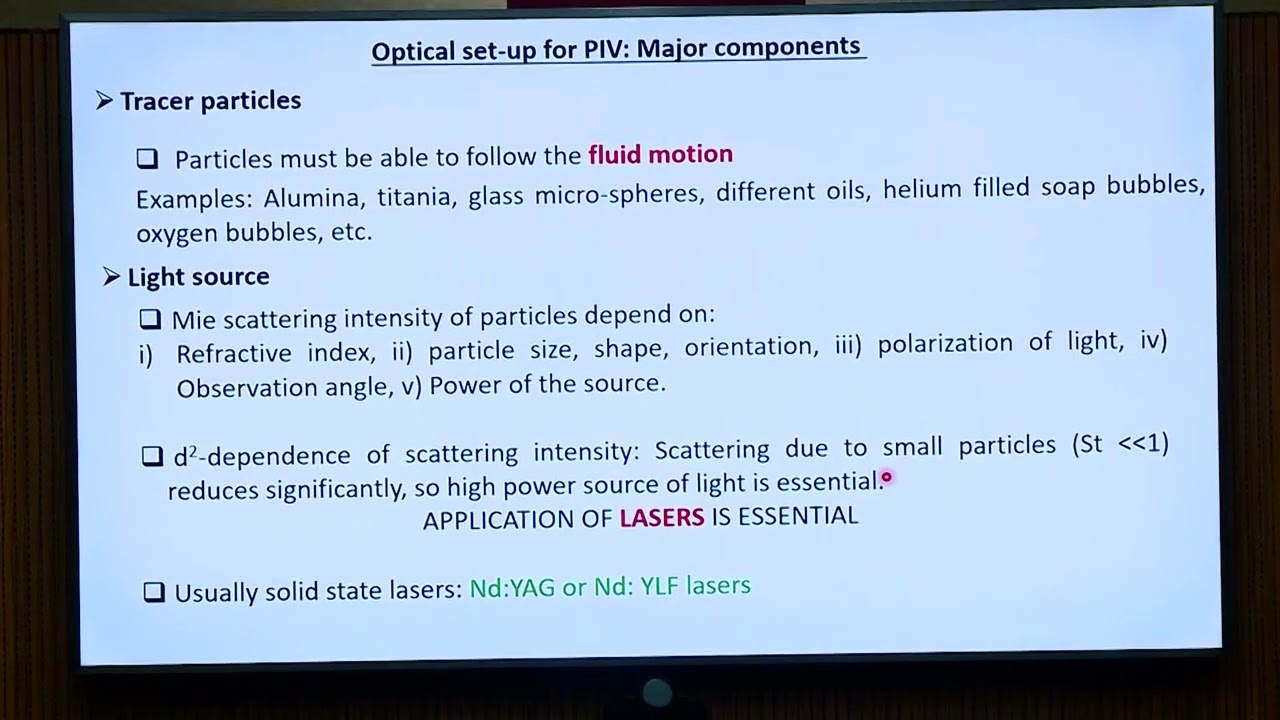
Advanced non-intrusive optical diagnostic methods in fluid dynamics, including Particle Image Velocimetry (PIV) and Laser-Induced Fluorescence (LIF).
The integration of flow visualization data to validate and refine Computational Fluid Dynamics (CFD) simulations.
Practical design, calibration, and alignment of Z-type Schlieren optical setups for aerospace and wind tunnel testing.
44.8K views1.2Klikes6:36Original Release: 2020-05-08
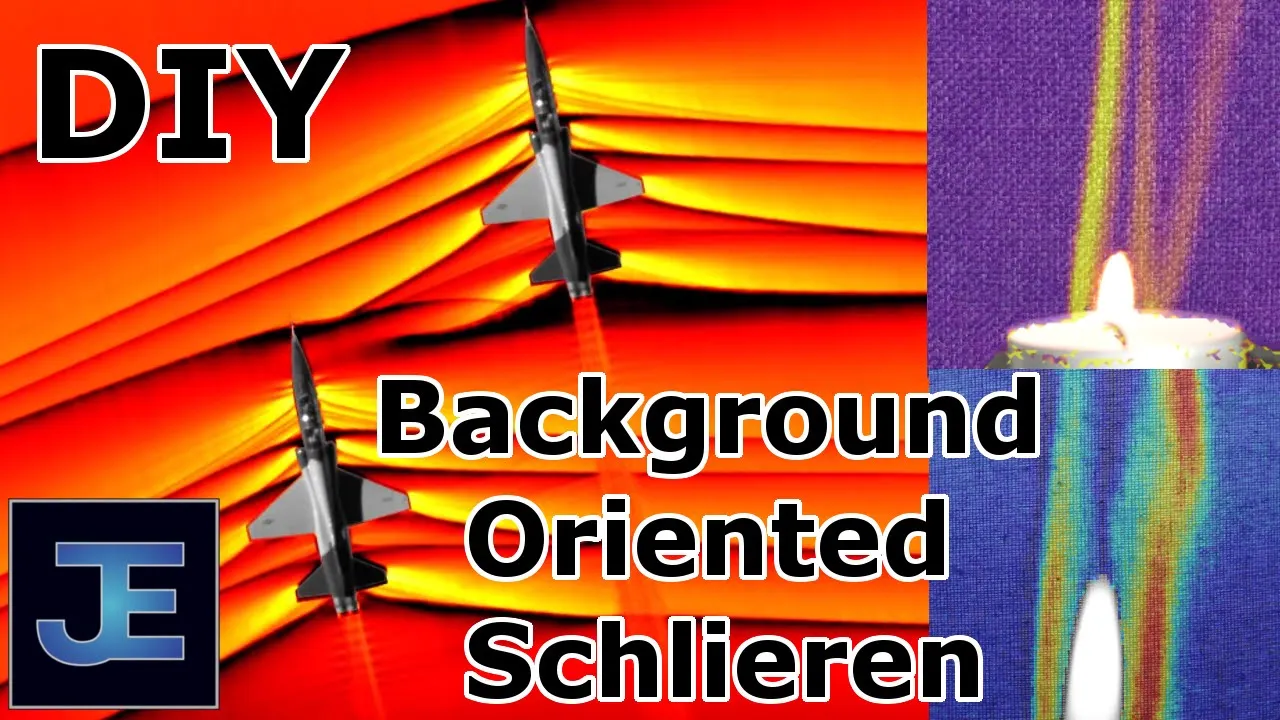
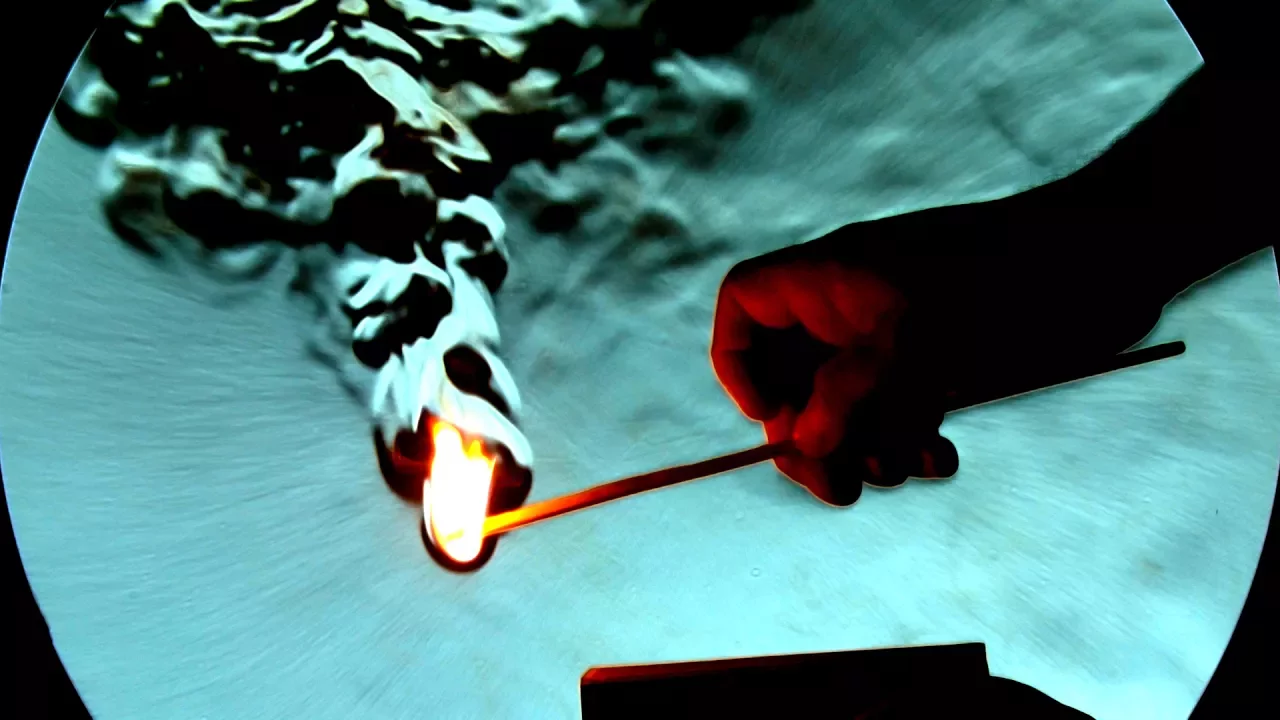
[Music] my name is Hera Klein and I'm an associate professor at the School of Engineering and IT at unis W in Canberra one of the main areas of my research is to make invisible otherwise invisible flows visible and to do that I design and build optical setups that can make those flows visible the principle behind that these setups has been actually known for a long time and that is that the speed of light depends on the density of the medium that this light propagates through this transparent object could be the hot air the plume above a lighter it could also be the warm air above your hand or it could be a seed of gas thickness of this glass is by no means constant but it's actually quite a few ripples in this a lot of laboratories all over the world have such visualization systems and even our campus here has already three of them one of them is the setup that you can see here that's in the supersonic tunnel lab and we use this to make supersonic flows and flows in a shock tube visible another set up is used at the hypersonic shop tunnel and the third one with a laser spot facility each of these systems look they don't look different but they are all really based on the same design principles the setup we have here in the supersonic lab has evolved over many years into what it is right now and it allows us to change between different methods without too much change of any hardware and we can also use two methods or possibly three at the same time to visualize the same flow this clip here shows the difference between looking at an object through with the naked eye or through a schlieren system what you see here is a bullet that flies from the right to the left and what you see here on this side is just the bullet but once it enters the visualization system you will also see the wake and the leading shockwave both the wake and the shockwaves are exist they exist here as well but here on this side you can't see them most research applications in which such a system is being used involves some sort of a high-speed tunnel because high speed flows are a prime example of those object transport objects that change density but you can also use this for other and probably even more every date life type examples this year for example is the the gas that sort of comes out of a fizzy drink bottle once you open it you could also watch a popping balloon and see how the gas inside the balloon stays for a while while the shell of the balloon is actually shrinking at a much faster pace in wind tunnels we can use those optical systems to investigate the aerodynamics of flying objects and one of the liberties we have is that we don't have to restrict this to existing aircraft but we could also look at flying machines from fiction if only to see if they could actually fly one of the applications where the visualization is almost your only instrument in understanding the physics of a flow is shown here this is a shock wave that comes from the left of the right and that is reflected by this shape over here and this reflected wave focuses somewhere here concentrating most of the energy that the shock had at its original in its original state in a very small area one of the questions is how efficient is this focusing in fact this interesting figure that you see over here is that this particular reflector is not very efficient because in an efficient reflector that would have been just a single spot and not too many of these other disturbances over there this is one way to use such an optical system to find out whether a particular physical process can be run in an efficient way in a different application we can also make visible the loading that a structure would be exposed to when it is hit by a blast wave so we have here from the left a shock wave that runs passes over a pillar and the pillar is located in front of the wall so the shock wave will first negotiate the pillar and then be reflected from the wall and all of those the colors that you see here can be directly related to a value of density and if you evaluate this you will find out that the biggest load on the pillar actually comes from wave that is rebounding that is coming back from the wall and methods like this are standard in standard ways used in situations where you want to see how shock waves or blast waves propagate around obstacles another thing that one can answer with the help of visualization is that in the case of an explosion what comes at you first is it the blast wave or are those possibly the fragments of the container that have healthy explosive it possibly slightly unsatisfying answer is that it depends it's not a clear-cut answer it depends on the explosive and on the fragments in this particular case here we had the fragments clearly outrunning the explosive whether the blast wave of the explosion in this case on the other hand we would concede here's our blast wave and there is a particle that actually penetrates the blast wave and that is part of the threat the fragment that sort of is there before the blast front arrives on the other hand further down here is a particle that just tries to penetrate the last one but doesn't succeed so in this case for that part the blast front gets up is there faster and that depends on the shape and on the drag that the the Ragman is being is generating and of course on the the local speed of the blast wave so that's just another example of what you could probably not find out with a technique other than a high speed visualization as the one shown here one of the most thrilling and rewarding aspects of this work is that you get to see something that is normally invisible and that nobody else has seen before you that is to this very day extremely fascinating and also can be a lot of fun you
Up Next
6:32
Schlieren Imaging: How to See Air Currents and Temperature Gradients
@veritasium
1.6M views•2017-06-15

12:53
21cm Hyperfine Transition in Neutral Hydrogen: Radio Astronomy Basics
@AaronRobertParsons
12.4K views•2011-10-13

32:32
NMR Spin Physics I: Zeeman Effect, Resonance Condition & Larmor Frequency
@nptel-indianinstituteofsci8064
2.3K views•2024-01-17

27:14
Entropy and the Second Law of Thermodynamics Explained
@veritasium
27.5M views•2023-07-01
Related Study Plans & Knowledge Roadmaps
Structured learning paths in Physics
physics
Nuclear Physics (Decay, Fission & Reactors)
01Atomic Structure and the Binding Force
02Radioactive Decay and Half-Life
03Nuclear Fission Mechanics and Chain Reactions
+ 2 more learning modules
12h5 modules
Explore Roadmap
physics
Soft Matter (Polymers, Colloids & Rheology)
01Foundations of Soft Matter & Thermal Forces
02Polymer Physics and Macromolecules
03Colloids, Surfactants, and Self-Assembly
+ 2 more learning modules
38h5 modules
Explore Roadmap
physics
Analytical Mechanics: Lagrangian & Hamiltonian
01Mathematical Foundations: Calculus of Variations
02From Newtonian Mechanics to Constraint Dynamics
03The Principle of Least Action & Lagrangian Mechanics
+ 3 more learning modules
28h6 modules
Explore Roadmap
physics
General Relativity (Spacetime & Cosmology)
01Foundations of Relativity: Special Relativity
02The Geometry of Spacetime: Equivalence Principle & Curvature
03Einstein's Field Equations: The Mathematics of Gravity
+ 2 more learning modules
55h5 modules
Explore Roadmap