







![[AIC2021 Day 1-1J] Aquaphotomics Workshop (日本語 Japanese)](https://i.ytimg.com/vi/HxHEN_8NSHE/maxresdefault.jpg)
![[AIC2021 Day 1-1E] Aquaphotomics Workshop (English)](https://i.ytimg.com/vi/mmUUef5BP8Q/maxresdefault.jpg)


![[Unknown Spectrography film]](https://i.ytimg.com/vi/aFkbQZ4FQso/sddefault.jpg?sqp=-oaymwEmCIAFEOAD8quKqQMa8AEB-AH-BIAC4AOKAgwIABABGGUgRig_MA8=&rs=AOn4CLAsTQxWlLzTmiuHKud1x8ORnNUqlw)


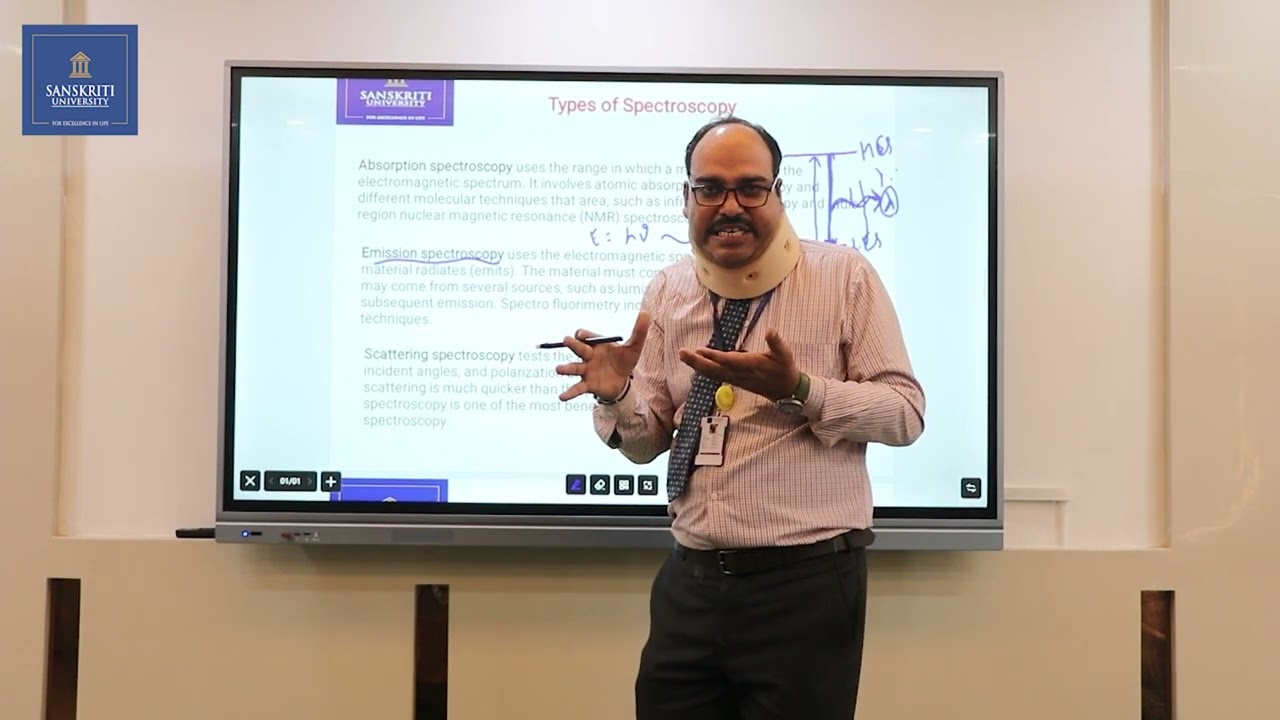
This video demonstrates how to generate a spectrum from a spectrometer image using MATLAB by applying previously calculated calibration parameters (pixel ratio and distance to left edge) to measure intensity versus wavelength, where students draw a horizontal line across the image to extract spectral data and save the resulting plot in various image formats for analysis.
MATLAB Spectrometer Spectrum Generation Tutorial | Engineering Lab
Added:Basic MATLAB programming, including matrix manipulation, array indexing, and generating 2D plots.
Fundamentals of optics and spectroscopy, specifically how light dispersion maps wavelengths to spatial positions.
Digital image representation, including pixel intensity values, grayscale conversion, and coordinate mapping.
The concept of instrument calibration, specifically mapping pixel columns to physical wavelengths using reference emission lines.
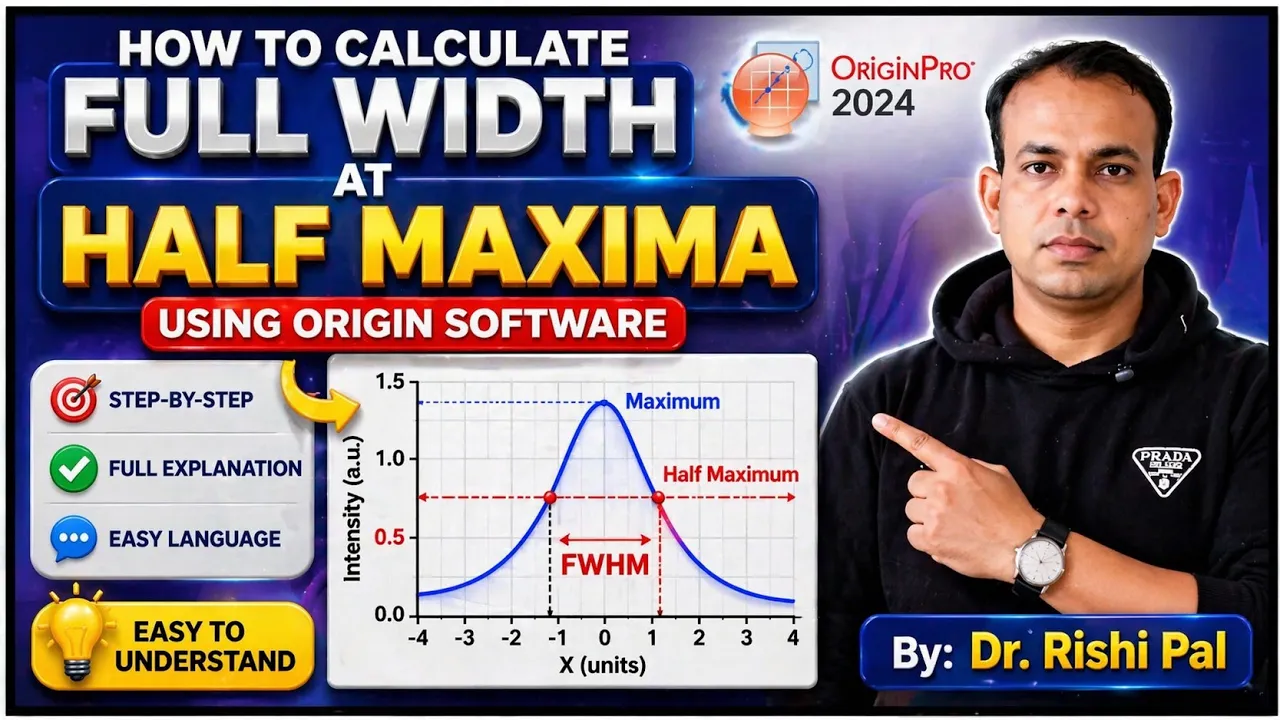
Spectral peak analysis, including fitting algorithms (e.g., Gaussian, Lorentzian) and calculating Full Width at Half Maximum (FWHM).
Signal processing techniques for noise reduction, such as smoothing filters (e.g., Savitzky-Golay) and baseline subtraction.
Developing automated data processing pipelines and custom graphical user interfaces (GUIs) in MATLAB for high-throughput spectral analysis.
Applying spectrometer data analysis to real-world applications such as chemical identification, material characterization, or astronomical spectroscopy.
319 views5likes8:35Original Release: 2024-10-24
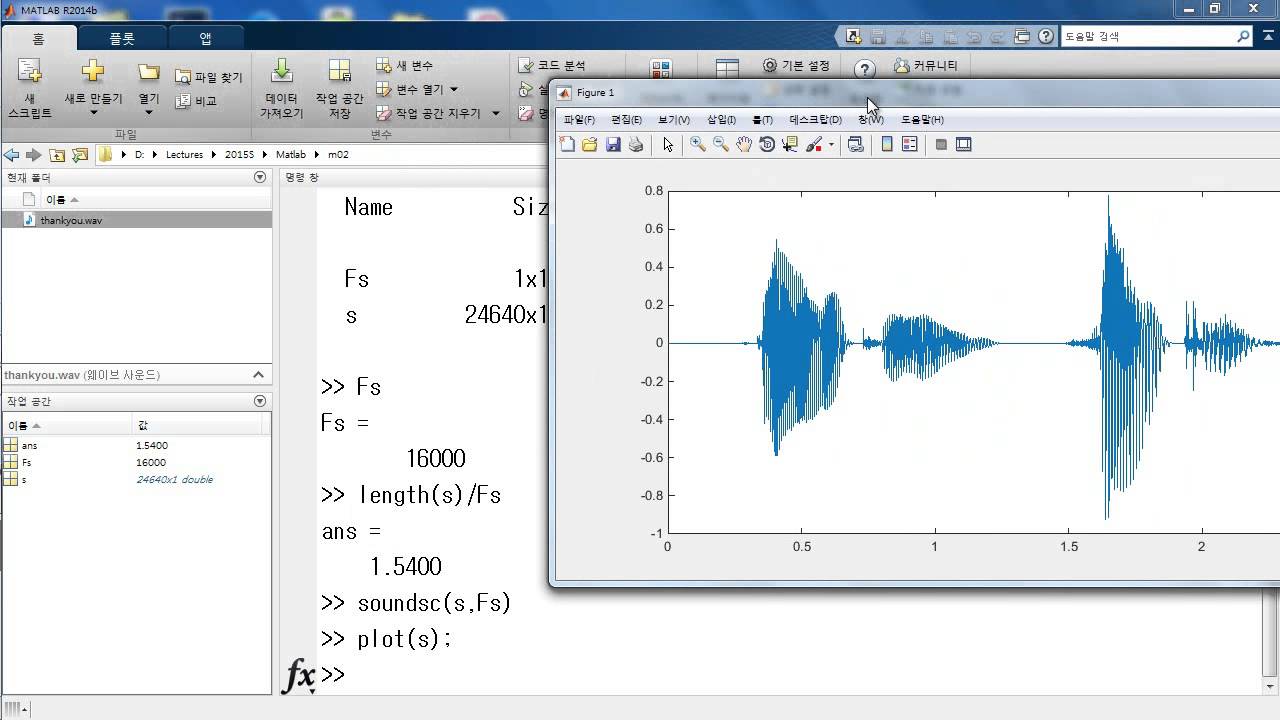
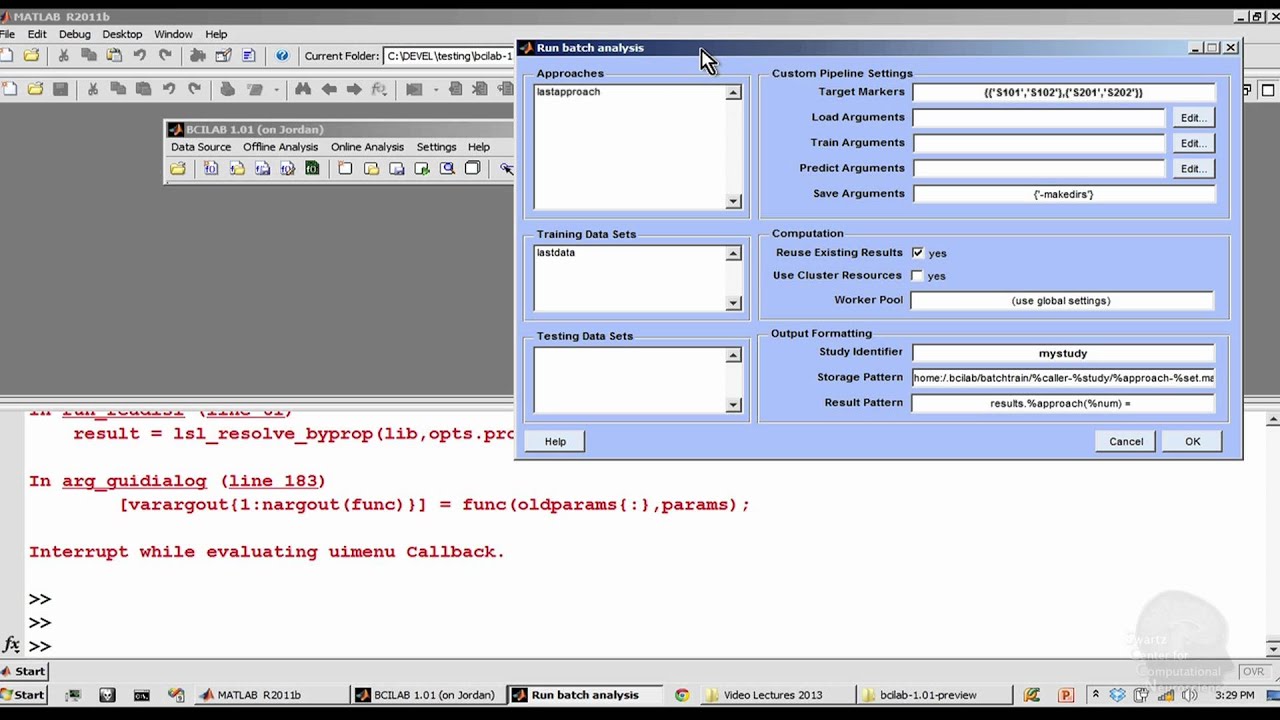
all right hello so I'm here still in task 2B for the spectrometer project um we just I just recorded a short video which I shared with you looking at part a uh which is the calibration of the spectrophotometer in so in in part A we computed the pixel ratio right was the the first task um and then we computed the uh it distance to the left edge of the image and so what we're going to do in B now is using that same image using those two reference values we're going to generate a spectrum okay and so our calibration was done once the steps to generate our Spectrum this would be done for you know as many images as you um generate with your spectr photometer and so let's let's take a look at this so I'm going to jump over to mat lab okay so I'm still sitting in the same directory so last time we we ran this length to pixel ratio this time I'm going to run uh measure Spectrum okay and so I'm going to do that by typing in my command window measure Spectrum okay and I see a note even down here in the bottom left okay measure spectrum is going to be a function that has input arguments it has two in this case the first is that uh pixel ratio and then the second was the distance to the left edge of our image and so if I jump back over here okay I have the values typed in here but if I were to scroll up right my pixel ratio is 0.567 right right and you'd use the values for your spectrometer okay and then the distance that I get was 5 142 okay so this is going to be unique to your spectr photometer right so your values are very likely different than mine so when I click return I'm going to get a prompt just like before to select an image and here I'm still working with this sample image so I'm going to select CFL bulb.jpg I'm going to open it up okay I can see this command or this prompt you might not see it because the figure opens up in a new window by default I have two screens that it puts mine on on another window okay but you could read um the instructions there and they're detailed in our document and what I'm going to do here is I'm going to construct a horizontal line across my image and so it's going to go from the left Edge to the right Edge and so I want to try and position my cursor so I'm as close to the center of my bands as possible to cut through them uh so mine maybe it looks like it's somewhere here around 300 and you know it's a little tricky in terms of picking the left Edge CU if I'm off my image it won't select it and so I'm going to be close to that edge and so let's me see here if I click once okay I've got my line forming I'm going to bring this all the way across to the other side of my image right to the right Edge and I want to try and keep this as horizontal as possible and once I have that and I'm satisfied with my placement I'm going to double click okay so it pops up in another window and for me on another screen but you'll get a figure window two figure window two is going to contain your original image and then the generated spectrum and so what I note in the instructions is when I save this image it'll be better if I um make the image larger here on my screen so I'm going to click here to maximize my window so here's my original image and then here's the resulting Spectra so the intensity versus the wavelength and so I want to save this as an actual image and so how I do that is up here in the top left I have a file save as okay and by default actually shows jpg which is probably what I Ed last um but by default right it's probably an fig file format which is a matlb figure format right fig is probably what should come up by default if you were to save it as an fig that just means you can open it up in mat lab lab uh and edit and manipulate it for your lab report though you're going to want an actual image format uh there's a lot available um jpg right would be a common popular choice uh PNG uh is on there as well where are you PNG believe PNG was what Windows used to like there's tips down there PDFs um I like um there's pngs which I believe is what Windows used to like encapsulated postcript is another option um so I think in the instructions I selected jpg okay which is good here maybe it me click PNG just for comparison okay but if you select the file format then it'll give that the default extension and I'm going to call this example spectrum.png if you want another file format I can just do a save as and then just select that format as well all right so maybe I want jpg as well okay cool and that's it um so if I just minimize this I I can you know prevent closing it and if I come over here now I should see my images in the same window and so I have example Spectrum PNG and jpg these are located in the same directory where my files are saved um and so you can navigate to them on your computer and open them up if I right click here and I click open outside of matlb it'll open up in the default image viewer that you have on your computer okay and so that's what my PNG looks like that's what my jpeg jpg looks like um and you can save it as other formats as well now I didn't close my figure Windows okay but if I click on my computer on my mat lab window it'll show my open windows so I have figure one and figure two where once I have my images and I'm satisfied right I can just close them okay then the other piece of information um that's produced now I I will say right these can vary too from if one person on your team does this to another these are going to be sensitive to where you place that horizontal line across your image so if two people on the same team are analizing the same image even with the same inputs here in terms of the pixel ratio and distance to the left Edge two people right are going to differ how exactly they draw that horizontal line which could produce uh some different values here um and actually I shouldn't have closed my figure window so let me just open up uh say my PNG just for comparison right and so what's being displayed here is it says the maximum red intensity and the corresponding wavelength R we've got the intensity and the wavelength so what we're looking for is you're essentially it's Iden finding the maximum right the peak right in my Spectrum which looks like it's somewhere around here so it' be my Peak intensity right and they're recording the value and then the wavelength is your x value right where that's occurring so maximum tensity is 240 and it happens at about 603 nanometers right so just beyond 600 right is where that Peak is happening um you'll notice for the others right we get multiples right and we come back to that so green um here's my maximum intensity 240 and that's where it's occurring right and this is just remember these are kind of discret state points right so it might be you know I have some small you know oscillation within this image which I can't quite make out with my eye okay um and then there's my Blue Max intensity uh as well but that's the the basic of of running the code um give it a try uh if you need any help let your TA or instructor know
Up Next
12:40
Aspect Ratios in Cinema: A Guide for Filmmakers
@InDepthCine
143.3K views•2022-10-09

12:54
Triumph of Orthodoxy Icon: Byzantine Art & History Explained
@BenCallan
2.1K views•2024-08-06

9:49
FastAPI vs Flask vs Django: Choosing the Right Python Web Framework
@TechWithTim
302.5K views•2024-05-26

1:42
Game of Thrones Opening Credits: A Cinematic Analysis
@gameofthrones
46.3M views•2011-04-18
Related Study Plans & Knowledge Roadmaps
Structured learning paths in General & Interdisciplinary Studies
general-studies
Elevator Engineering: History, Physics & Cities
01From Hoists to Safety Brakes: The Dawn of Vertical Lift
02Hydraulic vs. Traction: The Engineering Physics of Elevators
03Modern Speed, Safety, and Algorithms
+ 2 more learning modules
12h5 modules
Explore Roadmap
general-studies
Rubber: Material Science, History & Geopolitics
01Origins of Natural Rubber & Mesoamerican History
02The Chemistry of Natural Rubber & Vulcanization
03The Geopolitics of the Rubber Boom & Colonization
+ 2 more learning modules
12h5 modules
Explore Roadmap
general-studies
Containerization: Evolution, Logistics & Trade
01Ancient Trade & Bulk Cargo: Amphorae to Barrels
02The Industrial Revolution & Cardboard Packaging
03The Containerization Revolution: Malcom McLean
+ 2 more learning modules
12h5 modules
Explore Roadmap
general-studies
Textile Tech: Evolution, Labor & Global Impact
01Pre-Industrial Textiles: Handloom & Cottage Industry
02Mechanization: The Spinning Jenny to the Power Loom
03The Factory System & Global Labor Transformation
+ 2 more learning modules
10h5 modules
Explore Roadmap